-
Paper Information
- Next Paper
- Paper Submission
-
Journal Information
- About This Journal
- Editorial Board
- Current Issue
- Archive
- Author Guidelines
- Contact Us
International Journal of Sports Science
p-ISSN: 2169-8759 e-ISSN: 2169-8791
2013; 3(5): 141-146
doi:10.5923/j.sports.20130305.01
Correlation between Agility, Lower Limb Power and Performance in a Sport-Specific Test in Female Volleyball Players
 Abstract
 Reference
 Full-Text PDF
 Full-text HTML
Gustavo Z Schaun, Yuri S Ribeiro, Marcelo S Vaz, Fabrício B Del Vecchio
Escola Superior de Educação Física, Universidade Federal de Pelotas, Pelotas, 96055-630, Brasil
Correspondence to: Yuri S Ribeiro, Escola Superior de Educação Física, Universidade Federal de Pelotas, Pelotas, 96055-630, Brasil.
| Email: |  |
Copyright © 2012 Scientific & Academic Publishing. All Rights Reserved.
To evaluate the general and specific physical performance of female volleyball players. Methods: Eight athletes (22 ± 4.04 years; 175.6 ± 7.24 cm; 71.1 ± 7.07 kg) were evaluated for agility, lower limb power and performed a volleyball-specific test. Data were analyzed using an ANOVA with repeated measures, Pearson correlation and the linear tendency test. Results: Correlations were observed in specific volleyball test variables, and between agility and lower limb power (r = -.77; p = .03). Furthermore, in the specific volleyball test, there was a linear trend of an increase in the trial time, and at the height of attack it was observed a linear trend to decrease (p < .05). Conclusions: The general and specific performance are similar to those in the literature; significant correlations were observed and the performance of players decreases during repetition of high-intensity efforts in the sport-specific test.
Keywords: Volleyball, Athletic Performance, Lower Limb Power, Agility
Cite this paper: Gustavo Z Schaun, Yuri S Ribeiro, Marcelo S Vaz, Fabrício B Del Vecchio, Correlation between Agility, Lower Limb Power and Performance in a Sport-Specific Test in Female Volleyball Players, International Journal of Sports Science, Vol. 3 No. 5, 2013, pp. 141-146. doi: 10.5923/j.sports.20130305.01.
Article Outline
1. Introduction
- Volleyball has become an increasingly dynamic sport. The profile of the athlete has been changing and physical capacities are increasingly required. In this context, optimal muscle strength and power, together with technical and tactical skills are necessary to practice the sport at a high level of performance[1]. To reach this level various strategies can be adopted during planning and development of the training process, and these can be implemented through training prescription[2]. Several tests have been proposed and applied for measuring the physical performance of volleyball players. Among the many different tests, one example is the vertical jump test proposed by Sargent[3] in 1921 that measures jump height[4]. Vertical jump height is particularly relevant in volleyball, and is directly linked to the athletic performance in various situations[4–6]. The ability to perform quick and vigorous movements is also important in volleyball[7]. However, some authors have questioned the specificity of these skills, for although validated and reliable, they do not perfectly reflect the demands of the sport nor the predominant energy requirements during its practice[8]. Evaluation of players with repeated effort tests that consider the relationship of effort and pause is another option to assess performance. This has been applied in several sports such as volleyball[8] and football[9], and it must consider various factors including the game situation[10], their specific actions[11–12], and the metabolic characteristics of the sport[13–14].In addition to evaluating athletes with a panel of general and sport-specific tests, searching for possible relationships between the physical abilities that comprise the training program is another useful tool for optimizing the physical conditioning process[15]. A deeper understanding of these relationships makes it possible to organize the most effective training sessions for the specific physical demands of volleyball. Therefore, the aim of this study was to measure and correlate the performance of female amateur volleyball athletes using general and sport-specific physical tests.
2. Material and Methods
2.1. Type of Study and Research Subjects
- The present study was an observational correlational design[16] involving eight amateur athletes of an adult women's volleyball team from the city of Pelotas, Brazil. The research subjects were characterized by an average of 22 ± 4.04 years of age, a height of 175.6 ± 7.24 cm, a body mass of 71.1 ± 7.03 kg and they had 11.3 ± 4.72 years of experience.At the time of this study the athletes had three to four training sessions per week and were in a preparation period for a state level competition. The choice of this sample was based on several factors including (i) the need for athletes who already had experience with the sport, (ii) they had passed the selection process for entry into the team, and (iii) they had experience with regional and state championships. Furthermore, the sample size was adequate when compared to the validation and application of the test proposed by Sheppard et al[8] that was based on 12 athletes. The participants were volunteers and had completed an informed consent agreement that was approved by the local research ethics committee.
2.2. Study Design
- The studies herein were performed over the course of two visits to the facility where the athletes perform their routine training. Research was conducted with prior administrative authorization and approval of the technical commission involved. Before the visits, the athletes were informed about the routines that would be carried out, and were advised to attend on the times and days scheduled. On their first visit, self-reported information was collected about the frequency and duration of their competition and training times, as well as body weight and height.Trained evaluators applied the assessment protocols to the athletes on the second visit. After clarification of any questions, a standardized warm-up of eight to ten minutes was performed that included low intensity running, dynamic stretches and exercises with jumps and high-intensity sprints[17]. To familiarize the athletes with the volleyball - specific test they were asked to first perform the routine at submaximal speed. Afterwards, the test was repeated at full speed and the variables of interest were measured. Following a five minute recovery interval the athletes performed the square test to measure agility, and after another five minute recovery, the countermovement vertical jump test was executed. The sequence of the applied tests followed the American College of Sports Medicine guidelines[18].
2.3. Physical Performance Tests
- For the evaluation of volleyball-specific aspects, the test proposed by Sheppard[8] was used, that has been validated through time-motion analysis to mimic the physiological requirements of the sport. The test was also validated through specific analysis of the volleyball block, in order to approximate the height and penetration required for high performance. It demonstrates intraclass correlation coefficients of 0.93 for attack’s jump height and 0.96 for displacement speed[8]. The protocol consists of two attack jumps, four blocking jumps and displacements to both sides, as shown in Figure 1. In the case of left-handed athletes the test starts on the right side of the court, the same four meters away from the net.The experiment was conducted as follows: at the signal of the evaluator the athlete performs one attack jump, after contact with the ground they start the displacement to the right, passing by the timing light 1 (1.5 m from the left sideline and 1.5 m from the 3 meter line) that triggers a stopwatch; they then perform a blocking jump on the ball situated one meter to the left of the court center, that is 239 cm tall. In the sequence the subject moves to another ball located at the same height and depth as the first and a meter to the right of the court center. Following this jump, the player continues the displacement up to one meter from the right side of the court. After reaching this mark, they move in the opposite direction, and this is followed by the two blocking jumps. At the end of the second blocking jump, the athlete recoils diagonally and passes by the other timing light (on the 3 meter line and 3 meters from the sideline), stopping the stopwatch. Once completed, a last attack jump is performed.
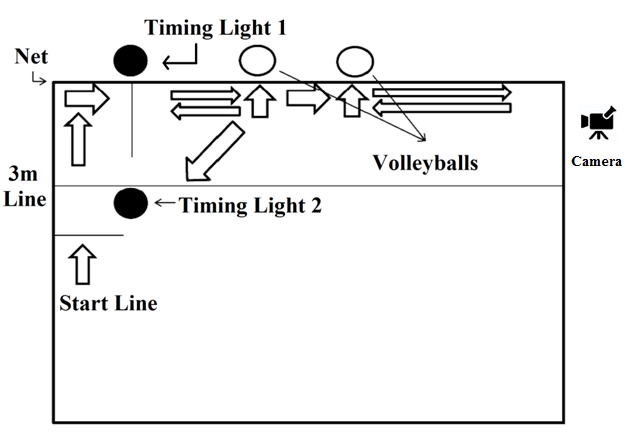 | Figure 1. The drafting of the Sheppard’s repeated-effort test for volleyball |
2.4. Statistical Analysis
- A Shapiro-Wilk test was first used to evaluate data normality. Descriptive statistics including the mean, standard deviation (SD) and coefficient of variation (CV) were calculated. An analysis of variance (ANOVA) with repeated measures and a linear trend test were used for comparison between the different aspects of the volleyball-specific test. The Pearson correlation coefficient was applied between variables of interest and in all analyses P < 0.05 was considered statistically significant. The magnitude of the correlations were expressed as ‘r’; with values below 0.30 characterized as low or none, r between 0.30 and 0.49 as weak, 0.50 to 0.69 as moderate, 0.70 to 0.89 as strong and values 0.90 or greater as very strong[16]. For the ANOVA F-value, the Cohen’s effect size was also provided.
3. Results
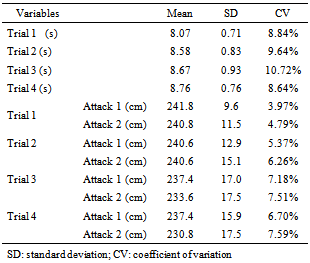
- The players completed the square agility test in 5.7 ± 0.2 s (CV = 3.8%), and the mean of the lower limb power test (vertical countermovement jump) was 38.4 ± 9.4 cm (CV = 24.4%). The results of the volleyball-specific test are presented in Table 1. The height of the two attack jumps and the time for completion are presented, for each of the four passages of the test.For the volleyball-specific test, linear trends were observed in the two variables measured. The first of these concerned the displacement time (Figure 3, Panel A), that identified an elevation in each new execution (F = 33.24, P = 0.001, power = 0.99) and significant differences between times 1 and 2, 1 and 3, and 1 and 4 (P < 0.05 for the three situations). Attack height showed a tendency to decrease between the passages (F = 9.11, P = 0.02, power = 0.71), and the differences were significant (Figure 3, Panel B).
|
|
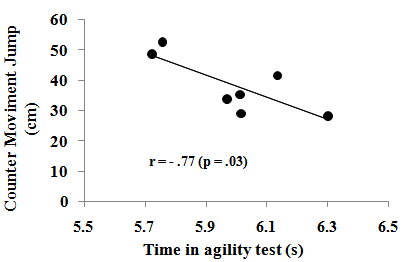 | Figure 2. Representation of the correlation between speed and lower power observed in this study |
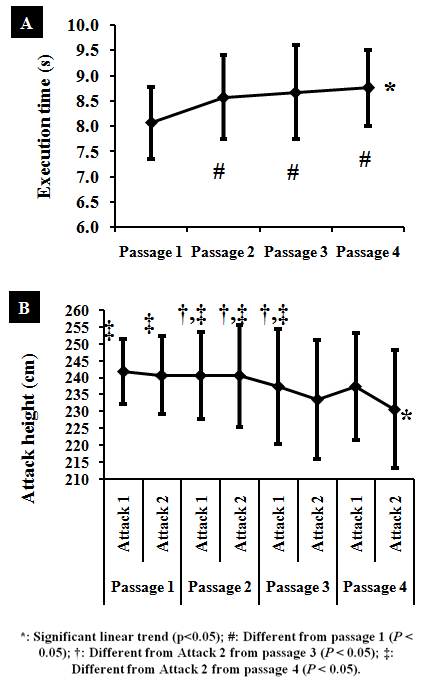 | Figure 3. Performance of women in specific test. The Panel A displays the time in each passage and the Panel B displays the successive attack height measures |
4. Discussion
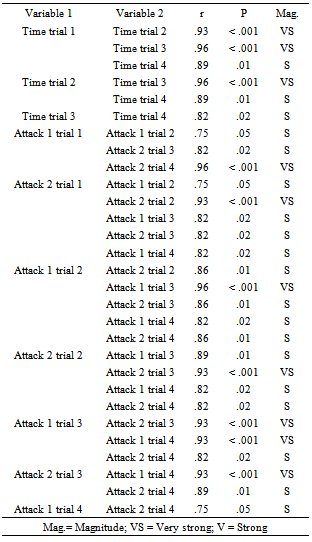
- The main finding of this study was the correlation found between agility and lower limb power (Figure 2). Agility is particularly relevant to volleyball players since the sport requires intense movements involving acceleration and deceleration, linear and lateral displacements, and changes of direction[8, 20]. The population reference value of the square test for girls 17 years of age is 5.54 s, corresponding to excellent performance[19]. The performance of the athletes studied herein, although they were adults, was very close to this reference value at 5.73 ± 0.22 s. Comparison of the scores obtained by the participants of this study with other volleyball athletes is limited due to the lack of studies based on the very same methodology. However, this fact does not preclude the usage of the test scores, since the displacement distance and changes of directions can be considered similar to those observed in volleyball games[20].Lower limb power, as measured by the countermovement jump, is an important determinant of competitive success in volleyball and other team sports[20]. Various parameters contribute to muscle power including the rate of strength development, speed strength, stretch-shortening cycle as well as intra- and inter-muscular coordination[2]. In this context, the vertical jump values of the amateur athletes evaluated herein are lower than those reported in the literature for high performance female athletes that measured between 47.13 ± 8.46 cm and 52.8 ± 6.33 cm[21], and in comparison to the United States of America national team athletes at 52.4 ± 4.51 cm, and with university athletes, at 45.5 ± 6.4 cm[22]. These differences can be explained by the use of different equipment for measurement of the variables and also the competitive level of the athletes[22] since the training programs for high performance athletes may require significantly higher training load-related variables than women of recreational or amateur levels.The average jump height value and time of displacement in the present study were 239.95 ± 3.1 cm and 8.52 ± 0.3 s, respectively. Sheppard[8] performed the same measurements among professional male athletes and the values obtained were 324.0 ± 9.1 cm and 7.8 ± 1.0 s, respectively. It is worth noting that there are differences between the physical performance of men and women[23] and also between volleyball players of different competitive levels[21] that may explain the lower performance of the amateur female athletes studied herein.In the volleyball-specific test, a linear trend was found between both time and attack height and the passage number, indicating there was a loss of performance with successive efforts. This may have occurred due to the high-intensity repeated efforts required for this procedure that was developed to simulate the specific metabolic demands of volleyball[8]. The correlations presented in Table 2 support this conclusion, and the finding may reflect the fact the athletes fail to fully recover during the intervals between the four passages. This may be due to inadequate metabolic re-synthesis of adenosine triphosphate, increased anaerobic metabolism, and the inability to restore creatine phosphate[23]. Furthermore, the inability to maintain an optimal movement pattern and a decrease in the quality of the technical action may explain the decreasing performance with every repetition[8, 24].The agility test showed a moderate negative correlation with vertical jump height. This, in turn, is executed through fast muscular short-stretching cycles (SSC) of lower limbs, and during the execution of displacement skills, the same process occurs (i.e. fast muscular SSC). To this end, the elastic properties of muscle and the energy stored by this process are applied towards the SSC[25]. In support of our findings, previous studies have shown that speed and agility are dependent on muscle power[26, 27],, and also that the effects of the muscle power training can be transferred to actions that involve rapid changes of direction[15]. The volleyball-specific test is considered a suitable tool for evaluating players of this sport[5, 28], and it offers an immediate practical application when the objective is to assess the variables during matches. In addition, the correlation found between agility and lower limb power can allow for optimization of training strategies, since the literature presents evidence reporting the use of the same training methods for the development of different physical abilities[27, 29].The limitations of the present study include the small sample size, and the fact that although the procedures are suitable for evaluation of volleyball-specific actions the height of attack may be influenced by the technical level of the athletes. The volleyball-specific test showed a linear trend for increasing time and decreasing height of attack jump, and there were statistically significant differences between repetitions Several correlations were observed between the specific test variables.
5. Disclosure of Interest
- The authors declare that they have no conflicts of interest concerning this article.