-
Paper Information
- Previous Paper
- Paper Submission
-
Journal Information
- About This Journal
- Editorial Board
- Current Issue
- Archive
- Author Guidelines
- Contact Us
International Journal of Sports Science
p-ISSN: 2169-8759 e-ISSN: 2169-8791
2013; 3(4): 135-140
doi:10.5923/j.sports.20130304.07
Effect of Whole Body Vibration during Static Squats on the Myoelectrical Properties of the Vastus Lateralis
 Abstract
 Reference
 Full-Text PDF
 Full-text HTML
Dan Robbins , Mark Goss-Sampson
Centre for Sports Science and Human Performance, University of Greenwich, Chatham, ME4 4TB, UK
Correspondence to: Dan Robbins , Centre for Sports Science and Human Performance, University of Greenwich, Chatham, ME4 4TB, UK.
| Email: |  |
Copyright © 2012 Scientific & Academic Publishing. All Rights Reserved.
The effects of whole body vibration (WBV) on EMG timing, frequency and amplitude have previously been studied, however to best of the authors knowledge there have been no studies on the effect of WBV on the conduction velocity of myoelectrical signals. Muscle fibre conduction velocity, EMG frequency and amplitude of the vastus lateralis were therefore assessed in twelve male participants (1.81 +/- 0.1 m, 82.2 +/- 10.7 kg, 25.4 +/- 4.0 years) at the start and end of partial static squats, both with and without WBV (40 Hz 1.9 mm vertical displacement). Significant differences were found in the median frequencies, but not in the conduction velocity or signal amplitude. The observed changes are indicative of whole body vibration increasing the vastus lateralis muscle activity but not to a level indicative of physiological fatigue. These observations are of use to exercise and rehabilitation practitioners considering the use of vibration in exercise protocols.
Keywords: Whole Body Vibration, EMG, Array, Conduction Velocity, Frequency, Static Squat
Cite this paper: Dan Robbins , Mark Goss-Sampson , Effect of Whole Body Vibration during Static Squats on the Myoelectrical Properties of the Vastus Lateralis, International Journal of Sports Science, Vol. 3 No. 4, 2013, pp. 135-140. doi: 10.5923/j.sports.20130304.07.
1. Introduction
- The relationship between muscle fibre conduction velocity (CV) and the frequency content of surface electromyography (EMG) has been studied for many years. Previously studies focused on animal musculature[1] progressing to more recent studies based on human participants[2]. Throughout this period studies have consistently indicated a relationship between CV and frequency content. In an early attempt to ascertain the exact relationship[3] compared the influence of local warming of muscle, in the absence of exertion, against fatigue inducing contractions. The results indicated both approaches were capable of inducing change in frequency content; however contractile action had a much greater influence on CV. The authors inferred this to indicate that there must be factors other than CV influencing the frequency content of myoelectrical activity. In 1987[4] investigated the relationship between CV and frequency changes in short duration contractions followed by recovery with and without induced ischemia. The results indicated different recovery patterns for CV and median frequency (MDF). MDF recovered fully in all subjects but CV only partially recovered. The authors therefore concluded that blood flow influences CV but not frequency. The effect of CV of vastus lateralis during different contraction types (isometric vs. dynamic) has also been considered[5], where isometric contractions resulted in significant decreases in CV whilst dynamic contractions did result in any significant change. Both contractions resulted in significant increases in amplitude and decreases in MDF, though not significantly different from each contraction type. Based on these findings the authors concluded that metabolic state has a greater influence on CV than on MDF or amplitude and that changes in MDF cannot be explained by CV alone. The concatenation of reported conclusions of these investigations suggests that changes in parameters of tissue oxygenation affect EMG, this hypothesis was confirmed[6], including further investigations into both the changes recorded via near infrared spectroscopy and EMG resulting from WBV during isometric squats. Based on these findings it can be proposed that the combination of myoelectrical signal frequency and CV analysis will provide the option of identifying influences on contractile function. To date research on the effect of vibration on EMG frequency has been equivocal, with reports of the mean power of the frequency decreasing in lower limb muscles[7], increasing MDF of the vastus lateralis during squats[8] and increasing MDF of vastus lateralis and rectus femoris during knee extensions following vibration[9]. Previous publications have indicated that WBV increases blood flow[10], however, if isometric contractions are preventing the perfusion of blood into muscles via increased intramuscular pressure[11] it can be hypothesised that the muscular contractions can induce ischemia and can be detected via reduced CV. Therefore the aim of this study was to investigate the influence of WBV on myoelectrical activity during squat exercises to provide an insight into the physiological consequences on muscular contractile activity of adding vibration to exercise.
2. Methods
- This study was carried out in accordance with University Ethics Guidelines and the ethical standards of the Declaration of Helsinki. All participants provided informed consent. Twelve male participants (1.81 +/- 0.1 m, 82.2 +/- 10.7 kg, 25.4 +/- 4.0 years) with no recent history of illness or lower limb musculoskeletal disorders volunteered for the study. Myoelectrical activity was acquired from the vastus lateralis with an EMG-USB system (OTbioelettronica, Torino, Italy) using an 8 sensor EMG surface array with an inter-electrode distance of 5 mm. To identify the optimal location for array placement, a reference line was first drawn on the surface of the thigh aligned between the anterior superior iliac spine and the top of lateral pole of the patella. A second line representing muscle fibre orientation (FO) was drawn from the top of the lateral pole of the patella 20ο relative to the reference line. This process has been defined by and thoroughly reported[12] using anatomical measures of muscle fascicle orientation to establish the technique. Prior to placement of the EMG array the region between the innervation zone and the distal tendon was determined. The innervation zone has been reported to be an average distance of 94 mm from the patella[13]. Therefore, the skin was shaved at a distance of approximately 100 mm along the FO line and cleaned with alcohol. Each participant was then asked to perform a sub- maximal muscle contraction, whilst a 16 electrode silver bar electrodes (5 mm x 1 mm, inter electrode distance of 5 mm) was used to identify the innervation zone along the FO line. The innervation point was identified as the electrode position where signal reversal was observed (see figure 1). After identification, an area distal to the innervation in line with FO was marked for recording vastus lateralis conduction velocities. Following marking for array placement, participants undertook 5 min of stationary cycling at 70 rpm (50 W) as a warm up. Prior to placement, the recording area was re-cleaned using alcohol. An 8 electrode array was attached using a double sided adhesive foam pad. 30 μl of hypoallergenic conductive gel was pipetted (Eppendorf multipette plus) into each electrode well to improve signal quality.All exercises were performed on a Power Plate® pro6 (Power Plate International Ltd) whole body vibrating platform. Six alternating sets of 50 s unloaded isometric partial squats were performed with either no vibration (NVIB) or whole body vibration (VIB; 40 Hz 1.9 mm vertical displacement). The initial squat condition (NVIB vs. VIB) was randomised for each participant. Pilot testing indicated that the vibration platform caused significant noise contamination of the EMG signal. Therefore, data was acquired from the first and last 5 seconds of isometric partial squats. During squats with vibration, 30 seconds of vibration was introduced after the initial data collection. The squat position was also maintained after vibration exposure to allow for a second set of data collection. An additional 5 seconds before and after vibration was incorporated in to the protocol to allow the vibration platform to fully start and stop without influencing signal acquisition. CV and amplitudes were calculated during sequential 0.5 s epochs using OTBioLab software (OTbioelettronica, Torino, Italy). CVs were determined using high resolution alignment of sampled waveforms from 3 of the 8 channels of the acquired data array. This process has been previously reported in detail[14].
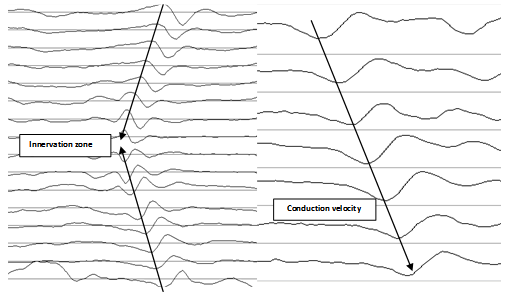 | Figure 1. Representative EMG signals |
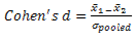 | (1) |
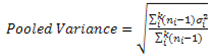 | (2) |
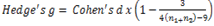 | (3) |
3. Results
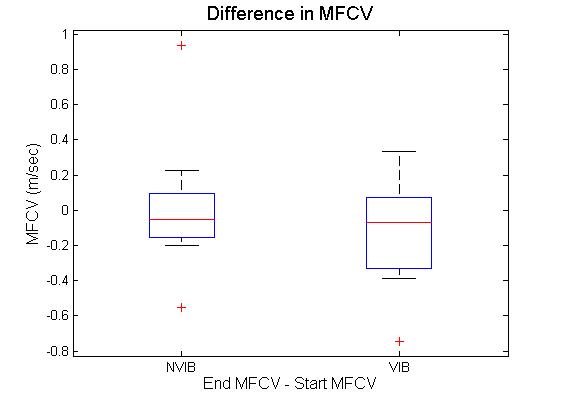 | Figure 2. Difference in muscle fibre conduction velocity at the start and end of squats with and without vibration |
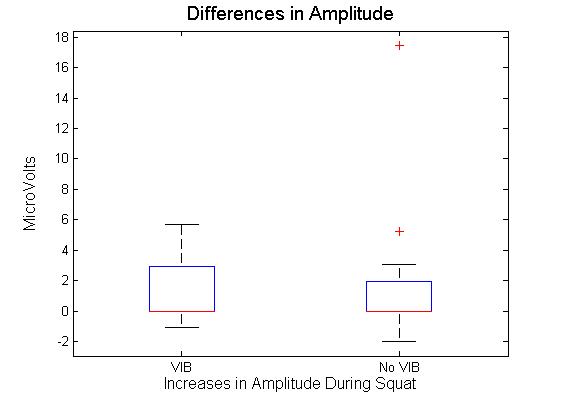 | Figure 3. Difference in signal amplitude at the start and end of squats with and without vibration |
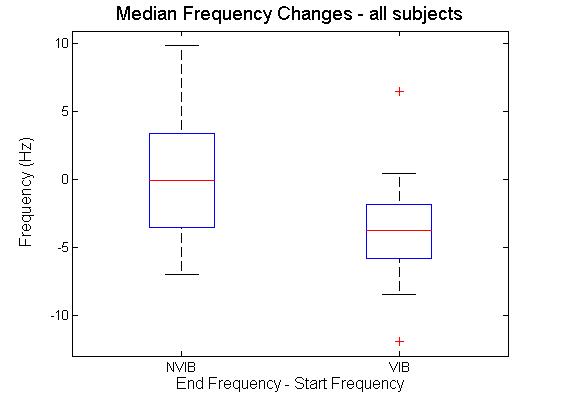 | Figure 4. Difference in median frequency at the start and end of squats with and without vibration |
4. Discussion
- This study investigated the effect of static partial squats on myoelectrical activity of the vastus lateralis. Partial squats were employed based on a previous investigation[15], comparing deep, parallel or partial squats. Results indicated there was no significant difference between biceps femoris, vastus medialis or vastus lateralis EMG activity between the squat depths analysed. The EMG array placement reflects that previously reported[12], with indications that specific and consistent placement of the electrode is required if the signals are to be compared across subjects. The recommended location of the sensor also matches that previously reported in[16], where results indicate CV is most stable when obtained between the innervation zone and the myotendinous junction. This region was also reported to produce the highest values for MDF, though the rate of change was not affected by sensor location. While previous studies such as that of[12], have used the EMG array to analyse knee extension, static squats were selected for this study. This decision was based on two factors. Firstly, it is impractical to add whole body vibration to knee extension as it is not practical to place resistance equipment on to the vibration platform. Secondly, it has previously been shown that squats produce both greater amounts of myoelectrical activity and greater reduction in MDF in the vastus medialis and lateralis compared to knee extension[17]. Shift in MDF has long been used as an indicator of fatigue during isometric contractions[18]. Previous investigation[5] considered the effect of both static and dynamic contractions on both MDF and CV of the vastus lateralis during knee extensions; their results indicated that isometric extensions elicited greater changes in both MDF and CV, with no change at all in CV during dynamic exercise.Over all the results in the current study indicate that the only significant differences obtained was the decrease in MDF. The fact that the MDF did not change in the NVIB condition suggests that the warm up was appropriate, as previously it has been shown that active warm up increases the MDF of exercising muscles and this effect relates to increases CV[19]. An important point to note is that while there was a significant decrease in MDF, this is unlikely to be indicative of a physiologically fatigued state. There are two reasons which indicate this to be true. Firstly the reduction in MDF was 4.6%. Previous studies inducing fatigue whilst measuring MDF have found the reductions to be much greater e.g. 10% decrease[20] 22.4%[5] and 12-26%[21]. Therefore while the reduction in MDF observed is suggestive of the onset of physiological fatigue, it is unlikely that the participants actually reached a fatigued state via this protocol. Secondly the effect size for the change in the vibration group was 0.2, which is a small effect size[22]. When comparing the amount of change in MDF between VIB and NVIB conditions, the effect size was 0.8, indicating a large difference between the two conditions.No significant differences were obtained in CV, although it could be argued that the level of contraction was potentially not high enough to induce a change. It has been suggested that a linear relationship between CV and MDF during isometric contractions at 40% of MVC exists[4]. However, further investigations on the effect of varying intensities of muscular contractions (as percent of MVC) on changes in CV of both biceps brachii and vastus lateralis[11]. Thresholds of 20-30% MVC were identified as increasing CV, whilst 40% of MVC was identified to induce a reduction in CV. It was also reported that at all intensities CV is sensitive to changes in blood flow[11]. In contrast[23] investigated isometric contractions of the biceps brachii at 60% and 70% of MVC. In all participants the mean frequency and the CV were reported to vary linearly, both decreasing during sustained muscle contractions. This led the authors to conclude that frequency shifts occurring during fatiguing muscle contractions are a consequence of reduce CV. Additionally, previous research[3] considered two different influences on myoelectrical properties of the adductor pollicis muscle. Firstly a 60 second maximal voluntary contraction (MVC) was employed to induce fatigue and secondly muscle temperature was changed in the absence of fatigue. Both protocols induced similar changes in signal frequency. However, fatigue was found to have a much greater influence on CV than temperature. The baseline CV and amount of change is also dependent on muscle fibre type ratios. Participants with greater volume of fast fibres will have greater CV than participants with majority slow fibres[24],[25]. This observation has been investigated via electrical stimulation whilst monitoring the level of intracellular free calcium[26]. It was found that a single electrical stimulation of fast twitch fibres would elicit an action potential and a rise in intracellular concentration approximately three times faster than slow twitch fibres. Based on these findings it was concluded that in fast twitch fibres calcium may be delivered at a faster rate to contractile proteins. This is likely to be the explanation for variances in baseline CV and MDF measurements. However, this is unlikely to influence the results obtained as the data analysis focussed on the change in parameters between the start and the end of the squats. Muscle fibre type can influence resistance to change on myoelectrical parameters. However, it should be noted that when comparing participants with varying ratios of fast and slow twitch muscle fibres it can take 25-30 knee extension repetitions before differences are observed[21]. The combination of these results refutes the hypothesis that WBV results in contractions generating intramuscular pressure preventing the perfusion of blood in to muscle tissue.
5. Conclusions
- In summary the results obtained indicates that acute exposure to WBV does not affect CV or amplitude of myoelectrical signals. The frequency content of the signal is statistically significantly reduced during squats with WBV. However, this is unlikely to represent a physiologically fatigued state. The value of this information is that it indicates that WBV increases the muscle activity during static squats without inducing fatigue. This finding is potentially beneficial for practitioners in rehabilitation, health and exercise who may incorporate vibration in to exercise protocols.
ACKNOWLEDGEMENTS
- The authors acknowledge and thank Marco Cardinale at the British Olympic Association for the kind loan of the EMG array system used to acquire data for this study.