International Journal of Sports Science

p-ISSN: 2169-8759    e-ISSN: 2169-8791

2013;  3(4): 115-126

doi:10.5923/j.sports.20130304.04

A Comparison of Lifestyle Management Practices of Residents of Three Chinese Cities: Hong Kong, Macau and Weihai (Shandong)

Frank H. Fu 1, Zhaowei Kong 2, Hongzhen Zhang 3, Yanpeng Zang 1

1Dr Stephen Hui Research Centre for Physical Recreation & Wellness, Hong Kong Baptist University, Hong Kong, China

2Faculty of Education, University of Macau, Macao, China

3Department of Physical Education, ShangdongUniversity at Weihai, Weihei, China

Correspondence to: Frank H. Fu , Dr Stephen Hui Research Centre for Physical Recreation & Wellness, Hong Kong Baptist University, Hong Kong, China.

Email:

Copyright © 2012 Scientific & Academic Publishing. All Rights Reserved.

Abstract

Hong Kong, Macau and Weihai are modernized cities on the eastern coast of China with Western influences. This study compared the lifestyle management practices of residents in these three cities.Using a stratified random sampling technique, people in three Chinese citieswere administered lifestyle surveys by telephone interviews, street interviews or questionnaires. Weihaihad a higher prevalence of overweight and obesity (51.7%, p < .001) than Hong Kong (36.1%) orMacau (31.7%). Hong Kong (15.1%) and Macau (15.3%) hadmore underweight residents than Weihai (9.9%). Central obesity was significant (p < .001) in Hong Kong (20.2%), Macau (8.0%), and Weihai (43.7%). Hong Kong and Macau male residents and postmenopausal femaleshad more irregular meals and consumed more snacks, andin Weihaiboth the workforce and older people appeared to have a serious central obesity problem. The prevalence of overweight and obesity is a serious problem in these three cities. Public education regarding good practices and intervention strategies in Asian cities and in other parts of the world could be used to promote and cultivate better lifestyle management practices in the future.

Keywords: Lifestyle Management, Obesity & Health, Compare Study

Cite this paper: Frank H. Fu , Zhaowei Kong , Hongzhen Zhang , Yanpeng Zang , A Comparison of Lifestyle Management Practices of Residents of Three Chinese Cities: Hong Kong, Macau and Weihai (Shandong), International Journal of Sports Science, Vol. 3 No. 4, 2013, pp. 115-126. doi: 10.5923/j.sports.20130304.04.

1. Introduction

Unhealthy lifestyles make a significant contribution to ill health and mortality[1, 2, & 3]. Some lifestyle-associated factors such as tobacco smoking (active and passive) or excessive intake of alcohol have adverse effects on pregnancy outcomes[4]. Fortunately, lifestyles are changeable. Lifestyle modification could facilitate better management of diseases such as metabolic syndrome[5&6], improve blood pressure[7, 8, &9], reduce coronary heart disease risk[10], and decease the threat of cancer[11].
A healthier lifestyle, including an increase in physical activity and a reduction of body weight through the regulation of calories and fat intake, is the basis for the prevention and treatment of both type 2 diabetes and metabolic syndrome[12]. Prospective studies have shown that a minimum of 30 min/day of moderate to vigorous physical activity can prevent type2 diabetes and that healthy diets are effective and safe ways to prevent type2 diabetes and metabolic syndrome[13]. There is also ample evidence showing that the most effective approach to prevent and treat overweight and obesity is a combination of behavioral strategies in diet and exercise,as part of a sustained lifestyle change[14&15]. A comprehensive program of lifestyle modification is effective in inducing and maintaining losses of approximately 10% of initial weight,which is sufficient to prevent and ameliorate obesity-related health complications including type2 diabetes and hypertension[16]. Intervention studies based on changes in the lifestyle ofat risk individuals have found that the incidence of diabetes can be reduced by 42% to 63%[12].
In the past 30 years, the Chinese economy has been growing rapidly. Hong Kong and Macau are quite Westernized and modernized, although they are still affected by the Chinese mainland. The economic gap between the two cities and the mainland has narrowed and the cities’ high quality of life is sought by everyone. An appropriate lifestyle is an essential part of this life, and modifiable lifestyle factors are important components of these aspirations[17]. In the study reported here, Weihai, a seashore city in the northeastern China, was selected to represent the rapidly developing northeast of China(Figure 1). It was a British colony and is now a major seaport. However, Weihai’s history of development differs from that of Hong Kong. Increased public awareness of the links between lifestyles and common diseases might help people there better understand the potential health consequences of their actions and encourage them to make much-needed lifestyle changes [2]. Hence, we investigated the prevalence of health-related lifestyle factors and provided some important lifestyle factor comparisons to help better understand the threat of unhealthy behaviors and encourage citizens to lead healthier lifestyles in all three cities.

2. Methodology

2.1. Data Collection

For thisstudy of the lifestyle management practices of Hong Kongresidents, 3080 individuals from 5 to 74 years old,with a fixed quota for each age cohort, were recruited randomly. Household telephone numbers were randomly selected from the Telephone Directory published in 2010, with the fixed numbers (0, ±1, and ±2) added to the last digit, and the lifestyle data were collected through telephone interviews. In Weihai, data were collected through questionnaires. A total of 2800 questionnaires were delivered and retrieved, of which 2772 were valid (99%). Data collection in Macau was carried out through street interviews in October 2011; 731 citizens aged 15-79 years were randomly invited to our interviews and 480 people accepted and completed the questionnaire (65.7%). The distributions of the subjects are presented in Table 1.
The total populations of Hong Kong, Macau, and Weihai were 6,859,341 (2011 Population Census), 552,500 (2011 Population Census), and 2,804,800 (2010 Population Census), respectively. Given these figures, the samples were .041%, .087% and .092% of the total populations].
Figure 1. The location of Hongkong, Macau and Weihai in China
Table 1. Demographic characteristics of subjects from Hong Kong, Macau and Weihai (n=5883)
     

2.2. Instrument

The following variables were included in the questionnaire.
1. Morphological variables: body height, body weight, waist circumference (WC), Body Mass Index (BMI), and Waist Index (WI)
2. Nine lifestyle variables: exercise frequency, snacking habit, breakfast habit, regular meals, hours of sleep, drinking habit, smoking habit, medication usage, and medical expenditure.
Body weight, body height and WC were self-reported. Weight wasreported in either kilogram or pound; height and WC werereported in either centimetres or inches. Personal BMI (weight divided by the square of height, kg/m2) and WI (waist divided by height) were calculated by the researchers.
The standard classification for BMI in Asian populations is BMI <18.5 kg/m2 is underweight, BMI = 18.5-22.9 kg/m2 is normal weight, BMI = 23-24.9 kg/m2 is overweight, and BMI ≥ 25kg/m2 is obese[18]. WI has been reported to be a much better predictor of cardiovascular risk and mortality[19]and a better detector of cardiometabolic risk factors[20], than the more widely used BMI, WC, and weight-to-hip ratio.The norm value for WI for diverse populations is 0.50[21&22].
To measure the extent of exercise frequency, snacking habits, breakfast habits, regular meals, drinking habits, smoking habits, and medication usage, participants chose from the following range: no more than once a week, 1-2 times a week, 3-4 times a week, 5-6 times a week, and every day.For sleeping habits choices werethe following: no more than 4 hours, 5-6 hours, 7-8 hours, 8-9 hours, and 10hours or more.Medical expenditure was measured in HKD’s and the categorieswere the following: below HKD1,000; HKD1,000 to 4,999; HKD5,000 to 9,900; HKD10,000 to 19,900; and more than HKD 20,000 per year.

2.3. Statistics

Statistical analyses were carried out using the PASW 18.0 software (IBM, Chicago, USA). The numeric data were presented as means ± standard deviations and the categorical data were presented as crosstab frequencies. A hierarchical cluster method (between-groups linkage + interval Pearson correlation) was used to analyze the health related lifestyle factors. Each parameter’s square mean of correlation coefficient in its group was calculated as follows to further select the representative parameters. The largest R2in each group was selected as the representative parameter.
R2 = (∑ r2)/n-1
Univariate ANOVA (for the morphological data) and Chi-square tests associated with the Phi and Cramer’s V coefficients (for the lifestyle data) were used to compare city groups, age cohorts and genders.

3. Results

3.1. The Prevalence of Anthropometric and Lifestyle Factors

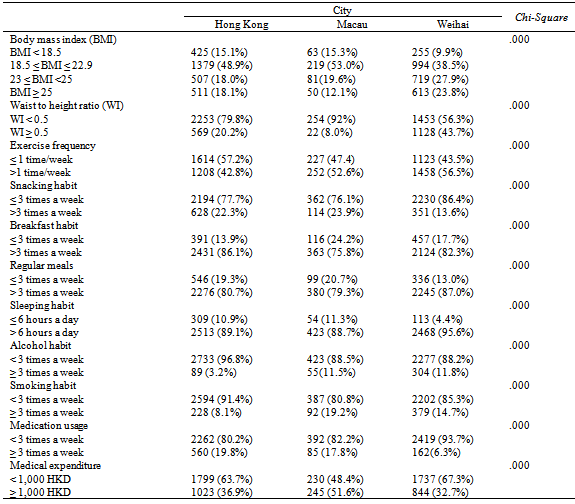
The prevalence of underweight was 15.1%, 15.3%, and 9.9% in Hong Kong, Macau, and Weihai, respectively. Overweight people made up 18.0%, 18.1%, and 19.2% of the Hong Kong, Macau and Weihai sample and the obesity rates were 12.1%, and 27.9% and 23.8%, respectively. The prevalence of WI ≥ 0.5 was 20.2%, 8.0%, and 43.7% in Hong Kong, Macau, and Weihai, respectively (Table 2).
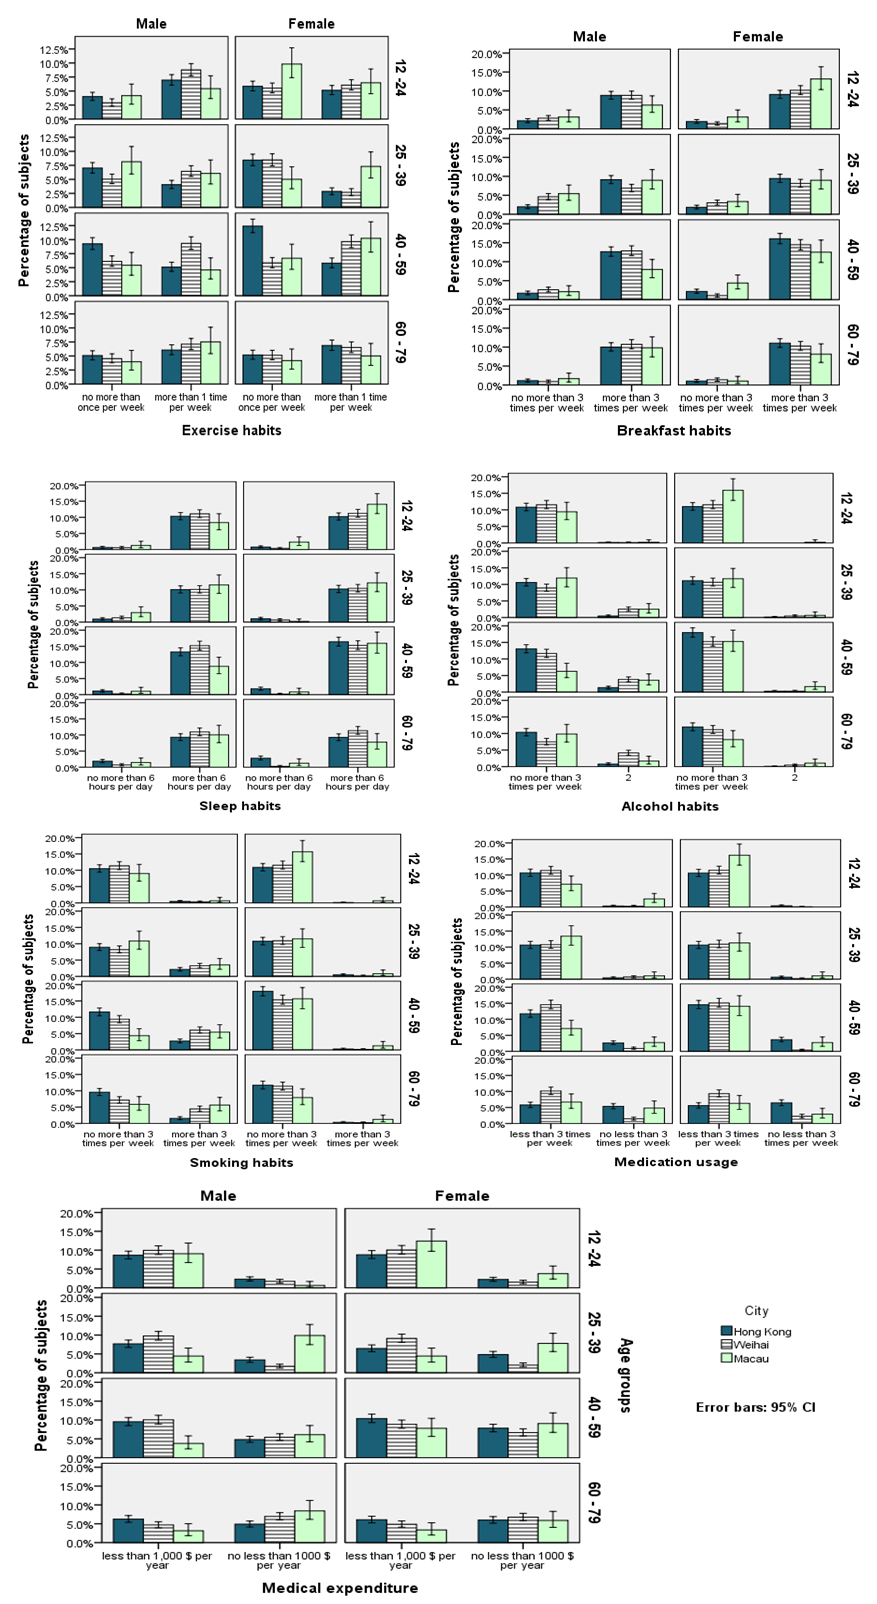
Figure 2. Prevalence of lifestyle factors: a) exercise habits, b) breakfast habits, c) sleep habits, d) alcohol habits, e) smoking habits, f) medication use and g) medical expenditure
Table 2. Description of variables in Hong Kong, Macau, and Weihai
     
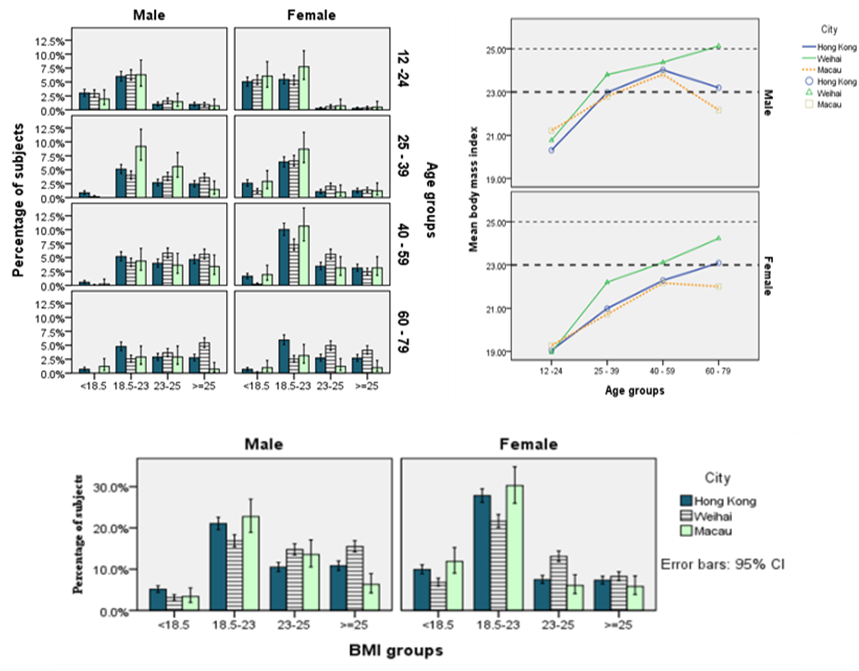
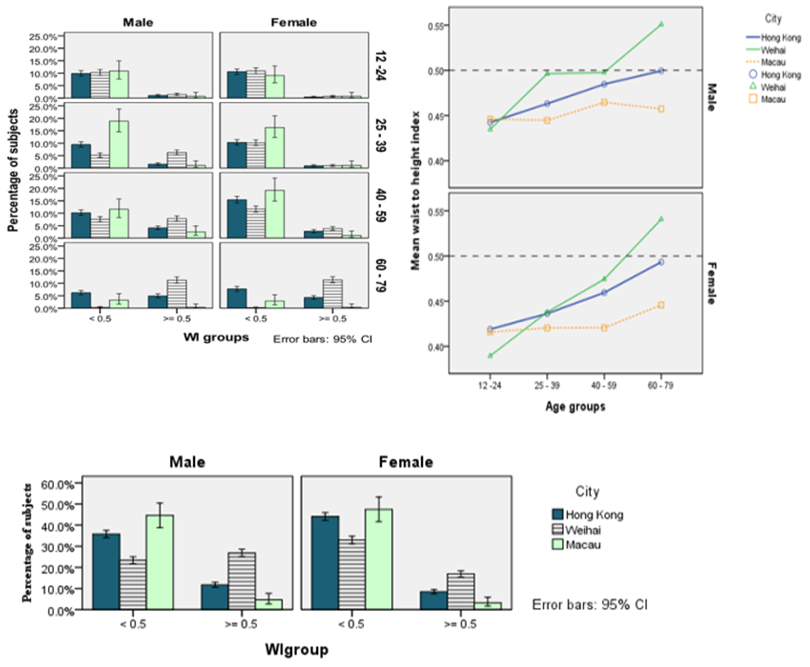
Figures 3 and 4 illustrate the prevalence of overweight and abdominal obesity by age and gender in the three cities. Figure 3 shows the distribution of BMI and Figure 4 shows the distribution of WI. Both BMI and WI increased with age in all three cities, and Weihai had the highest prevalence of overweight and obesity and the highest WI.
Figure 3. Distribution of a) BMI by age and gender b) the trends of BMI with age and c) BMI by gender. Among age groups, there was no difference between age group 40-50 and 60-79. Between other age groups there were significant differences, p< .05; there were significant differences between Hong Kong and Weihai, and Macau and Weihai, p < .001 and between genders, p< 0.001
Figure 4. Distribution of a) abdominal obesity (WI ≥ .05) by age and gender b) trends of in WI with age, and c) WI by gender. Differences among age groups, cities, and between genders were significant p<0.001

3.2. Cluster Analysis of Lifestyle-related Items

To understand the relationship among the lifestyle factors a hierarchical cluster analysis (between-groups linkage + interval Pearson correlation) was conducted and three clusters were determined:
1) snacks
2) hours of sleep, exercise habits, regular meals and breakfast habits
3) smoking habits, alcohol habits, medical expenditure, medication usage, WI and BMI
To simplify the comparison of the different lifestyle management strategies among the three cities, one representative item was selected from each of above three clusters: snacks, regular meals and WI (Table 4).
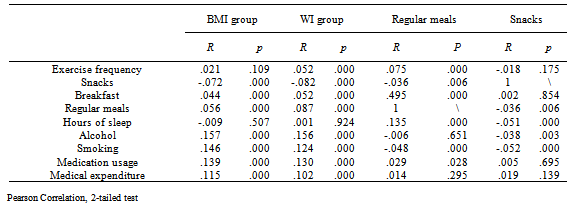
Table 3. Relationships of lifestyle factors with BMI and WI
     
Table 4. Representative items of lifestyle
     

3.3. A Comparison of Health Related Lifestyle Factorsin Hong Kong, Macau, and Weihai Residents

Snacking habit
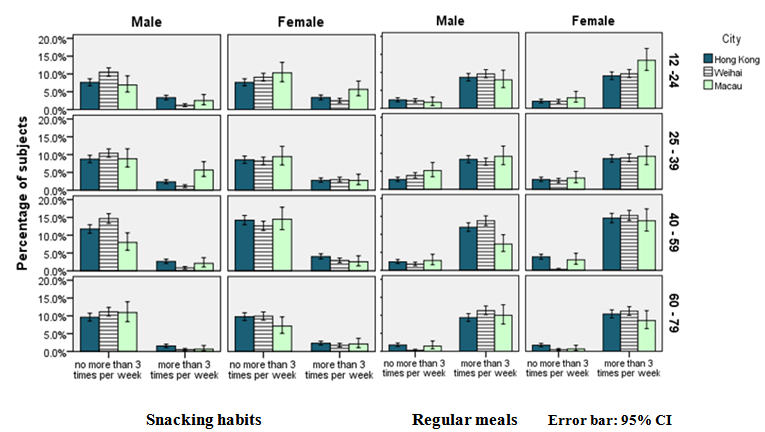
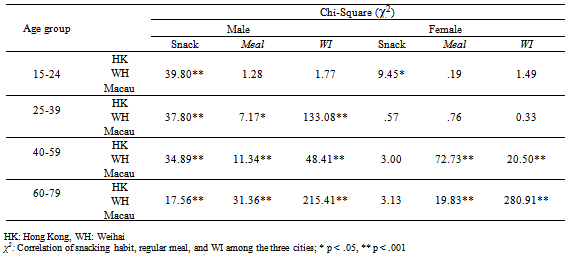
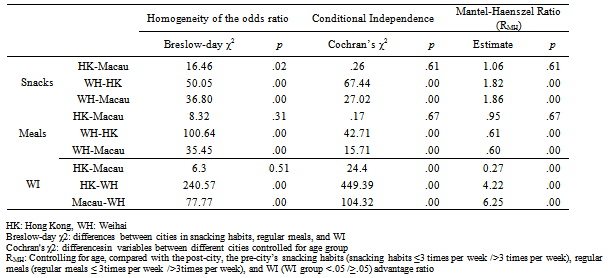
There were significant differences in the snacking habitsof men (p < 0.001) and in young women (15-24 years, p < 0.05) in the three cities (Table 5). Controlling for age, Weihai people were less likely to eat snacks than people in Hong Kong (RMH =1.82) or Macau (RMH =1.86), whereas the Hong Kong and Macauresidents had similar habits (Table 6).
Table 5. Prevalence of snacking habits, regular meals, and WI in different age groups in Hong Kong, Macau and Weihai
     
Regular meals
Among the three cities, there were significant differences in the frequency of regular meals among people aged 40 to 79 in both genders (p < 0.001) and in working men between 25-39 years (p <0.05) (Table 5). Controlling for age, Weihairesidents were less likely to skip meals than residents of Hong Kong (RMH =0.61) or Macau (RMH =0.60), whereas the Hong Kong and Macauresidents had similar habits (Table 6).
Waist to height ratio (WI)
There were significant differences in cardiovascular risk (WI) amongwomen aged 40 to 79 and men aged 25 to 79 (p < 0.001) (Table 5). Controlling for age, Weihairesidents were more likely to experience cardiovascular risk than residents of Hong Kong (RMH =4.22) or Macau (RMH =6.25) (p < 0.001) (Table 6).
Figure 5. Frequency of regular meals and snacking habits by city, age, and gender
Table 6. Comparison of snacking habits, regular meals, and WI between age cohorts and city
     

4. Discussion

Our study found that the prevalence of overweight and obesity were high in all three cities. Theprevalence of underweight, overweight and obesity were similar in Hong Kong and Macau, but there were fewer underweight people and more overweight and obesepeople in Weihai. In this city, overweight and obesity were high among men over 25 years and women over 40 years, andthe incidence increased with age.
It has been well documented that obesity is a major contributor to serious health conditions in children and adults, including type 2 diabetes, cardiovascular disease, many cancers, and numerous other diseases and conditions[23, 24, &25]. Overweight and obesity have also been associated with unhealthy lifestyles[26, 27, &28]. Obesity, physical inactivity and smoking are the major modifiable risk factors for diabetes mellitus[10]. Obesity and unhealthy lifestyles might account for more than 10% of the sick leave in the productive workforce and further productivity losses at work[29].
At the same time, studies have shown an increasing trend in the prevalence of underweight among children and adolescents[30] and young women[31] in Asian countries. Underweight in children has been associated with obstructive sleep[32], pre-pregnancy women’s placental abruption[33], the risk of preterm birth and low birth weight[34], and higher mortality[35&36]. Mondet al[37] have examined whether mental health problemssuch as eating disorders might contribute to the underweight problem among women. It is crucial to make patients aware of the problems and consequences of low weight, obesity and unhealthy lifestyles.
For the 5883 participants in this study, WI, the frequency of regular meals, and snacking habits were the mostsignificant lifestyle factors. WI has been found to be a good predictor of cardiovascular and cardiometabolic risk, and an accurate and easy index for evaluating obesity in children[38] and adults[39]. In the present study, the highest WI measurements were found in Weihei, followed by Hong Kong and Macau. However, people in Weihai were less likely to consume snacks or to skip regular meals.
Regular meal frequency has been shown to have beneficial effects on fasting lipid and postprandial insulin profiles and the thermogenesis of healthy obese women[40]. Increased meal frequency and daily breakfast consumption have been inversely associated with childhood obesity[41].Breakfast frequency and quality have also been related to appetite and blood sugar control, which may have important implications for the risk of obesity and type 2 diabetes[42]. A combination of higher meal frequency and daily breakfast may prevent overweight and obesity in children[43]. Howarth et al[44] reported that eating frequency was positively associated with energy intake, and eating more than three times a day was associated with being overweight or obese in both younger and older adults. In this study, regular meal consumption was associated with BMI (R = .039, p = .003) and WI (R = .068, p = .000) after controlling for other lifestyle factors.
Chapelot[45] found in a review of the role of snacking in energy balance that snacking contributed to overweight and obesity. Thus, snacking may play a role in weight control. De Graaf[46] cautioned that snack consumption might contribute to a positive energy balance. It has been reported that snacking did not impair weight loss during a one year obesity treatment[47]. Viskaal-van et al[48] conducted an 8-week snack consumption intervention in healthy normal weight adults, and the findings suggested that consuming snacks that are high or low in energy density did not necessarily contribute to weight gain. Kong et al[49] found in a dietary weight-loss intervention for overweight to obese postmenopausal women that those who reported two or more snacks per day had higher fiberintake compared to those with one or no snacks per day. Afternoon snackers had higher fruit and vegetable intake; however, snacking patterns might also reflect unhealthy eating habits and impede weight-loss progress.
Our study showed that people in Weihai (13.6%) consumed fewer snacks than people in Hong Kong (22.3%) and Macau (23.9%). Snacking frequency was negatively associated with BMI(R = -.061, p = .000) and WI (R = -.071, p = .000) even after controlling for other variables such as regular meals, hours of sleep, alcohol, and smoking. Snacking also negatively correlated with regular meals (R=-.027, p= .044) after controlling for other variables including hours of sleep, alcohol, smoking, BMI and WI. Thissuggests that snacking might interrupt eating habits and lead to an unhealthy weight.

5. Summary

There have been many studies aimed at developing strategies to prevent and reduce obesity and unhealthy lifestyles. Bulló et al[50] reported that a combination of healthy lifestyle behaviours was associated with a lower prevalence of general obesity and abdominal obesity in elderly people. Previous studies have shown that people who are trying to achieve or maintain a weight loss of more than 5% of their total weight should weigh themselves regularly, avoid skipping meals or keeping snack foods in the house, limit the frequency of takeaway food consumption, manage emotional eating, and strengthen dietary restraint[51]. Community based intervention has been shown to successfully improve health related lifestyle factors[52] and obesity[53]. Khan et al[11] found that healthy lifestyle behaviours, such as healthy diet, weight management, regular exercise, reduction in alcohol consumption and smoking cessation could reduce the risk of cancer.
This study has demonstrated that a large proportion of the populationin Hong Kong, Macau and Weihai, (57.2%, 47.4%, and 43.5% respectively), are sedentary (regular exercise ≤ 1 time/week). Most people are aware of the benefits of exercise and its impact on health and mortality[54&55], but this has not reduced the prevalence of sedentary lifestylesor obesity.
The present study has several limitations. First, the data were collected from self-reporting questionnaires, and some items such as circumference, weight, and medical expenditures were estimated. Data collection in Macau had a high rate of rejection (34.3%). Second, the socioeconomic factors and educational backgrounds of the sample population were not investigated[56]. There may be interactions between health conditions[57] and socioeconomic and educational status. Third, although the sample size was sufficiently large to cover the different age groups, marital and employment status were not included and these factors might influence lifestyle. Fourth, exercise frequency, smoking, drinking, and medication usage were not thoroughly investigated and they could be important factors in a healthy lifestyle. These limitations should be addressed in future studies.
Despite these limitations, our findings demonstrate that the prevalence of overweight and obesity is a serious problem among residents in the Hong Kong, Macau and Weihai. Weihai residents need to pay more attention to their weight. Hong Kong and Macau residents should eat more regular meals and reduce their consumption of snacks. On the other hand, significantly more Hong Kong and Macau residents did not sleep six hours a day than Weihai residents (10%, 11.3% vs. 4.4% respectively). Since a recent research report by WHO (2012)[58] suggested those who slept less than six hours a day would have higher chance (4 times) in suffering from stroke, it is a modifiable behaviour that we should pay special attention. It appears that although members of the general public are unanimous in making health and high quality of life a top priority, theydo not put theory into practice, and we have a long way to go before attitudes can be changed into behaviour.

ACKNOWLEDGEMENTS

We would like to acknowledge the assistance of Professor Sandy Li and Dr.An N (Hong KongBaptistUniversity) and colleagues from the University of Macau and Shangdong University (Weihai) who helped with data collection and analyses.

References

[1]  Khaw, K. T., Wareham, N., Bingham, S., Welch, A., Luben, R., & Day, N. (2008). Combined impact of health behaviors and mortality in men and women: the EPIC-Norfolk prospective population study. PLoS Medicine, 5(1), e12.
[2]  Sanderson, S. C., Waller, J., Jarvis, M. J., Humphries, S. E., & Wardle, J. (2009). Awareness of lifestyle risk factors for cancer and heart disease among adults in the UK (abstract). Patient Education and Counseling, 74(2), 221-227.
[3]  Kvaavik, E., Batty, G. D., Ursin, G., Huxley, R., & Gale, C. R. (2010). Influence of individual and combined health behaviors on total and cause-specific mortality in men and women: the United Kingdom health and lifestyle survey. Archives of Internal Medicine, 170(8), 711-718.
[4]  Kumar, S. (2011). Occupational, environmental and lifestyle factors associated with spontaneous abortion. Reproductive Sciences, 18(10), 915-930.
[5]  Gami, A. S., Witt, B.J., Howard, D. E., Erwin, P. J., Gami, L. A., Somers, V. K., &Montori, V. M. (2007). Metabolic syndrome and risk incident cardiovascular events and death: a systematic review and meta-analysis of longitudinal studies. Journal of the American College of Cardiology, 49(4), 403-414.
[6]  Dalle Grave, R., Calugi, S, Centis, E., Marzocchi, R., Ghoch, M. E., &Marchesini, G. (2010). Lifestyle modification in the management of the metabolic syndrome: achievements and challenges. Diabetes, Metabolic Syndromes and Obesity, 3, 375-385.
[7]  Elmer, P. J., Obarzanek, E., Vollmer, W. M., Simons-Morton, D., Stevens V. J., Young, D. R., Lin, P. H., Champagne, C., Harsha, D. W., Svetkey, L. P., Ard, J., Brantley, P. J., Proschan, M. A., Erlinger, T. P., Appel, L. J., & PREMIER Collaborative Research Group (2006). Effects of comprehensive lifestyle modification on diet, weight, physical fitness, and blood pressure control: 18-month results of a randomized trial. Annals of Internal Medicine, 144(7), 485-495.
[8]  Jafar, T. H., Islam, M., Hatcher, J., Hashmi, S., Bux, R., Khan, A., Poulter, N., Badruddin, S., Chaturvedi, N., &Hypertension Research Group (2010). Community based lifestyle intervention for blood pressure reduction in children and young adults in development country: cluster randomized controlled trial. British Medical Journal, 340, c2641.
[9]  Zhang, W. & Li, N. (2011). Prevalence, risk factors, and management of prehypertension. International Journal of Hypertension, 2011, 605359.
[10]  Maruthur, N. M., Wang, N. Y., &Appel, L. J. (2009). Lifestyle interventions reduce coronary heart disease risk: results from the PREMIER Trial. Circulation, 119(15), 2026-2031.
[11]  Khan, N., Afaq, F., &Mukhtar, H. (2010). Lifestyle as risk factors for cancer: evidence from human studies. Cancer Letters, 293(2), 133-143.
[12]  Esposito, K., Ciltola, M., Maiorino, M. I., &Giugliano, D. (2008). Lifestyle approach for type 2 diabetes and metabolic syndrome. Current Atherosclerosis Reports, 10(6), 523-528.
[13]  Hu, G., Lakka, T. A., Lakka, H. M., &Tuomilehto, J. (2006). Lifestyle management in the metabolic syndrome. Metabolic Syndrome and Related Disorders, 4(4), 270-286.
[14]  Dyson, P. A. (2010). The therapeutics of lifestyle management on obesity. Diabetes, Obesity & Metabolism, 12(11), 941-946.
[15]  Burke, L. E., & Wang, J. (2011). Treatment strategies for overweight and obesity. Journal of Nursing Scholarship, 43(4), 368-375.
[16]  Wadden, T. A., Butryn, M. L., & Wilson, C. (2007). Lifestyle modification for the management of obesity. Gastroenterology, 132(6), 2226-2238.
[17]  Myint, P. K., Smith, R. D., Luben, R. N., Surtees, P. G., Wainwright, N. W., Wareham, N. J., &Khaw, K. T. (2011). Lifestyle behaviors and quality-adjusted life years in middle and older age. Age Ageing, 40(5), 589-595.
[18]  World Health Organization (WHO) Expert Consultation (2004). Appropriate body-mass index for Asian populations and its implication for policy and intervention strategies. Lancet, 363, 157-163.
[19]  Schneider, H. J., Friedrich, N., Klotsche, J., Pieper, L., Nauck, M., John, U., Dörr, M., Felix, S., Lehnert, H., Pittrow, D., Silber, S., Völzke, H., Stalla, G. K., Wallaschofski, H., &Wittchen, H. U. (2010). The predictive value of different measures of obesity for incident cardiovascular events and mortality. The Journal of Clinical Endocrinology and Metabolism, 95(4), 1777-1785.
[20]  Ashwell, M., Gunn, P., & Gibson, S. (2012). Waist-to-height ratio is a better screening tool than waist circumference and BMI for adult cardiometrabolic risk factors: systematical review and meta-analysis. Obesity Review, 13(3), 275-286.
[21]  Browning, L. M., Hsieh, S. D., &Ashwell, M. (2010). A systematic review of waist-to-height ratio as a screening tool for the prediction of cardiovascular disease and diabetes: 0.5 could be a suitable global boundary value. Nutrition Research Reviews, 23(2), 247-269.
[22]  Dong, X., Liu, Y., Yang, J., Sun, Y., & Chen, L. (2011). Efficiency of anthropometric indicators of obesity for identifying cardiovascular risk factors in a Chinese population. Postgraduate Medical Journal, 87(1026), 251-256.
[23]  Wisse, B. E., Kim, F., & Schwartz, M. W. (2007). An integrative view of obesity. Science, 318(5852), 928-929.
[24]  Heber, D. (2010). An integrative view of obesity. The American Journal of Clinical Nutrition, 91(1), 280S-283S.
[25]  Karlsson, E. A. & Beck, M. A. (2010). The burden of obesity on infectious disease. Experimental Biology and Medicine, 235(12), 1412-1424.
[26]  Balluz, L. S., Okoro, C. A., &Mokdad, A. (2008). Association between selected unhealthy lifestyle factors, body mass index, and chronic health conditions among individuals 50 years of age or older, by race/ethnicity. Ethnicity & Disease, 18(4), 450-457.
[27]  Kushner, R. F. & Choi. S.W. (2010). Prevalence of unhealthy lifestyle patterns among overweight and obese adults. Obesity (Sliver Spring), 18(6):1160-7.
[28]  Temelkova-Kurktschiev, T. &Stefanov, T. (2012). Lifestyle and genetics in obesity and type 2 diabetes. Experimental and Clinical Endocrinology & Diabetes, 120(1), 1-6.
[29]  Robroek, S. J., van den Berg, T. I., Plat, J. F., &Burdorf, A. (2011). The role of obesity and lifestyle behaviors in a productive workforce. Occupational and Environmental Medicine, 68(2), 134-139.
[30]  Mak, K. K., & Tan, S. H. (2012). Underweight problems in Asian children and adolescents. European Journal of Pediatrics, 171(5), 779-785.
[31]  Nishida, T., &Sakakibara, H. (2010). Association between underweight and low lymphocyte count as an indicator of malnutrition in Japanese women. Journal of Women’s Health (Larchmt), 9(7), 1377-1383.
[32]  Kang, K. T., Lee, P. L., Weng, W. C., & Hsu, W. C. (2012). Body weight status and obstructive sleep apnea in children. International Journal of Obesity advance online publication 24 January 2012.
[33]  Deutsch, A. B., Lynch, O., Alio, A. P., Salihu, H. M., &Spellacy, W. N. (2010). Increased risk of placental abruption in underweight women. American Journal of Perinatology, 27(3), 235-240.
[34]  Han, Z., Mulla, S. Beyene, J., Liao, G., McDonald, S. D., & Knowledge Synthesis Group (2011). Maternal underweight and the risk of preterm birth and low borth weight: a systematic review and meta-analyses. International Journal of Epidemiology, 40(1), 65-101.
[35]  Thorogood, M., Appleby, P., Key, T., & Mann, J. (2003). Relation between body mass index and mortality in an unusually slim cohort. Journal of Epidemiology and Community Health, 57(2), 130–133.
[36]  Romero-Corral, A., Montori, V. M., Somers, V. K., Korinek, J., Thomas, R. J., Allison, T. G., Mookadam, F., & Lopez-Jimenez, F. (2006). Association of bodyweight with total mortality and with cardiovascular events in coronary artery disease: a systematic review of cohort studies. Lancet, 368(9536), 666-678.
[37]  Mond, J., Rodgers, B., Hay, P., & Owen, C. (2011). Mental health impairment in underweight women: do body dissatisfaction and eating-disordered behavior play a role? BMC Public Health,11, 547.
[38]  Weili, Y., He, B., Yao, H., Dai, J., Cui, J., Ge, D., Zheng, Y., Li, L., Guo, Y., Xiao, K., Fu, X., & Ma, D. (2007). Waist-to-height ratio is an accurate and easier index for evaluating obesity in children and adolescents. Obesity (Silver Spring), 15(3), 748-752.
[39]  Schneider, H. J., Klotsche, J., Silber, S., Stalla, G. K., &Wittchen, H. U. (2011). Measuring abdominal obesity: effects of height on distribution of cardiometabolic risk factors risk using waist circumference and waist-to-height ratio. Diabetes Care 34(1), e7.
[40]  Farshchi, H. R., Taylor, M. A., & Macdonald, I. A. (2005). Beneficial metabolic effects of regular meal frequency on dietary thermogenesis, insulin sensitivity, and fasting lipid profiles in healthy obese women. The American Journal of Clinical Nutrition, 81(1), 16-24.
[41]  Toschke, A. M., Thorsteinsdottir, K. H., von Kries, R., & GME Study Group (2009). Meal frequency, breakfast consumption and childhood obesity. International Journal of Pediatric Obesity, 4(4), 242-248.
[42]  Pereira, M. A., Erickson, E., McKee, P., Schrankler, K., Raatz, S. K., Lytle, L. A., &Pellegrini, A. D. (2011). Breakfast frequency and quality may affect glycemia and appetite in adults and children. Journal of Nutrition, 141(1), 163-168.
[43]  Antonogeorgos, G., Panagiotakos, D. B., Papadimitrious, A., Priftis, K. N., Anthracopoulos, M., &Nicolaidou, P. (2012). Breakfast consumption and meal frequency interaction with childhood obesity. Pediatric Obesity, 7(1), 65-72.
[44]  Howarth, N. C., Huang, T. T., Roberts, S. B., Lin, B. H., &McCrory, M. A. (2007). Eating pattern and dietary composition in relation to BMI in younger and older adults. International Journal of Obesity, 31, 675-684.
[45]  Chapelot, D. (2011). The role of snacking in energy balance: a biobehavioral approach. Journal of Nutrition, 141(1), 158-162.
[46]  De Graaf, C. (2006). Effects of snacks on energy intake: An evolutionary perspective. Appetite, 47(1), 18-23.
[47]  BertéusForslund H., Klingström S., Hagberg H., Löndahl M., Torgerson J. S., &Lindroos A. K. (2008). Should snacks be recommended in obesity treatment? A 1-year randomized clinical trial. Eur J ClinNutr. 62(11):1308-17.
[48]  Viskaal-van Dongen, M., Kok, F. J., & de Graaf, C. (2010). Effects of snack consumption for 8 weeks on energy intake and body weight. International Journal of Obesity, 34(2), 319-326.
[49]  Kong, A., Beresford, S. A., Alfano, C. M., Foster-Schubert, K. E., Neuhourser, M. L., Johnson, D. B., Duggan, C., Wang, C. Y., Xiao, L., Bain, C. E., &McTiernan, A. (2011). Associations between snacking and weight loss and nutrient intake among postmenopausal overweight to obese women in a dietary weight-loss intervention. Journal of the American Dietetic Association, 111(12), 1898-1903.
[50]  Bulló, M., Garcia-Aloy, M., Martínez-González, M. A., Corella, D., Fernández-Ballart, J. D., Fiol, M., Gómez-Gracia, E., Estruch, R., Ortega-Calvo, M., Francisco, S., Flores-Mateo, G., Serra-Majem, L., Pintó, X., Covas, M. I., Ros, E., Lamuela-Raventós, R., & Salas-Salvadó, J. (2011). Association between a healthy lifestyle and general obesity and abdominal obesity in an elderly population at high cardiovascular risk. Preventive Medicine, 53(3), 155-161.
[51]  Neve, M. J., Morgan, P. J., & Collins, C. E. (2011). Behavioural factors related with successful weight loss 15 months post-enrolment in a commercial web-based weight loss programme. Public Health Nutrition, Nov 29, 1-11.[Epub ahead of print].
[52]  Wendel-Vos G. C., Dutman A. E., Verschuren W. M., Ronckers E. T., Ament A., van Assema P. et al (2009). Lifestyle factors of a five-year community-intervention program: the Hartslag Limburg intervention. Am J Prev Med. 37(1):50-6.
[53]  Haby, M. M., Doherty, R., Welch, N., & Mason, V. (2012). Community-based interventions for obesity prevention: lessons learned by Australian policy-maker. BMC Research Notes, 5, 20.
[54]  Stensvold D., Nauman J., Nilsen T. I., Wisløff U., Slørdahl S. A., &Vatten L. (2011). Even low level of physical activity is associated with reduced mortality among people with metabolic syndrome, a population based study (the HUNT 2 study, Norway). BMC Med. 9:109.
[55]  Wen, C. P., Wai, J. P., Tsai, M. K., Yang, Y. C., Cheng, T. Y., Lee, M. C., Chan H. T., Tsao, C. K., Tsai, S. P., &Wu, X. (2011). Minimum amount of physical activity for reduced mortality and extended life expectancy: a prospective cohort study. Lancet, 378(9798), 1244-1253.
[56]  Nédó, E., &Paulik, E. (2012). Association of smoking, physical activity, and dietary habits with socioeconomic variables: a cross-sectional study in adults on both sides of the Hungarian-Romanian border. BMC Public Health, 12, 60.
[57]  Vathesatogkit, P., Woodward, M., Tanomsup, S., Hengprasith, B., Aekplakorn, W., Yamwong, S., &Sritara, P. (2012). Long-term effects of socioeconomic status on incident hypertension and progression of blood pressure. Journal of Hypertension, 2012 May 8.[Epub ahead of print].
[58]  World Health Organization (2012) World Health Statistics 2012. Switzerland: WHO.