-
Paper Information
- Previous Paper
- Paper Submission
-
Journal Information
- About This Journal
- Editorial Board
- Current Issue
- Archive
- Author Guidelines
- Contact Us
International Journal of Sports Science
p-ISSN: 2169-8759 e-ISSN: 2169-8791
2013; 3(1): 28-35
doi:10.5923/j.sports.20130301.06
Relationship Between BMI and Endurance-Strength Abilities Assessed by the 3 Minute Burpee Test
 Abstract
 Reference
 Full-Text PDF
 Full-text HTML
Robert Podstawski1, Kasietczuk Bernard2, Boraczyński Tomasz3, Boraczyński Michał3, Choszcz Dariusz4
1Department of Physical Education and Sport, University of Warmia & Mazury in Olsztyn, Poland
2Department of Applied Mathematics, University of Warmia & Mazury in Olsztyn, Poland
3Department of Physical Education, Jozef Rusiecki’Olsztyn University, Poland
4Faculty of Technical Sciences, University of Warmia & Mazury in Olsztyn, Poland
Correspondence to: Robert Podstawski, Department of Physical Education and Sport, University of Warmia & Mazury in Olsztyn, Poland.
| Email: |  |
Copyright © 2012 Scientific & Academic Publishing. All Rights Reserved.
Maintaining proper body mass has become a serious social problem. A review of literature concerning the relationships between body mass and health-related fitness revealed significantly fewer studies conducted on physically inactive people. The aim of the study was to determine the relationships between BMI values and the level of endurance-strength abilities in 19-23 year-old women. The research was conducted in 2012 on 204 first-year female students attending the University of Warmia & Mazury in Olsztyn, Poland. Basic anthropometric parameters (body mass and height) were measured and the level of endurance-strength abilities was assessed using the 3-minute Burpee test. The conducted research indicated that overweight and obesity negatively influence the level of endurance-strength abilities assessed by the 3-minute Burpee test. Statistical calculations revealed that when the value of BMI increases by 1%, the number of repetitions performed during the 3-minute Burpee test decreases by 0.93%. They also indicated the usefulness of the 3-minute Burpee test in determining the influence of BMI on young women’s endurance-strength abilities.
Keywords: BMI, Endurance-strength Abilities, Female Students, Health-related Fitness
Cite this paper: Robert Podstawski, Kasietczuk Bernard, Boraczyński Tomasz, Boraczyński Michał, Choszcz Dariusz, Relationship Between BMI and Endurance-Strength Abilities Assessed by the 3 Minute Burpee Test, International Journal of Sports Science, Vol. 3 No. 1, 2013, pp. 28-35. doi: 10.5923/j.sports.20130301.06.
Article Outline
1. Introduction
- Maintaining proper body mass has become a serious social problem. Deviations from the norm usually pertain to excessive body mass referred to as overweight or obesity. Underweight is relatively uncommon in developed societies and so will not be described in greater detail.Current data, from nearly all regions of the industrialized world, reveals a continuously increasing percentage of children and youth who are overweight or obese. This phenomenon has reached the proportions of an epidemic in the United States[1]. According to figures provided by the National Health and Nutrition Examination Surveys (NHANES) in 2003-2004, 57.1% of adults aged 20-39 and 66.3% of all US residents were overweight or obese[2]. This dangerous tendency has also been observed in many other developed countries, such as: Australia[3], Finland[4], France[5], Great Britain[6], Germany[7], and Japan[8]. A similar situation has been noted in Poland, where currently approx. 6.5 million (16.9%) citizens have a BMI of over 30 and it is estimated that 280-300 (4.6%) thousand of them are severely obese (BMI over 40). According to researchers from Warsaw Medical University, if this tendency isn’t stopped or reversed within the next 15 years, the percentage of those affected by obesity will increase to as much as 33%[9].The increase of overweight and obesity is connected with the general decrease in energy expenditure in the form of daily physical activity[10], as well as an absolute or relative increase in consumption[11]. Consequently, a positive energy balance leads to the inevitable increase of fat mass. The chronic lack of movement (hypokinesia) along with excess body weight has even resulted in the occurrence of new civilization illnesses, e.g., valvular heart diseases, heart arrhythmia, high blood pressure, hypercholesterolemia, diabetes, lung disease, bone and joint inflammation, some forms of cancer, spinal deformities, flat feet, and depression [12-18]. A high content of fatty tissue also causes negative consequences in terms of human motoricity. A high-fat diet in addition to the increase in fatty tissue content not only leads to a noticeable decrease in cardio-respiratory efficiency and physical capacity which impairs high intensity training, but may also have adverse long-term health consequences [19-22]. This is mainly the result of metabolic disorders, especially the increasing demand for VO2 (net) connected with the increase in body weight[23], a decrease in insulin sensitivity, and elevated blood pressure[24]. As a result of the above, the influence of excess weight is clearly noticeable in endurance efforts (e.g., long distance running or cycling), which are based on cardiorespiratory fitness[25-33]. A slightly different picture can be observed in research aimed at assessing the influence of overweight and obesity on the level of strength abilities. Such studies showed that muscle mass and composition are some of the main somatic predispositions influencing the level of strength abilities[29, 34]. People characterized by higher body mass (including body fat mass) performed better in tests measuring static muscular strength[28, 35]. A review of literature concerning the relationships between body mass and endurance-strength abilities revealed numerous publications which however, analyzed mostly athletes, whose body mass consists mainly of lean tissue[36-39]. Significantly fewer of these studies were conducted on the physically inactive. These people, as opposed to athletes, constitute the vast majority of the human population and studies involving them provide us with valuable data which can be used for health purposes. This is especially important when taking into account the continuously increasing amount of overweight and obese people. Finding the influence of body composition on health-related fitness (H-R F) will facilitate prevention of this negative tendency.Endurance-strength abilities are a main component of health related fitness. Although there are many tests for measuring these abilities, few have proven to be as accurate and in practical to apply in a field experiment as the Burpee test. The Burpee test is very popular physical exercise which, in consequence, has resulted in many of its variations. According to the Oxford Dictionary, the term “Burpee test” originated in the 1930s and was named after the American psychologist Roual H. Burpee [40]. The test was originally designed to measure agility and coordination, and consists of a series of so-called burpies – physical exercises consisting of a squat thrust from and ending in a standing position. As previously mentioned, there are many variations of the test such as different periods of time for which it is performed, either straight or bent arms during the squat phase, the presence or absence of a jump, etc.The aim of the study was to determine the relationships between BMI values and the level of endurance-strength abilities in 19-23 year-old women. The following research hypothesis was subjected to verification: the number of cycles (No C) performed during the 3-minute Burpee test depends on the BMI value.
2. Material and Methods
2.1. Ethics Committee
- The research was carried out in compliance with prior approval of the University of Warmia & Mazury Ethical Committee and written informed consent was obtained from each participant.
2.2. Participants and Procedures
- The research was conducted in 2012, on 204 first-year female students attending the University of Warmia & Mazury in Olsztyn (UWM). Each of the 19-20 year-old volunteers who willingly agreed to participate in the study performed the 3 minute Burpee test during obligatory P.E. lessons held at the university. In order to select the proper trial for these types of studies, the Podstawski et al.[41] algorithm was applied:1) A population of 19-20 year-old female students constitutes an age group whose anatomical and physiological development, including that of the central and peripheral nervous systems, is complete and is, therefore, characterized by a relative equilibrium of excitation and inhibition processes. 2) All tested women were residents of villages, towns, or small cities (pop. < 40,000) in the Warmia & Mazury Region of Poland. 3) The engagement of study subjects in sports and other forms of exercise could significantly distort the general picture of the obtained results as such groups of people are characterized by the highest level of biological development among academic youth[29]. Therefore, those female students who took part in the research attended only the mandatory physical education classes (90 minutes per week) and did not participate in any other physical activities. 4) It was also tested whether the amount of participants included in the research was sufficient to be considered representative. The following formula was applied to determine if the trial is representative (1):
 | (1) |
 , it was presumed that the error of estimating the average does not exceed 5%[42]. The necessary amount of students calculated from formula (1), at the accepted 5% level of error in estimating the average, totalled 138 students and was lower than the number of people who took part in our experiment (204). Consequently, the trial can be considered homogenous and representative for this age group of Warmia & Mazury University students. Basic anthropometric parameters (body mass and height) were measured with the appropriate tools and the level of endurance-strength abilities was assessed using the 3-minute Burpee test. The test technique (fig. 1) was performed according to Denisiuk’s guidelines[43]. BMI (Body Mass Index = body mass [kg]/body height [m]2) was calculated in order to determine the nutritional state of the participants. This index is widely accepted as an accurate and valid indicator for assessing to what degree an individual’s body mass differs from the normal or desirable mass of a mature person his or her height[44-46]. Deviations from BMI norms were assessed in accordance with the basic WHO classification[47], which divided the study subjects into the following categories:
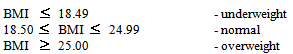 In a more detailed classification, women with a BMI
  18.49 included women who were underweight to the first and second degree. The group of overweight individuals consisted of women who were overweight as well as those falling into the first and second classes of obesity (25.0
 BMI
BMI 29.99, 30.0
 BMI
BMI 34.99, and 35.0
 BMI
BMI 39.99, respectively). The influence of three basic BMI categories, i.e. underweight, normal, and overweight, on the number of cycles performed in the 3-minute Burpee test was determined. BMI constituted the independent variable (x) and the number of cycles (No C) served as the dependent variable (z). The number of repetitions performed over the course of 3 minutes expressed the level of endurance-strength abilities. This is in accordance with strength training methodology, in which the maximum number of repetitions (cycles) performed with a load of 75% 1-RM in a given amount of time is an indicator of strength endurance[48]. Figure 1 presents the individual phases of the 3-minute Burpee test.Phase I: From the initial upright standing position (fig 1a) the participant assumes a supported squatting position with both hands on the ground (fig. 1b).Phase II: From the supported squat (fig. 1b) the feet are thrust backwards (fig. 1c) into the push-up position with straightened arms (fig. 1d).Phase III: From this position (fig. 1d) the participant once again returns to the supported squat (fig. e).Phase IV: The cycle is completed by the participant returning to the upright standing position (fig. 1i) and simultaneously clapping his or her hands over the head, making sure that the arms remain extended (fig. 1f-1g-1h). The cycle is performed as many times as possible in the given time limit (3 minutes).
 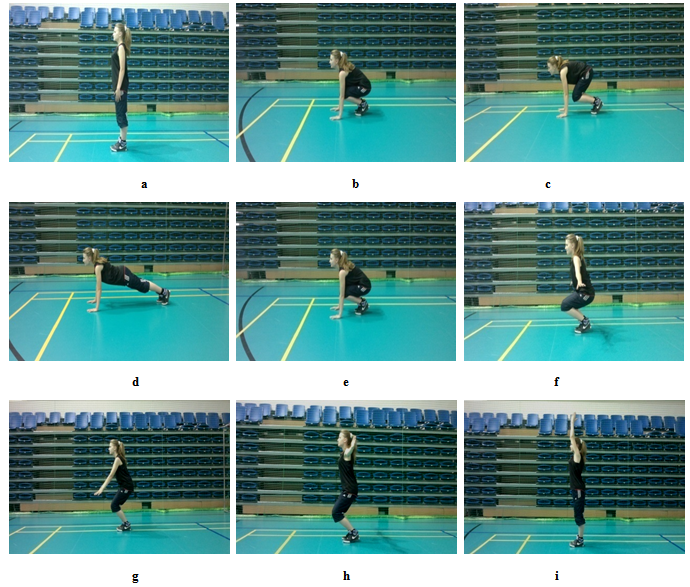 | Figure 1. Individual phases of the 3 minute Burpee test |
2.3. Comments
- Attention should be paid to ensure that the exercise is performed properly, that is the specific positions are assumed in the proper order. When assuming the push-up position the participants shouldn’t bend their arms or arch their backs, although an exception can be made for those not possessing adequate upper body strength. The legs must be fully extended every time that the participant is in the push-up position. Not performing any one of the individual phases correctly results in the given cycle not being counted. The above described individual phases of the 3-minute Burpee test (Fig. 1) and their proper execution were demonstrated before asking the students to perform the exercise. Each participant practiced the proper technique of the 3-minute Burpee test during P.E. lessons preceding the experiment. The women performed the trial twice in, with the second trial performed two weeks after the first, with the better of the two results recorded. The two-week break was applied to eliminate the effect of “learning” or “tiredness”, which can significantly affect (positively or negatively) the obtained results[49].
2.4. Statistical Analysis
- The Cobb-Douglas function was used to assess the analyzed relationship between BMI and No C:
 An advantage of this function is the ease of interpreting the
  coefficient. The flexibility of the z=f(x) function at point
  is defined by the following formula:
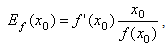 Where
Where  indicates the value of the f(x) function derivative at point
  , which we can interpret as follows:If
  increases by 1% the value of the function will change by
  %.For the Cobb-Douglas function, flexibility is expressed as
 .The gathered empirical data was subjected to statistical analysis using a STATISTICA 7.1 software package (StatSoft Inc. USA). Statistical calculations were performed at a significance level of α = 0.05. The results were checked for the presence of gross errors before verifying the assumed hypothesis[42].
3. Results
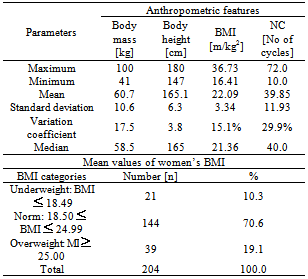
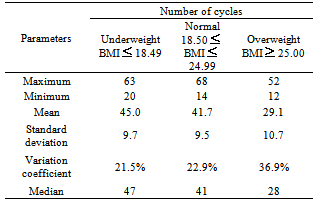
- Table 1 presents the basic statistics of the measured anthropometric parameters, i.e., body mass and height, calculated BMI values, and the number of cycles completed. The number and percentage of women in each of the BMI categories are also presented in the second part of the table. Based on the data presented in table 1, we can conclude that the analyzed women varied significantly in terms of body mass (differences of up to 59.0 kg), body height (differences of up to 33.0 cm) and No C (differences of up to 62 cycles/3 min.). The average BMI of all study subjects fell into the normal range (22.09 m/kg2), while minimum (16.41 m/kg2) and maximum (36.73 m/kg2) BMI values suggest that the study group was very diverse (difference of 20.32 m/kg2). The higher end of BMI values places the subjects in the second class of obesity, whereas lower values of this parameter indicate severe underweight. The vast majority of students (70.6%) fell into the normal range, whereas those characterized by underweight and overweight compromised 10.3% and 19.1% respectively (tab. 1).
|
 Statistical analyses revealed all parameters of the model to be statistically significant. These calculations inform us that when the value of BMI increases by 1%, the number of repetitions (cycles) decreases by 0.93%. The above is illustrated by figure 2.
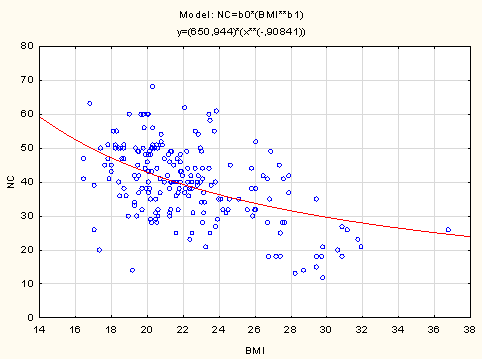 | Figure 2. Number of cycles in relation to BMI |
|
4. Discussion
- The conducted research revealed that overweight female students were characterized by a significantly lower level of endurance-strength abilities than their underweight or normal peers. Similar relationships were reported in studies conducted on 7-9 years-old girls using the 3-minute Burpee test[50], as well as studies regarding the influence of the same anthropometric parameters on the level of endurance-strength abilities expressed by the results of rowing 1000 m on an ergometer[41].The research of many authors indicated that body mass is the most significant anthropometric parameter negatively influencing results obtained in endurance[23, 27, 48, 51-53], and relative strength tests[41, 54-56]. In a group of individuals characterized by similar levels of conditioning, an increase in body mass results in an increase of absolute strength, but a decrease in relative strength[19, 57]. Therefore, when overcoming resistance connected with one’s body mass, people possessing higher values of this parameter, and thus those in the higher BMI range (a derivative of the body mass and height), can be expected to perform worse in relative endurance-strength trials, such as the 3-minute Burpee test. An example of a typical discipline in which BMI is of utmost importance is gymnastics[58].Scientists have agreed that the maximum intensity of aerobic processes can occur after no fewer than 3-5 minutes, and the majority of them believe that, in the case of typical endurance tests, effort should be continued for at least 4-5 minutes, at an intensity of 60-80% maximum oxygen intake VO2max.[51, 57, 59]. That is why the 3-minute variant of the Burpee test should not be considered solely as a measure of endurance, but rather of endurance-strength abilities. Moreover, this variant more accurately assesses the level of endurance-strength abilities than its 30 s[60], and 60 s[61], variants used in other studies.Trained individuals have a lower concentration of fat, which results in more blood and oxygen delivered to the muscles owing to a higher cardiac output and increased arterio-venous oxygen difference, which in turn results in a higher oxygen intake (VO2max)[62-64]. The same can be expected to have held true for our study subjects in the lower BMI range who achieved significantly better results in the 3-minute Burpee test.The 3-minute Burpee test used in our studies was also applied in research conducted on kindergarteners[65], and early school-age children[50, 61]. These studies confirmed that the test is cheap and easy to conduct even under very basic conditions. This makes it possible to apply it in mass studies concerning health-related fitness. Our research confirmed the usefulness of the test in assessing the relationships between the nutritional status and endurance-strength abilities of young adults.
5. Conclusions
- 1. Our research confirmed that overweight and obesity, expressed by the body mass index (BMI), negatively influence the level of endurance-strength abilities assessed by the 3 minute Burpee test. 2. The studies ought to be continued and their scope extended to include additional anthropometric and physiological parameters in order to draw up classification norms which account for gender, age, proportions of somatic traits and nutritional status.Conflict of Interest: Nothing to declare