-
Paper Information
- Previous Paper
- Paper Submission
-
Journal Information
- About This Journal
- Editorial Board
- Current Issue
- Archive
- Author Guidelines
- Contact Us
International Journal of Sports Science
2012; 2(3): 24-31
doi: 10.5923/j.sports.20120203.02
Tour, Giro, Vuelta: Rapid Progress in Cycling Performance Starts in the 1980s
 Abstract
 Reference
 Full-Text PDF
 Full-Text HTML
Hein F. M. Lodewijkx , Bram Brouwer
Department of Psychology, Open University, Heerlen, The Netherlands
Correspondence to: Hein F. M. Lodewijkx , Department of Psychology, Open University, Heerlen, The Netherlands.
| Email: |  |
Copyright © 2012 Scientific & Academic Publishing. All Rights Reserved.
After analyzing historic records (1892-2008), El Helou et al.[1] reported a distinctive 6.38% improvement in speed in European professional road racing from 1993 onwards, a period which coincides with the years of the ‘epo epidemic’ in professional cycling. We aim to show that this improvement might be spurious, since El Helou et al. did not account for the influence of confounding variables on riders’ speed progression over time. We scrutinized archival data provided by the French Association Mémoire du Cyclisme[12] and assessed winning riders’ kilometers per hour (kph) and time performances, demonstrated in the Tour, Giro and Vuelta from 1903 to 2011( N = 256). We next classified these measures in ten time periods, accounting for El Helou et al.’s ‘critical’ year 1993. We further assessed the distances and brutality rates of the races, as well as the number of stages in the races and included these variables as covariates in the study, because we expected them to influence riders’ achievements. Analyses of covariance (ANCOVA) showed that the variables included in the model explained R2adj. = .89–.98 of the variation in riders’ performances. The three covariates indeed influenced riders’ performances to a greater or a lesser extent over the years. Time performances appeared to be more valid to appraise riders’ speed progression than kph performances, because the former variable is not biased by the distances of the races. After adjusting for the influence of the covariates, multiple comparisons between time periods indicated that time performances in El Helou et al.’s critical years did not significantly differ from performances displayed by riders in immediate foregoing or succeeding years. Furthermore, the 1970s appeared to be key in riders’ evolution in performance over time. We next calculated the proportional progress (%) in time performances per period as ANCOVA follow–up. Across races, we obtained an improvement of 3.18% in time performance beyond the 1990s that does not deviate from the range of expected variability in performance progress over time. Using the 1970s as a baseline, findings further showed a significant linear and curvilinear progress in time performance within and across the three Grand Tours. Inconsistent with El Helou et al.’s conclusion, however, the rapid linear progress originates in the 1980s, not in the 1990s, and gradually levels off from the 1990s onwards in all three multi–stage races. Findings strongly question opinions about the effects of the ‘epo epidemic’ on cyclists’ performances.
Keywords: Epo Epidemic, European Stage Races, Progress in Cycling Performance, Professional Road Racing
Article Outline
1. Introduction
- In the past twenty years, professional road racing suffered a downpour of positive doping cases confirming the image that top–level cycling is unfeasible without pharmacological support[2]. Verbruggen[3], former president of the International Cycling Union (UCI), the sport’s governing body, underpinned this negative image by stating that the 1990–2000 periods in professional road cycling could be typified as an ‘epo epidemic.’ El Helou et al.[1] also seem to confirm this stereotypic image. They analyzed mean km.h -1 performances (kilometers per hour, or kph performances) of professional cyclists who reached the first ten places in thefinal standings of eleven European races from 1892 to 2008The races included famous one–day classic races, such as Liège–Bastogne–Liège, as well as the three Grand Tours, i.e., the Tour de France, Giro d’Italia, and Vuelta a España. Inspired by the Gompertz growth function, well known in biology, they applied a previously developed time–series model[4] to assess riders’ progress in performance and distinguished four periods: Before (P1), between (P2), and after World War I and II (P3), while the fourth period (P4) starts after 1993. They further observed a major improvement of 6.38% in riders’ performances in period four (1993–2008) relative to period three. Evidently, the association between their findings and Verbruggen’s[3] years of the epo epidemic is striking. Indeed, after reviewing results of laboratory studies examining the performance –enhancing effects of epo doping, El Helou et al.[1, p. 794–795] concluded that this ergogenic agent provided a “significant physiological advantage” of 6.3–6.9% in aerobic capacity. They further maintained that this advantage is consistent with the 6.38% improvement in performance found in their own study. Although very interesting in their own right, El Helou et al.’s observations can be criticized. First of all because it is rather hazardous to directly generalize performance improvements observed in laboratory situations to actual competitions[5-6]. Second, because some methodological flaws might have invalidated their findings. For instance, Lodewijkx and Brouwer[7] also evaluated performance progress in the three Grand Tours from 1947 to 2008, using winning riders’ time performances, but not kph performances, as the dependent variable. Their study revealed that three confounding variables significantly influenced riders’ achievements in the post–WW II years. The first variable referred to the distances of the races, which strongly declined over the years, ranging for instance between 4,922 km (Tour 1948) and 3,430 km (Tour 2011). The second variable concerned the number of stages in the races. With advancing years, this number increased, implying that the distances of the stages in the races also became less long. The third variable related to the brutality rate of the races conceived as an indicator of the harshness of the races. The rate was operationalized as the number of riders that finished the race in a given year over the total number of riders that started the race in the same year. In 1948, the brutality rate of the Tour amounted to 63%, whereas in 2011 it was only 12%. After statistically controlling for the influence of these three variables on riders’ time performances, findings revealed that victors of the Giro showed a distinct slower linear progress compared to winners of the Tour, whereas in the Vuelta winners hardly showed any linear progress. Besides, relative to the Giro, winners’ performances in the Tour and Vuelta were more strongly characterized by a significant W–curve, indicating that riders rapidly increased their speed in the years after WW II, followed by a decline in the 1960s and 1970s and an incline in the 1980s. Clearly, these comments and observations qualify conclusions drawn by El Helou and colleagues[1] and emphasize, first, that it is imperative not to underrate the importance of confounding variables that may distort evaluations of riders’ accomplishments in professional road races over the years. Second, the 6.38% progress reported by El Helou et al. can also be criticized. Performances in the third period may have been be deflated by the relatively slower speeds achieved by riders in the years directly following WW II. To assess riders’ performance progress in El Helou et al.’s critical fourth period more validly, we argue that they should be compared with performances of their counterparts in directly preceding years. Last, the 6.38% progress concerns the achievements of the first ten classified riders that were aggregated across eleven races and encompassed the years between 1993 and 2008. The progress thus concerns performances of 10 * 11 * 16 = 1760 riders in total. However, studies that attempted to roughly estimate the use of epo doping among top–level endurance–sport athletes in that era concluded that epo was used by ~3–7% of them[1, 8-10]. Hence, the argument that performances of all 1760 riders in that era somehow came about through illicit, unnatural means is not very convincing.
1.1. Three Research Questions
- All things considered, we argue that El Helou et al.’s observations concerning their fourth period might be spurious, because they did not consider the influence of confounding variables on riders’ achievements. Our first research question therefore concerns an illustration of the influence of three such variables (distance, number of stages, and brutality rate) on performances accomplished by all winners of the three Grand Tours from 1903 to 2011. With our second research question we aim to assess the general influence of the ‘years’ variable on riders’ performances. Our third research question refers to specific comparisons of riders’ performances between years. Is the (alleged) improvement in riders’ speed in El Helou et al.’s fourth period correct if this improvement is compared to improvements found in more adjoining years? Reckoning the influence of the three confounding variables on riders’ exploits over time will help us to validly address the latter two research questions.
2. Method
2.1. Design and Samples
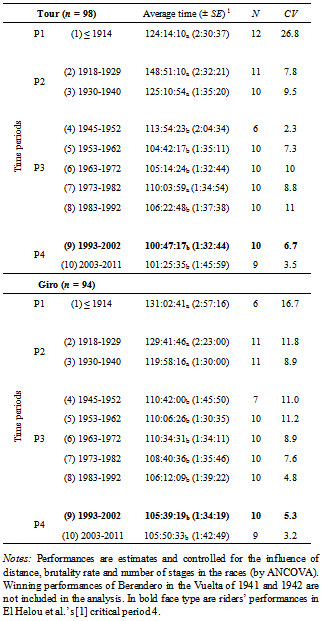
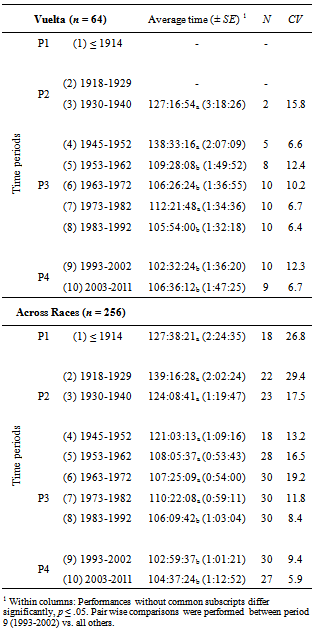
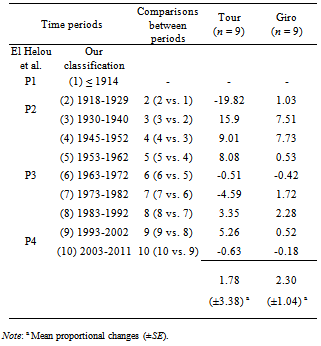
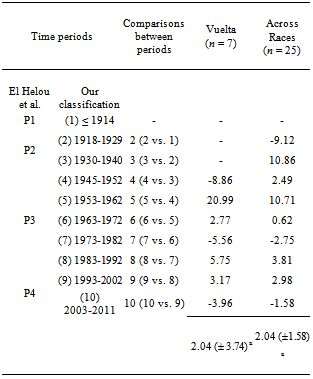
- To address these questions, we supplemented the data of the Lodewijkx and Brouwer study[7] by performances of winning riders, demonstrated in the years before WW II and the years from 2009 to 2011 (N = 256). In regard to the Tour, n = 98, and this race comprises the years from 1903 to 2011. The number of observations for the Giro amounts to n = 94 and they encompass the years between 1909 and 2011. As to the Spanish race, n = 64, owing to the fact that the Vuelta started in the 1930s and was disrupted in the late 1940s and the early 1950s by economic and political troubles[11]. We next partitioned the year variable into ten different time periods and took care that we accounted for the four progression periods, distinguished by El Helou and co-workers. The critical year 1993 served as the criterion to classify time periods after WW II. The first two columns of Table 1 present an overview of El Helou et al.’s four periods, as well as our own classification.
2.2. Assessments
- We retrieved information concerning our variables from[12], one of the sources that El Helou et al. used. Kph performances varied between 21,680 and 42,530 (M = 34,533; SD = 4,781). We expressed riders’ time performances in hours, minutes and seconds and they varied between 64:46:20 and 238:44:25 with M = 113:11:04 (SD = 32:51:03). The correlation between the two measures, r(256) = -.75, p ≤ .001, indicates a common variance of 56.3% between the two variables. Table 1 presents descriptive statistics (M±SE) and the coefficient of variation (CV) of riders’ time performances. The CV indicates that, consistent with El Helou et al.’s observations, the dispersion in these performances gradually grows smaller over the years (except for the Vuelta in period 9). The distances of the races ranged between 2,388 and 5,745 km (M = 3,791; SD = 661.550) and the number of stages between 6 and 25 (M = 19.46; SD = 3.62). We operationalized the brutality rate by 100 - ((Nriders fnished / Ntotal riders) ● 100) with higher rates designating more demanding races. The rate varies between 12–90% (M = 39.72%; SD = 16.97). Correlations (df = 256) with time periods showed that the distances of the races (r = - .31) and the brutality rate (r = -.77) declined over time, whilst the number of stages in the races increased (r = .63; all p ≤ .001).
|
|
2.3. Analyses
- To answer our first research question concerning the influence of the covariates, we subjected the time and kph performances to analysis of covariance (ANCOVA) with time periods as the independent variable and distance, number of stages and the brutality rate as covariates. We performed ANCOVA for the three races separately (within races) and for the aggregated sample (across races, this analysis also included stage races as an independent variable). ANCOVA adjusts for the influence of covariates on dependent variables and, in our case, allows calculations of riders’ estimated performances. In addressing our second and third research question, these estimates served as the dependent variables. In regard to our second research question, results of ANCOVA will yield general information concerning the influence of time periods (as a main effect) on riders’ performances. We examined our third research question in three different ways. First, we subjected the performance measures to pair wise comparisons with time periods as the independent variable, as ANCOVA follow–up. Second, we calculated the proportional change in performance between time periods to assess the validity of El Helou et al.’s 6.38% progress in performance observed in their fourth period. We compared performances in a given period (Pt) with performances exhibited in the immediate foregoing period (Pt - 1): Proportional progress = ((Pt – Pt-1) / Pt-1) * 100. Positive numbers (%) indicate faster performances. Third, we determined the linear and / or nonlinear nature of the influence of El Helou et al.’s critical period on riders’ performances by conducting polynomial contrasts analyses, also as ANCOVA follow–up. To avoid Type I–errors, results of all statistical tests were Bonferroni controlled.
3. Results
3.1. Distance, Number of Stages, and Brutality Rate
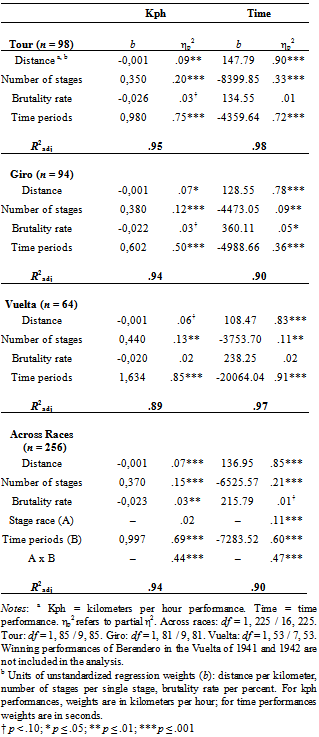
- Table 2 presents the summarized results of ANCOVA relating to both dependent variables. The variables included in the analyses explain between R2adj = .89–.98 of the variation in the dependent variables. The unstandardized regression weights of the three covariates can also be seen in Table 2. We will restrict the presentation of these weights to the findings across races, because the weights obtained within races generally yielded similar relationships. Greater distances of the races are associated with a decrease in performance of one meter per hour per kilometer distance (b = -0,001 m) or with an increase of 2 min and 16 s per hour per kilometer distance (b = 136.95 s). Increases in the number of stages in the races significantly facilitated riders’ kph performances with 370 meter per stage (b = 0,370 m) or decreased time performances with 1:48:46 per stage (b = -6525.57 s). Compared to the effects of the former two variables, the influence of the brutality rate is less pronounced and in some cases not significant. Most likely this is due to the rather strong covariation which exists between time periods and the brutality rate (r = -.77). Across races, Table 2 shows that more brutal races are associated with performance decreases of 23 meter per hour per unit of the brutality rate (b = -0,023 m) or with increases of 3 min and 35 s (b = 215.79 s) in time performance. In sum, findings indicate that the three covariates facilitated riders’ performances to a greater or a lesser extent over the years. Table 2 further indicates the differential influence of the distances of the races on the two dependent variables. As to riders’ kph performances, the amount of variation explained by distance ranges between ηp2 = .09 (Tour) and ηp2 = .06 (Vuelta). Conversely, the amount of variation explained by the same variable on riders’ time performances ranges from ηp2 = .78 (Giro) to ηp2 = .90 (Tour). In other words, kph performances strongly blur the profound influence of the distances of the races on riders’ achievements. Consequently, we argue that time performances are more valid to examine riders’ performance progress over the years, because this variable is not biased by the distance variable. This constitutes the reason why the common variance between the two dependent measures is rather low (56.3%; see sections above).
|
3.2. Time periods
- The effect of time periods on both performance measures is also presented in Table 2. Panels A and B in Figure 1 depict the relationships between the variables across races. Time periods explain between ηp2 = .36 (Giro) to ηp2 = .91 (Vuelta) of the variation on both dependent measures, respectively.
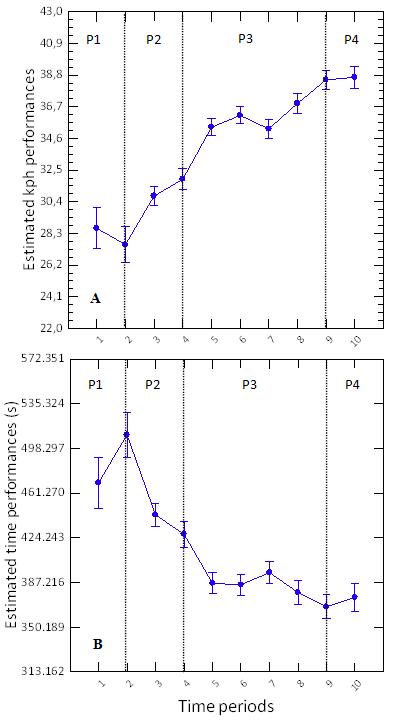 | Figure 1. (Panels A and B). Winners’ estimated kph performance (Panel A) and time performances in seconds (Panel B) per time period (1903–2011) across the three Grand Tours (M±SE). P1 to P4 refer to El Helou et al.’s[1] four progression periods. Performances are adjusted for the influence of distance, stage number, and brutality rate in the races. Period 7 (1973–1982) indicates a turning point in performance in all three races. Period 9 coincides with El Helou et al.’s critical fourth period (P4, 1993–2002) |
3.3. Progress
- Since we concluded that time performances are more valid to assess riders’ progress over the years, we restricted the examination of our third research question to this dependent variable.
3.3.1. Pair Wise Comparisons
- Results relating to multiple comparisons between periods are summarized in Table 1. Across races, winners’ time performances in the crucial period 9 (1993–2002) do not differ significantly from winners’ time performances in the immediate foregoing period 8 (1983–1992) or succeeding period 10 (2003–2011). Performances in period 9 only differ significantly from those demonstrated by winning riders in periods 1 to 7 (1903–1982). In the Tour, performances between period 9 vs. periods 1, 2, 3, and 7 differ significantly. In the Italian race, significant differences emerged between period 9 vs. periods 1, 2, and 3. As to the Spanish race, we obtained significant differences between period 9 vs. periods 3, 4, and 7. Given these findings, our first conclusion is that riders’ estimated time performances in El Helou et al.’s critical years do not differ from performances displayed by riders in immediate foregoing or succeeding periods. Second, period 7 (1973-1982) indeed appears to be pivotal in riders’ evolution in performance in the three Grand Tours.
3.3.2. Proportional Changes
- The calculated proportional changes in estimated time performances between periods are presented in Table 3 and Figure 2. El Helou and co–workers compared riders’ averaged kph performances in P4 vs. P3. Based on results of ANCOVA, our estimates of riders’ performances are M = 110:56:48 (P3) and M = 107:24:39 (P4) respectively, indicating an improvement of 3:32:08 or 3.18% (p = .025). Importantly, Table 3 indicates that across races and time periods the average proportional change is M = 2.04%, with a standard error of SE = ±1.58. This indicates that the 3.18% progress we observed cannot be considered a striking improvement, because it falls within the range of ±2SE.Since we concluded that period 7 appeared to be key in riders’ improvement in performance, we decided to use this period as a baseline to illustrate riders’ progress per period. Compared to the sixth period, period 7 is characterized by a decline in performance in the Tour (-4.59%) and Vuelta (-5.56%), but by a small increase in the Giro (1.72%). Across races, the decrease in performance in period 7 is followed by an increase of 6.56% in period 8, which can mainly be attributed to the strong progress observed in the Tour (7.94%) and Vuelta (11.31%), but less so to the performance progress observed in the Giro (0.56%). Across races, the progress from period 8 to 9 —i.e., El Helou et al.’s crucial years— amounts to 2.98%. However, within races this progress shows strong variability: Tour 5.26%; Giro 0.52%, and Vuelta 3.17%. Subsequently, compared to period 8, riders’ performances in period 9 are typified by a small decrease of -0.83% (across races), which can mainly be traced to decreases in the Vuelta (-2.58%) and the Giro (-1.76%), while in the Tour riders show an increase of 1.91%. Figure 2 shows that this slow but sure decrease is sustained in period 10 (2003–2011): Across races -4.56%; Tour -5.89%; Giro -0.70%; Vuelta -7.13%.
|
|
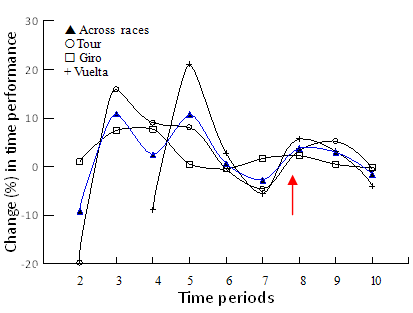 | Figure 2. Proportional change (%) in winners’ estimated time performance between periods (1903–2011) within and across the three Grand Tours. Positive changes indicate performance progress. The solid arrow indicates a fast progress in performance from period 7 (1973–1982) to period 8 (1983–1992). Across races as well as in the Giro and the Vuelta, the figure show a proportional decline in performance in period 9, which coincides with El Helou et al.’s[1] critical fourth period (P4, 1993–2002). In the same period 9, only riders in the Tour showed an improvement in performance of 1.91% compared to period 8 |
3.3.3. Polynomial Contrasts
- In these analyses, time periods 7 to 10 served as the independent variable and estimated time performances as the dependent variable. The results of the analyses confirm the linear and curvilinear pattern in proportional changes, alluded to above. They can be seen in Figure 2. The linear contrasts provided the best fit to the time performance data: Across races ηp2= 0.48; Tour ηp2 = 0.54; Giro, ηp2 = 0.53; Vuelta, ηp2 = 0.26 (Fs ≥ 11.50, ps ≤ .01). Importantly, the quadratic contrasts were also significant: Across races ηp2 = 0.14; Tour ηp2 = 0.12; Giro ηp2 = 0.12, Vuelta, ηp2 = 0.11 (Fs ≥ 4.16, ps ≤ .05).All these findings provide an answer to our third research question. Using the 1970s as a baseline, riders showed a significant linear progress in performance in all three races. However, inconsistent with El Helou et al.’s conclusion, this progress originates in the 1980s, not in the 1990s. Besides, as Figure 2 shows, in all three Grand Tours the progress in time performance gradually levels off from 1993 onwards.
4. Discussion and Conclusions
- The results of our study do not confirm the conclusion put forward by El Helou and co–workers[1]. First, across races, the improvement of 3.18% in time performance we observed beyond the 1990s does not deviate from the range of expected variability in performance progress over time. This finding is also inconsistent with Verbruggen’s[3] statement relating to the profound effect of the ‘epo epidemic’ on performances in professional cycling in the 1990-2000 period. In agreement with conclusions drawn by Lodewijkx and Brouwer[7], our results substantiate that the 1980s appear to be key in the rapid evolution of pro cyclists’ performances and not the 1990s, at least in the three Grand Tours which we investigated. Second, as already observed by the same researchers[7], the current findings show differences in performance progress between races and this observation also qualifies conclusions drawn by El Helou and colleagues as well as Verbruggen. The progress in the Italian race is ‘slower’ and characterized by more gradual changes compared to the French and Spanish race. The latter two races show a closer resemblance to each other in the evolution of riders’ speed over time, that is, beyond the 1950s. However, much more research is needed to clarify the observed differences in performance progress between the three Grand Tours.
4.1. Reforms in the 1980s and Beyond
- In his seminal, socio–historical analysis of professional cycling, Brewer[13] described various plausible reasons why riders increased their speeds in the 1980s. He distinguished a ‘classical period’ (1950–1984) followed by what he labeled ‘the years of reform’ (1984–1989). Findings of our analyses designate that Brewer’s years of reform coincide with the period in which riders demonstrated a rapid evolution in performance in the three Grand Tours. We refer to Brewer’s paper and studies of our own[7, 14] for an extensive analysis of these reforms. Here we will briefly summarize the arguments. During these years, riders from Russia, Colombia, the U.K. and the U.S.A slowly broke down the closed group system which typified professional road racing in Europe in the classical period[14]. During the same years, professional cycling faced a progressively deepening commercialization of the sport. Large–scale, international firms took an interest in the sport, invested money in riders, teams, staff and equipment, and set high aspiration levels and demands, resulting in more severe competition between riders. Furthermore, instigated by American racer and three–time Tour winner Greg LeMond, drastic changes in the financial situation of the riders took place. In the mid–1980s, LeMond was the first professional rider ever to sign million–dollar contracts with his sponsors. After him the financial situation of professional cyclists gradually improved. This development implied that the sponsoring firms started to put greater pressure upon riders and their teams to succeed in the races in which they took part. Moreover, during the transition period, the social relationships within the teams gradually changed from hierarchical to more egalitarian[15]. These new team structures allowed riders other than the few dominant team leaders to go for a win in races in which they participated, thereby enhancing the competition between riders. The same years of transition further represent a step forward in training methods, developed by Italian physiologists Fransesco Conconi and Michelle Ferrari, which was based on scientific knowledge. The newly introduced methods steadily enhanced riders’ athletic capacities. Another important factor, not mentioned by Brewer, also improved performance. The introduction of fluid carbohydrate drinks in the ‘80s enabled riders to maintain blood–glucose homeostasis in multi–stage races and to maintain energy balance during stage events. This variable contributed to faster physical recuperation, thereby enhancing the potential of better performances while racing. In 1989, these nascent reforms were finalized by the implementation of the UCI–rankings system in professional road racing, which aimed at globalizing and commercializing the sport and to boost the competition in the professional group of riders. According to Brewer[13, p. 293], the system was successful, since riders and team directors started to complain about “the increasingly cutthroat nature of competition and the increased speeds in races.” Conjointly, all these factors steadily led to improvements in the athletic capacities and performances of all riders in all eleven races that El Helou and colleagues examined, culminating in faster races. Then remains the question: Why does this rapid progress level of in the 1990s and beyond? One partial answer can be found in the economic law of diminishing returns. The factors alluded to above may have restrained the differences in the athletic capacities of top-level cyclists in our contemporary period. Due to these continuing developments, all pro cyclists became increasingly versatile, performing at a comparatively equal, but very high level in our modern times. Plausibly, this could explain the stabilization in riders’ performances in the last decades. Another partial answer is presented by Perneger[16]. He examined mean kph performances of riders who reached the fifth place in the final rankings of the three European Grand Tours in the period 1990–2009. He calculated that between 1990 and 2004, riders’ speed increased by 0.16 kph per year and further observed a decrease in speed of 0.22 kph per year from 2004 onward. In 2000, the World Anti–Doping Agency (WADA,[17]) implemented a test for epo and in 2003 for blood doping. Perneger[16] interpreted the decline in riders’ mean kph since 2004 as evidence for the successes of WADA in its fight against doping. Perneger’s findings generally confirm our own findings, but he did not compare performances in the 1990s with performances in the 1980s. As we have shown, the latter comparisons sketch a very different picture relating to riders’ progress in speed over time, implying that he might be mistaken in his conclusions. Perhaps, our explanation is the most parsimonious to clarify the relative decrease in performance since the 1990s. Still, much more research is needed to provide any conclusive answers.