-
Paper Information
- Previous Paper
- Paper Submission
-
Journal Information
- About This Journal
- Editorial Board
- Current Issue
- Archive
- Author Guidelines
- Contact Us
International Journal of Sports Science
2011; 1(1): 9-19
doi: 10.5923/j.sports.20110101.02
Psychological Correlates of Physical Activity in Children and Adolescents: A Cluster Analytical Approach
Kamtsios Spiridon
University of Ioannina, Ioannina, 45221, Greece
Correspondence to: Kamtsios Spiridon , University of Ioannina, Ioannina, 45221, Greece.
| Email: |  |
Copyright © 2012 Scientific & Academic Publishing. All Rights Reserved.
The purpose of the study was to examine the potential differences in factors that control physical activity participation in primary, high school and senior-high school students through a cluster analytic approach, in relation to leisure time physical activity participation and body mass index (BMI). One thousand, one hundred and forty eight (1148) pupils participated in this study, aged 11-18 years. The study was held through questionnaires and all scales had acceptable levels of internal consistency (α>.70). Students were divided according to their BMI, to those with: a) normal BMI, b) overweight children and c) obese children. A clustering-by-cases procedure was used to classify the participants (in proportion of the school level and their BMI) on the basis of their response to the questionnaires and the three cluster solution revealed that there were different student’s groups in primary, high school and senior-high school with regard to physical activity participation, body mass index (BMI) and psychological correlates of physical activity. An improved understanding of the factors associated with physical activity in these groups may assist in the design of appropriate interventions to promote physical activity.
Keywords: Physical Activity, Cluster Analysis, Psychology
Cite this paper: Kamtsios Spiridon , "Psychological Correlates of Physical Activity in Children and Adolescents: A Cluster Analytical Approach", International Journal of Sports Science, Vol. 1 No. 1, 2011, pp. 9-19. doi: 10.5923/j.sports.20110101.02.
1. Introduction
- Targeting children’s patterns of physical activity1 is especially important given the argument that physical activity in childhood serves as the foundation for a lifetime of regular physical activity. Moreover, regular participation in physical activity is associated with numerous physiological, psychological and social health benefits and effects for children[1] such as lower risk of heart disease, lower blood pressure[2], increased social acceptance[3], elevated self-esteem and feelings of well being[4].However, while the positive effects of regular physical activity participation are well established in children and adolescents, there is evidence to demonstrate that young people in many developed nations do not participate in enough physical activity of the type and intensity associated with health benefits[5]. Research findings continue to indicate that young’s people activity level decreases with age and that children and adolescents are choosing to opt out of school physical education programs once the subject becomes elective[6,7]. Many studies report that young people’s schooland after school physical activity is rapidly diminishing[8-11]. The more children grow up, the less they exercise2. In fact, exercise behaviour gradually decreases even during the school years[9,12], as there is typically a decline in physical activity as children move from middle childhood into adolescence. This may result both from increased barriers to physical activity and the increased alternatives available as children mature[14]. As a result, some children participate in physical activity and some other tends to adopt sedentary or inactive behaviours with lower levels of physical activity. Inactivity is closely linked with childhood obesity3 and overweight4 [15,16] and with other health related behaviours such as smoking, diet, drug use and sexual activity[1,17]. A variety of theories have been used in physical determinants research to explain and predict the adoption of an active lifestyle and physical activity participation in children, adolescences and adults. These theories investigated the extent to which psychological characterises may predict physical activity participation and which psychological characterises differ between age, gender, socioeconomic status and overweight level. The most important of these theories include: the Theory of Planned Behavior[18], which is an extension of the Theory of Reasoned Action[19], the Social Cognitive Theory[20] and the Competence Motivation Theory[21]. The Theory of Reasoned Action[19] is based on the assumption that intention is an immediate determinant of behaviour and that intention in turn is predicted from attitude and subjective norm. Attitude is a function of the beliefs that participation in physical activity will result in certain outcomes, as well as the evaluation or value of these outcomes as having positive or negative consequences. The Theory of Planned behaviour adds the assessment of perceived behavioural control as a direct determinant of the behaviour and as indirect determinant through its influence on intentions. Perceived behavioural control is the perception that one possesses the resources and the opportunity to execute the behaviour. The Social Cognitive Theory[20] emphasizes the importance of both psychological and environmental variables. In this theory, self-efficacy, or confidence in one’s ability to perform a specific behaviour in a particular situation, is thought to be a primary psychological mediator of behaviour, next to outcome expectations, the estimates that a given behaviour will lead to certain outcomes. Competence Motivation Theory[21] posits that children’s motivation to participate in physical activity is influenced by their fundamental motor skill proficiency, perceived physical competence, social support and enjoyment of physical education. According to the above theories attitudes, intentions, perceived physical competence and enjoyment are critical factors in motivating children to be physically active[22]. Children and adolescents who had positive attitudes about physical activity were more likely to plan and maintain physical activity in the future. Promoting positive attitudes towards physical education could influence motivation to participate in physical activity, especially among students who are not active very much[9,23-25].Enjoyment is an affective factor related to valuing the activity and having fun[22]. Research has found that the most common reason for children and adolescents participating in physical activity is enjoyment[23] as children’s motivation to participate in physical activity is influenced by their perception of the activity as being fun and worthwhile or boring or unpleasant[26,27]. Enjoyment has been linked to perceived competence and mastery[28]; children find physical activity fun when they can succeed at experiences they find challenging[27,29]. Perceived competence is a factor that has been found to influence children’s decisions to be physically active[22]. Perceived competence is an individual’s perception of control over his or her personal behaviour, which may reflected by perceptions of performance success and the attribution the individual makes for a given outcome. Students with high perceived competence opt for challenges and self determination in learning contexts[30]. That is, the more children perceived they were competent in regard to physical activity, the more likely they were to be engaged in this activity[31].Many studies have investigated these psychological correlates of physical activity in children and adolescents [5,7,32,33] and few studies investigated the extent to which these variables differ in overweight, obese and normal weight children and adolescents[1,11,34-36]. To date, no known research has investigated the above psychological correlates of physical activity through a cluster analytic approach. Cluster analysis has not been used much in sport and exercise research, although examples are available on physical activity and health behaviors[37]. Wang and Biddle (2001)[37] mention that few large-sample studies have identified types of clusters of pupils based on their scores on validated inventories. For example, the purpose of the study carried out by De Bourdeauhuij and Oost (1999)[38] was to investigate, on the basis of cluster analysis, whether healthy behaviors clusters in a healthy or unhealthy way, whether physical activity can discriminate among these variables, and whether groups identified could be characterized by demographic variables. Weiss, Ebbeck and Horn (1997)[39], explored (using cluster analysis) relationships among children’s age, individual differences and sources of physical competence information. Wang and Biddle (2001)[37] in their study report the results of a cluster analysis using contemporary approaches to physical activity motivation.Therefore, the purpose of this study is to examine the potential differences in the factors that control physical activity participation in primary, high school and senior-high school students and in students with different body mass index, on the basis of cluster analysis. It was hypothesized, therefore, that different students groups would exist, with different psychological characteristics and with different physical activity behavior.
2. Material and Methods
- ParticipantsOne thousand, one hundred and forty eight (1148) pupils participated in this study. They were distributed as follows: 603 pupils from primary school (273 boys & 330 girls), 282 pupils from high school (162 boys & 120 girls), and 263 pupils from senior high school (104 boys & 159 girls) aged 11-18 years. All of them were living in sub-urban and urban areas of west-northwest Greece.MeasuresStudents completed the following scales.Attitudes: The Planned Behavior Theory Questionnaire[18], adapted to the Greek language from Theodorakis (1994)[40], was used. Students responded in four scales (good-bad, healthy-unhealthy,pleasant-unpleasant, and useful-not useful) assessing their dispositions toward exercise. The responses were indicated on 7-point semantic differentiation scales (1=very bad, 2=bad, 3=rather bad, 4=neither good nor bad, 5=rather good, 6=good, and 7=very good). Intentions: Students responded to two questions assessing their intentions to exercise. The questions were, I intend to exercise during the next 12 months (impossible=1, possible=7) and I am determined to exercise during the next 12 months (absolutely no=1, absolutely yes=7). Similar measures of intention have been used in previous studies in the Greek physical activity context showing sound psychometric properties. Perceived effort and enjoyment: Two subscales of the Intrinsic Motivation Inventory[41] were used to measure students’ perceived effort (e.g. I put all my effort into physical education lesson) and enjoyment (e.g. I enjoy the physical education lesson very much). Students responded to 10 items on a 5-point scale (I absolutely agree=5, I absolutely disagree=1). Self-perceptions: The “sport competence” and “attractive body” subscales of the Physical Self-Perception Profile[42] were used to measure self-perceptions. The sports competence scale consisted of six items (e.g. I am one of the best when it comes to sport). Students reported on a 5-point scale (exactly as I am =5, I am not at all like this =1). The attractive body scale included six items (e.g. compared with the majority, I have an attractive body). The students indicated their responses on a 5-point scale (certainly yes =5, certainly no =1). The scores for attitudes, intentions, perceived effort, enjoyment, sport competence and attractive body were calculated as the mean of the responses to each item of the respective subscales. Physical Activity Levels: The Leisure Time Exercise Questionnaire (LTEQ)[43], were used. LTEQ is a simple questionnaire designed to assess leisure time physical activity over a 7-day period. The participants were asked to indicate the average number of times per week during their free time that they engage in strenuous, moderate and mild exercise for more than 15 minutes. The question is scored by multiplying the number of times per week that the subject indicates he/she has participated in physical activity against corresponding anticipated MET (measurement in exercise testing) value for strenuous (9 METS), moderate (5METS) and mild exercise (3METS). The sum of the three scores is considered the total score for the question (physical activity index).Although recall of physical activity is a complex cognitive task, especially for children[44,45], some evidence indicates that younger children can report their activities with reasonable accuracy, even over a 7-day period[46]. To help children recall the activities they were engaged, we presented (together with the Leisure Time Exercise Questionnaire) a list of activities in which children of this age (primary, high and senior high school) are commonly engaged. Those activities included running, rope jumping, playing games, and sport activities, such as basketball, football, volleyball and handball. Activities were selected and presented in such a way as to be representative of the age and the culture of the children, and they were asked to identify the activities that were hard enough to make them tired or breathe hard or sweat. Also participants had been presented with examples of the definition of strenuous (e.g. active sports training, practices and competition), moderate (e.g. street play) and mild exercise (e.g. walking to school). It was clear for the children that the questionnaire did not include physical activity that was performed during normal school time. This is because in most European countries, physical education is compulsory and therefore cannot be classified as a leisure activity. Definition of overweight and obesityBody Mass Index (BMI) is considered one of the most appropriate measures for the indirect assessment of adiposity in childhood and adolescence[47]. BMI (body mass index) was calculated by dividing weight by height squared (kg/m2). Regarding classification of the study population into overweight and obese, the age and sex-specific BMI cut-off points proposed by the Childhood Obesity Working Group of the IOTF have been adopted[48]. These cut-off points have been widely used in studies with children and adolescents[49] and there is a broad consensus that BMI is the most suitable adiposity index for children in clinical and field settings[50]. As stressed by Cole et al[48] (2000), this definition is less arbitrary and more international than others, and should encourage direct comparisons of trends in childhood obesity worldwide.ProcedurePrior to the collection of data, we obtained permission to conduct the study from the Greek Ministry of Education and the children voluntarily chose to participate. Having explained the purpose of the study the investigator visited the schools and administered the questionnaire in the classroom. The students were given verbal instructions with regard how to complete the questionnaire. After the opportunity for clarification and questions, they responded to the measures. Generally, the completion of the questionnaires required 15-20 min. All questionnaires were completed confidentially and each subject was assigned a code number. Anthropometric measurementsAge (accurate to 1 month) was recorded. Standing height was measured to the nearest 0.5 cm (Seca Stadiometer 208) with shoes removed, feet together, and head in the Frankfort horizontal plane. Body mass was measured to the nearest 0.5 kg (Seca Beam Balance 710) with shoes, sweaters, coats, and jackets removed. Body Mass Index (BMI) was calculated by dividing weight by height squared (kg/m2).Data analysisMeans and standard deviations were calculated for attitudes, intentions, and effort in physical education lesson, perceived athletic competence, perceived body attractiveness and for their participation in mild, moderate and vigorous physical activity. Post hoc analyses (Tuckey) were conducted to determine differences between each group. Results are presented as means ± SD. Pearson product moment correlations were computed among the scales scores for each of the clusters. Multiple regression procedures were used to determine whether the psychological variables might predict physical activity participation in each of the three cluster groups, for each school level. The residual gain scores were the criterion measure. The significance level for entry was set at .05. The SPSS (version 15 for windows) statistical package was used, and significance was set at p<.05.A clustering-by-cases procedure was used to classify the participants (in proportion of the school level and their BMI) on the basis of their response to the questionnaires. Cluster analysis is a collective term covering a wide variety of techniques for delineating natural groups or clusters in data sets[51]. The aim of cluster analysis is to identify homogeneous groups or clusters based on their shared characteristics. The inherent validity of cluster analysis is determined by its ability to identify patterns that are consistent with existing research[51].The clustering algorithms are broadly classified into two namely hierarchical and non-hierarchical algorithms. In the hierarchical procedures, we construct a hierarchy or tree-like structure to see the relationship among entities (observations or individuals). Each observation starts out as its own cluster. Subsequently, new clusters are formed by the combination of the most similar clusters until either all clusters are grouped into one cluster or the researcher considers that a parsimonious solution has been achieved. In the non-hierarchical method a position in the measurement is taken as central place and distance is measured from such central point. Non-hierarchical methods (k-means) assign observations into clusters using nearest centroid sorting and requires the number of clusters to be specified[51]. Since each method has some disadvantages, it is best to combine the two. The number of clusters and the profile of the cluster centers can be established using the hierarchical methods. Following that, the non-hierarchical methods can be used with the cluster centers found in the hierarchical methods. In this way the non-hierarchical methods can verify the results of the hierarchical methods[52].In order to make a decision about the number of clusters, a hierarchical cluster analysis was carried out following the stages of cluster analysis process[52]. All the variables were standardized using Z scores. Standardization prevents variables measured in larger units contributing more toward the distance than the variables utilizing smaller units. Ward’s method selecting the squared Euclidean distance as a similarity measure was chosen. Ward’s method minimize the within clusters differences and avoid problems with forming long, snake-line chains found in other methods[53]. This analysis provides a tree model, a dendrogram, based on the distance between the clusters. On the basis of the dentrogram and on theoretical grounds a three-cluster solution was selected to be suitable. Once the number of the clusters was decided, a Quick Cluster Analysis was used to form the final groups. Solutions from cluster analysis can be unstable; therefore it is advised that additional analyses be used to check the solution obtained[53]. To confirm the clusters, a k-means clustering method was used. First, the centroid values obtained from the hierarchical methods were used as the initial seed points for the k-means clustering. The final centroid values and the cluster size were compared to those obtained from the hierarchical methods, and the profiles obtained from the k-means cluster analysis corresponded well with those obtained from the hierarchical cluster analysis, providing confidence for the three-cluster solution. One-way Anova, and Tuckey post hoc test were used to explore if there were differences between the three groups.
3. Results
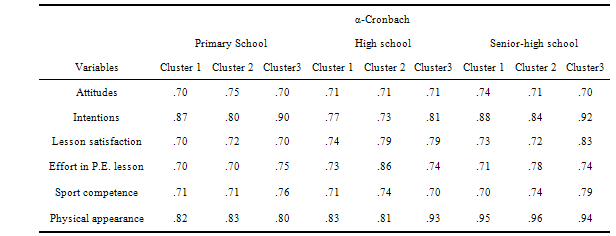
- Scales and reliabilitiesMeans and Cronbach alphas for different scales were calculated. Alpha reliability coefficients for all measures were deemed acceptable (Table 1) based on Nunnally’s (1978)[54] cut-off criterion of .70 for the psychological domain. The results are in line with the existing literature as the questionnaires assessing attitudes and intentions have been shown to be reliable and valid[9,40,55]. Results also from previous studies in physical education support the validity and reliability of perceived effort, enjoyment and self-perceptions scales[11,55-57].
|
|
|
|
|
4. Discussions
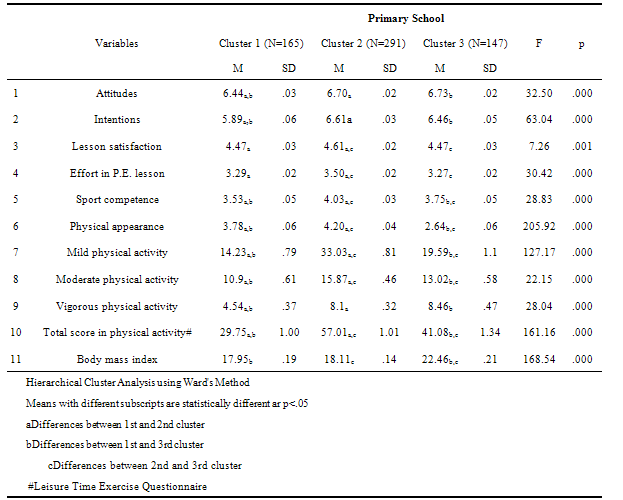
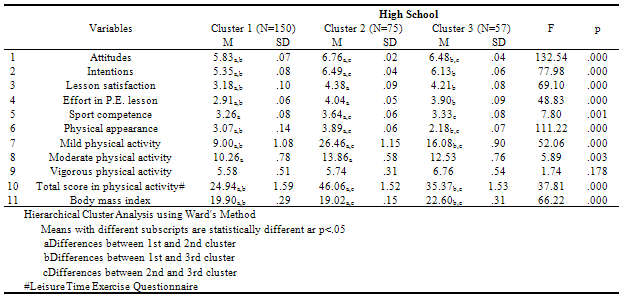
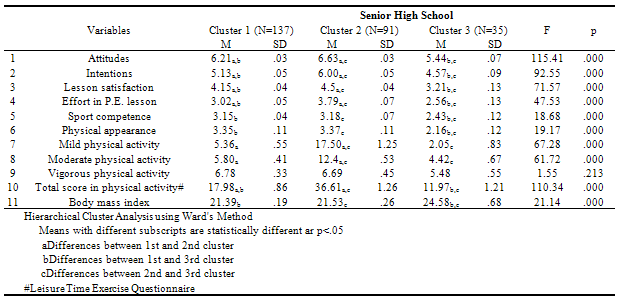
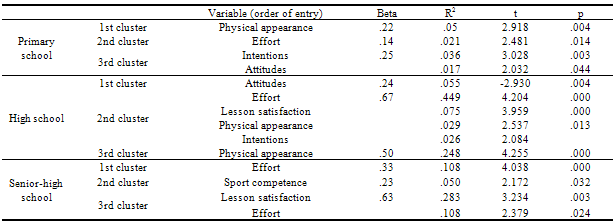
- The first purpose of the study was to investigate different students’ groups (in each of the three school levels) in relation to psychological correlates of physical activity and BMI. Results showed that there were three student’s groups in each of the school level (primary, high school, senior-high school) with almost the same characteristics for the primary and the high school students and a small alteration for the senior-high school: the first group (primary and high school students) was comprised by students with normal BMI. Their participation in leisure time physical activity was low and they had less favorable psychological correlates related to physical activity than the other two groups. In the second group (primary and high school), students with normal BMI were included. They reported higher levels of physical activity participation, compared to the first and the third group, and they scored higher in the factors that control physical activity participation. The third group (primary and high school) comprised by obese and overweight students. They participated more in leisure time physical activity than the first group and less than the second group, they had positive attitudes and intentions towards exercise, they felt more sport competence and they put more effort in physical education lesson than the first group. However, obese and overweight students had lower scores in perceived physical appearance, than the other two student’s groups. For the senior-high school there was a difference between the three groups. Cluster analysis revealed that the third group (overweight and obese students) exhibited significantly lower levels of leisure time physical activity participation and they had less favorable psychological variables related to physical activity than the other two groups, with the normal weight counterparts. The study demonstrates that in primary, high and senior-high school there were different student’s groups, with different psychological characteristics related to physical activity and exercise, and tried to investigate these differences through a cluster analytic approach. Various previous studies had investigate differences in physical activity in children and adolescents with different degrees of overweight[58], or age-group differences in several psychological variables that predict physical activity participation[30]. These studies revealed that, as children get older and progressed in grade level, they show decreasing scores on effort and enjoyment in physical education lesson, feel less competent, become less task-involved and their exercise frequency decreases[10,14,30,59,60,61].No study, to our knowledge, had tried to investigate these parameters through a cluster analytic approach, and the results of this study revealed that in the same school level (primary, high, senior-high school) there were different groups of students and in these different groups physical activity participation and the other psychological correlates of physical activity differ in relation to the specific characteristics of each student’s group. The study showed that only in senior-high school obese and overweight students participate less in mild, moderate and vigorous physical activity and have less favourable psychological correlates related to physical activity than their counterparts. Also there was a gradual decrease in psychological variables and in physical activity participation with increasing degree of overweight especially in senior high school students. These results were in line with previous studies. According to Zabinski, Saelens, Stein, Hayden-Wade & Wilfley (2003)[36], various factors such as lack of interest in physical activity, being chosen last for teams, being teased by friends during physical activity and sports were more frequently reported from overweigh and obese children in comparison with their non-overweight counterparts. A recent study in children[62] found that children who are the target of weight criticism during physical activity showed lower sport enjoyment and reported lower physical activity levels. According to Pierce & Wardle (1997)[63] overweight children commonly report being embarrassed doing physical activity and sports and being excluded from games and sports because of their body size. Compared to other studies that reported lower levels on all potential determinants of physical activity in overweight and obese children and adolescents[35,36], the results of this study (with the three cluster solution) are unambiguous. Only the senior-high school overweighs and obese students (according to the cluster analysis) reported lower levels of physical activity compared to all normal weight students. Primary and high school overweighs and obese students (third cluster) had higher scores in psychological correlates related to physical activity (effort, perceived competence, attitudes and intentions) and higher levels of physical activity participation than students with normal weight who were categorised in the first cluster. For these students, attitudes and intentions are strong predictors of participation in physical activity[58] and their higher perceived competence indicates that these children are more active[64]. These students also scored higher in the enjoyment. Enjoyment of physical activity was found to be the most important predictor of physical activity in many studies[65,66]. Enjoyment of an activity has been linked to perceived competence[28] and activities that are perceived as fun and worthwhile tend to be motivating[26,27]. The regression analysis revealed that different psychological characteristics predict physical activity participation in the three clusters for each school level. The perceptions of effort, lesson satisfaction and perceived competence as predictors entered in the regression model in the present study for the second cluster for the primary, high school and senior-high school students respectively, were very similar with the psychological correlates or determinants of physical activity in children and adolescents in previous studies[38]. The perception that physical activity is fun, related to more participation in physical activity. Perceptions also of more confidence to continue with sports or physical activity explained engagement in more total physical activity[1,24]. Also, physical appearance seems to be a predictor of physical activity participation in the first cluster of primary school students and in the third cluster of high school students. Physical appearance, that is trying to look better, is an extrinsic motive. When intrinsically motivated, individuals engage in physical activity and exercise for the inherent pleasures that they derive from the activity. When extrinsically motivated, individuals engage in an activity for the external rewards that they attain through the activity. According to the self-determination theory, intrinsic but not extrinsic motives are likely to sustain long-term participation [67]. In retrospect, the study revealed that there were different student’s groups in primary, high school and senior-high school with regard to physical activity participation, body mass index(BMI) and psychological correlates of physical activity. This study also showed that overweight and obese primary and high school students differ in physical activity participation and had less favourable variables related to physical activity than their normal weight counterparts but there were also a normal weight group that participated less than obese and overweight students in physical activity and had less favourable psychological correlates related to physical activity. These results may help physical educators to be able to adapt intervention programs to enhance physical activity participation according to the specific characteristics of each group as these characteristics can influence, promoting or deterring physical activity participation. For example, the activities offered should be fun and enjoyable for all. Students are motivated to pursue an activity if they have successful mastery experiences that are evaluated positively [28]. Such experiences enhance perceived competence and heighten positive emotions associated with the activity[21]. The enjoyment children gain from participation in physical activity depends to a large extent on their perception of ability or self-mastery[32]. Activities also should be made as attractive and challenge for all, should have a high probability of success and should be tailored to the capabilities of overweigh and obese children and adolescents[35]. There were some limitations of the present study. First, the data relied on self-reports of physical activity and psychological variables. Although previous studies showed that the physical activity and the psychological measures had good reliability and acceptance validity, more objective measures of activity such as accelerometer data should have an additional value. The major strength of the present study is the use of a large community sample based upon a random selection of schools and the investigation that there were three student’s groups in each school level with different psychological correlates related to physical activity participation. The study contributes to the literature on associations with the physical activity behaviour of children (normal weight or overweight and obese) and may be of assistance to researchers designing experimental trials for school and community settings to increase physical activity in children and adolescents.
Notes
- 1. Physical activity has been defined a “and bodily movement produced by skeletal muscles that result in an expenditure of energy’.2. Exercise is defined as “planned, structured and repetitive bodily movement done to improve or maintain one or more components of physical fitness”.3. Obesity is defined as a condition of excess body fat mass, to such an extent that health might be impaired.4. Overweight is simply an excess weight for a given height regardless of the composition of the weight (Moore, et al., 1995).
 Abstract
 Reference
 Full-Text PDF
 Full-Text HTML