-
Paper Information
- Next Paper
- Paper Submission
-
Journal Information
- About This Journal
- Editorial Board
- Current Issue
- Archive
- Author Guidelines
- Contact Us
American Journal of Sociological Research
p-ISSN: 2166-5443 e-ISSN: 2166-5451
2014; 4(4): 113-122
doi:10.5923/j.sociology.20140404.02
Influencing Factors on Society Behavior towards Household Waste Management in Tulungagung
 Abstract
 Reference
 Full-Text PDF
 Full-text HTML
Slamet Sunarto1, 2, Mohammad Bisri3, Soemarno4, Suyadi5
1Environment Science and Technology Graduate Program, University of Brawijaya, Malang, Indonesia
2Regional Development Planning Agency of Tulungagung, East Java
3Department of Water Resources Engineering, Faculty of Engineering, University of Brawijaya, Malang, Indonesia
4Department of Soil Science, Faculty of Agriculture, University of Brawijaya, Malang, Indonesia
5Department of Animal Husbandry, Faculty of Animal Husbandry, University of Brawijaya, Malang, Indonesia
Correspondence to: Soemarno, Department of Soil Science, Faculty of Agriculture, University of Brawijaya, Malang, Indonesia.
| Email: |  |
Copyright © 2014 Scientific & Academic Publishing. All Rights Reserved.
The purpose of this study is to evaluate the factors that influence the society behavior towards household waste management in Tulungagung, thus it can be used as basic consideration for improving the efforts of Tulungagung Government to solve the problem of waste management in a more effective, efficient, environmental-friendly and sustainable way. This study conducted in three villages of Tulungagung Regency, namely Plosokandang, Tamanan, and Beji. This study used a total of 270 respondents as research subjects, includes the productive housewives (25 – 45 years old). We described cross-sectional society behavior as referred from the variables of knowledge, attitudes, actions and waste management in Tulungagung. Field observation and questionnaires collection were conducted in February – March 2014. This study uses PLS (Partial Least Square) analysis tool as the mediation approach. The results showed that the behavior of society on the household waste management in Tulungagung is fairly good. Factors that influence the society behavior on the household waste management are analysis, accept, mechanisms, and operational techniques. Behavior of household waste management is also heavily influenced by the knowledge and maturity level of the society.
Keywords: Household Waste, Partial Least Square, Waste Management
Cite this paper: Slamet Sunarto, Mohammad Bisri, Soemarno, Suyadi, Influencing Factors on Society Behavior towards Household Waste Management in Tulungagung, American Journal of Sociological Research, Vol. 4 No. 4, 2014, pp. 113-122. doi: 10.5923/j.sociology.20140404.02.
Article Outline
1. Introduction
- The increasing volume and diversity of waste and litter became characteristics due to the increase of population growth, change in consumption patterns, increase in public consumption and life activity of urban communities. Waste generated from the society activity and consumption have become environmental problems that must be addressed by any local government to support the active participation of the local communities themselves. Waste problem is also seriously concerned by Tulungagung Government as the 2006 to 2011’s award winning of Clean City in Indonesia. Nevertheless, in 2012 and 2013, Tulungagung got the city award of Adipura (annual sanitation award for cities) on the medium city category in Indonesia. However, local government is worried that the increasing waste problems in various places in Tulungagung will affect the next sanitation award. These waste problems is commonly caused by the inappropriate behavior of society on managing the waste, such as burned, littering, etc. Garbage is basically a wasted material or waste results sourced from human activity and natural processes that have no economic value, or may even have a negative economic value because of the need of treatment, either to remove or clean which requires significant costs [1-5]. Waste management is a systematic and continuous activities which includes the waste reduction [6-8]. Trash material is wasted or discarded from the source and the result of human activity and natural processes with no economic value [9, 10], even others stated that garbage is a not ready-made resource [11]. This whole time, waste management is still used the final approach, i.e. removing the generated waste in the production and consumption process directly to the landfill [12].Based on the data from the Department of Public Works, and Department of Human Settlements and Housing Services of Tulungagung in 2013, waste volume as one of the environmental quality indicator along 2010-2012 averaged of 144.190,82 m3 per year. It increased averaged to 17.29% per year (4.777,85 m3 per year). However, waste volume to be further processed is only ± 22.74% which includes 2.97% composting, 14.83% recycling and 4.94% was sorted. These data implied lacking waste management which potentially will lead to environmental damage in Tulungagung.The enactment of Law No. 18 of 2008 on Waste Management became a recent benchmark for urban waste management policy in Tulungagung. It regulate waste management on the concept of zero waste by emphasizing the importance of the community participation in waste management. Tulungagung Local Government need to formulate an urban waste management policy in addressing the waste problem especially waste of from households that have the largest contribution (66%). The purpose of this new policy is to integrate the management of household waste with all relevant institutions and become a key instrument in implementing urban waste management policy in Tulungagung.Policy implementation of the urban waste management in Tulungagung Government is emphasized more on the internal communication among relevant government agencies. Otherwise, external communication to the public is only in the form of warning billboards in certain areas such as ‘Stay Clean’, ‘Dispose Trash in its Place’, ‘No littering’, and ‘Do not Throw Trash into the River’. Tulungagung Government does not have a special program that intensively deals with the socialization of urban waste management policy to the community in the form of sustainable waste management.Therefore, this study evaluate the dominant factors that affect society's behavior towards household waste management in Tulungagung. Thus it can be used as basic consideration for improving the efforts of Tulungagung Government to solve the problem of waste management in a more effective, efficient, environmental-friendly and sustainable way.
2. Research Method
- This study used a quantitative approach with data collection method of field observation and questionnaires. This study is a cross-sectional research, which seeks the dynamics correlations between risk factors along with its impact. Risk factors and its impact were observed simultaneously, which each subject is observed once. The risk factors and the impact measured according to the state or status at the time of observation. The method of analysis used inferential analysis of PLS (Partial Least Square) mediation approach.
2.1. Study Site
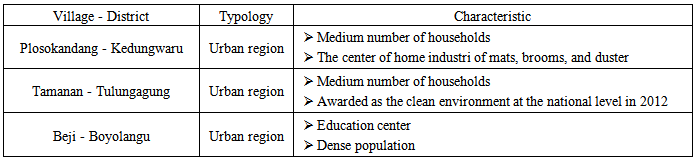
- This study conducted in three villages, namely Plosokandang, Tamanan, and Beji, in Tulungagung Regency. These three study sites are a densely populated area and have the characteristics to be achieved in this study (Table 1), which represents the area of the city (Figure 1).
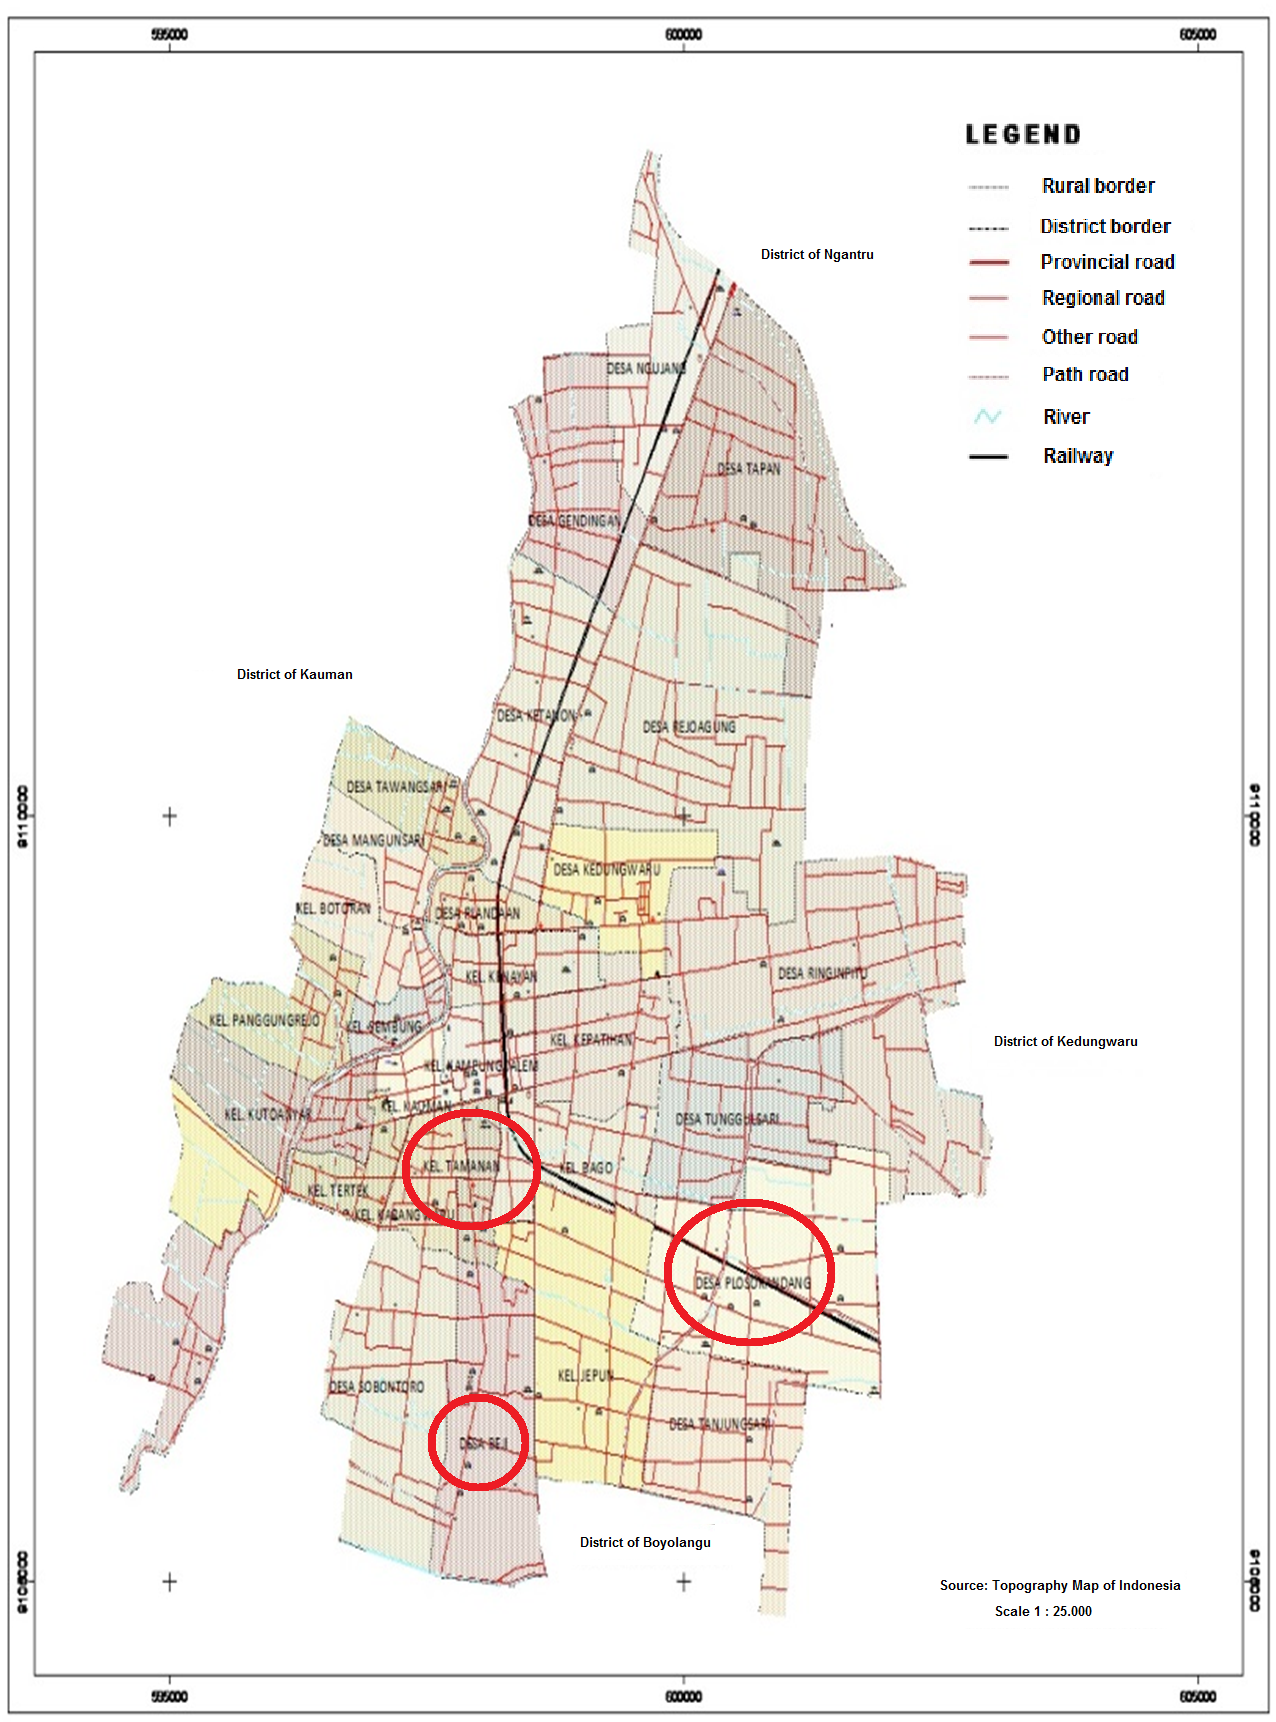 | Figure 1. Study Site; O: sampling villages. (Regional Development Planning Agency of Tulungagung, 2012) |
|
2.2. Data Collection
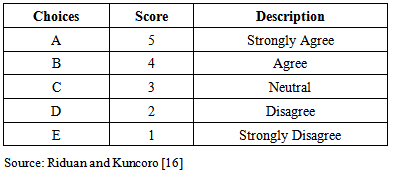
- Data were collected by using a questionnaire for respondents who are housewives at the study site. According to Solimun [13], the amount of sample equals to 5 to 10 times of all latent variables; which this study has 18 indicators. This study used a total of 270 respondents as research subjects. The respondent includes the productive housewives (25 – 45 years old). Field observation and questionnaires collection were conducted in February – March 2014.This study used Likert scale in determining the size and rates of the categories, and measured constructs distance. Singarimbun and Effendi [14] explained Likert scale measured by providing the opportunity for a respondent to answer the questions with answers that have been determined the score 1 to 5. Questionnaires in this study using five alternative answers to be selected by the respondent (Table 2). The variables in the questionnaire are knowledge, attitudes and actions; which also used in some previous research on waste management [15].
|
2.3. Validity and Reliability
- The research instrument were tested on its validity and reliability. The validity showed the accuracy of measuring instrument. This test ensuring the instrument to deliver the results in accordance to its purpose. If the correlation value is less than 0.3, it shall be declared as valid [17].
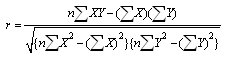 Description:r = coefficient of correlation X = the value of each question Y = total value of all the questions for one variable Reliability measure the consistency of the instruments when measured several times with the same measuring instrument. Reliability is an index that indicates the extent to which the instrument can be reliable or unreliable. Reliability test used Cronbach Alpha methods [18] in the following formula. The instrument said to be reliable if it has a reliability coefficient of ≥ 0.6 [19].
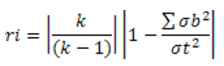 Descriptionri = the reliability of the instrument k = number of the questions Σ σb2 = sum of each variance σb2 = total variance
 2.4. Data Analysis
- This study used the analysis of Partial Least Square (PLS) approach to evaluate the dominant factors that influence the behavior of the waste management in Tulungagung City community. An assumption of linearity must be met in PLS model. Linearity assumption is the assumption that all variables were related in a linear form. Linearity test create a scatter diagram or the curve fit approach. The assumption of linearity tested by curve fit with SPSS software. Reference used the principle of parsimony, i.e. (1) a linear model is significant, or (2) when the entire probable model is insignificant. Specification of the basic model for testing is linear, quadratic, cubic, inverse, logarithmic, power, S, compound, growth and exponential model. Two of these provisions indicate that the linearity assumption is met.The goodness of fit on models in PLS assumed from the predictive relevance (Q2) value. This Q2 value is calculated based on the value of R2 of each endogenous variable. The predictive relevance (Q2) value is:Q2 = 1 – (1 – R12)(1 – R22) (1 – R32)In this study, we determined that people's behavior consists of as endogenous variables of knowledge (K), attitude (A), and action (AC), which affects waste management (WM), as shown in the following Fig. 2.
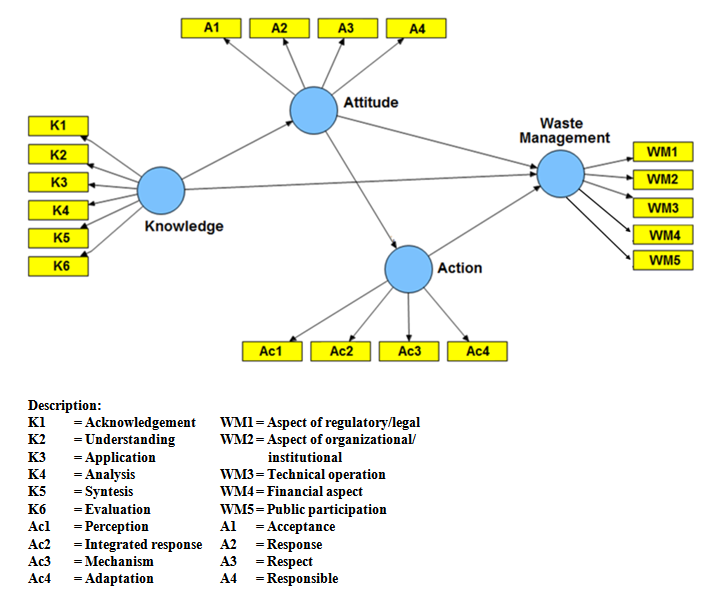 | Figure 2. Overview of City’s Society Behavior on Waste Management |
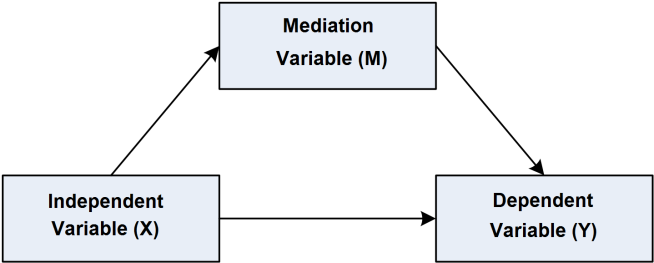 | Figure 3. Correlation of Independent, Mediation, and Dependent Variable |
3. Result
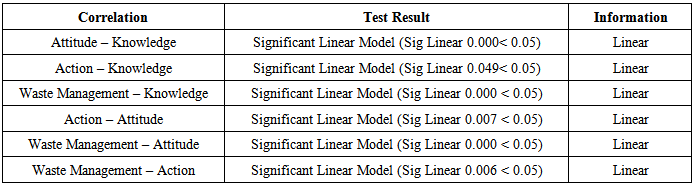
- Relationship between six variables (six hypotheses) result all significant linear models (sig p-value of the linear model < 0.05) as shown in Table 3. Therefore, the six correlation between variables in this study were qualified to be proceeded to PLS model.
|
3.1. Outer Model of Knowledge (K) Variable
- The variable of knowledge is measured using five indicators (Table 4). The fourth indicator of analysis (0.747) has the highest outer loading value which indicates that the measurement of knowledge is mainly determined by the analysis indicator (Table 4, Fig. 5). In the practices, it means that housewives as the respondents have the ability to distinguish, separate and classify waste into wet and dry waste bins. Analysis is defined as an ability to describe a material or object into components, but still in an organizational structure, and still has something to do with one another. Analysis capabilities can be viewed from the use of verbs: to describe, distinguish, separate, classify, etc [21].
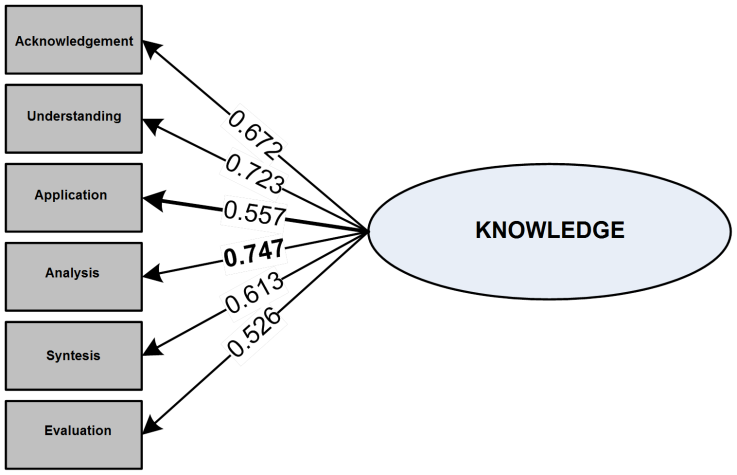 | Figure 4. Outer Model of Knowledge Variable |
3.2. Outer Model of Attitude (A) Variable
- The first indicator of Attitude, namely acceptance receives the highest loading outer value (0.960). This indicates that the primary measurement on attitude is acceptance indicator (Table 5, Fig. 6). This implied that society of Tulungagung has accepted the management of household waste that has been programmed. Attitude due to the stimulus of an object should be the attitude of response, either positive or negative response, like or dislike, agree or disagree, etc. Thus, the attitude has two possibilities, i.e. positive attitude and negative attitude toward the object.
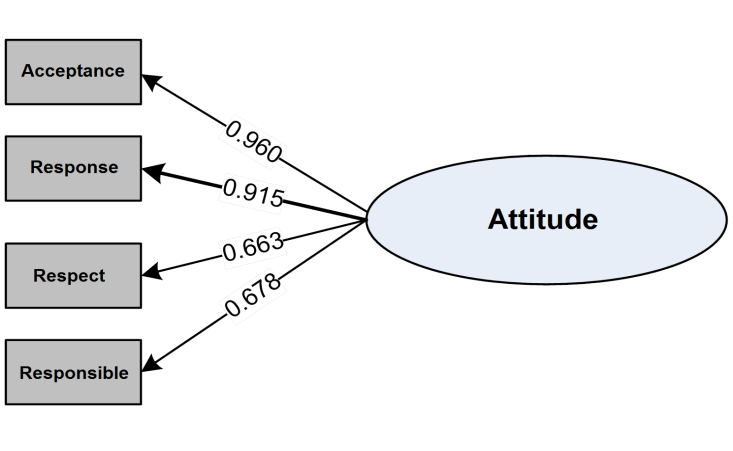 | Figure 5. Outer Model of Attitude Variable |
|
3.3. Outer Model of Action (Ac) Variable
- The third indicator, namely mechanism, has the highest value of the outer loading (0.692), indicating that the main action measurements is determined from the mechanism indicator (Table 6, Fig. 7). Mechanism is a practice or action which is already well developed. This means that the action has been modified without compromising the truth of such action. Measurement of society behavior in household waste management is done directly with the interview about the activities that have been carried out in few hours, days or months ago (recall). Measurements are also done directly, i.e. by observing the actions or activities of the respondent, which in this case is a housewife.
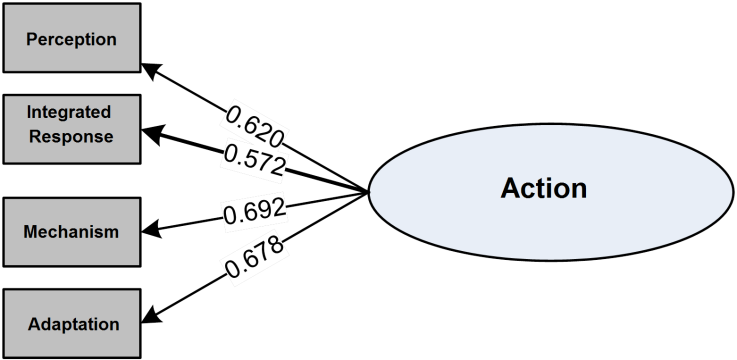 | Figure 6. Outer Model of Action Variable |
|
3.4. Outer Model of Waste Management (WM) Variable
- The indicator of technical operation has the highest value of the outer loading, indicating that the measurements of the waste management mainly determined by the technical operation (Table 6, Fig.7). The results showed that Tulungagung citizens manage their household waste by throwing it into the trash cans that have been provided outside their house. All types of waste were put together in the available trash cans; on a specific schedule, garbage worker will collect it into the wheelie bins to be discharged into container in the temporary landfill. If the containers were fully filled, it will be transported by using the garbage truck to be disposed to final landfill. While the future operational techniques of waste management proposed by Tulungagung society are to sort the waste into organic, inorganic, and hazardous waste materials and toxic garbage (B3). These three types of waste is not disposed in trash can but packaged in three different containers as follows. Organic waste is needed to be chopped (1 cm size) and put into compost basket. Inorganic waste (plastic, cans, glass, iron, etc) will be packed in specific containers, as well as B3 waste (batteries, tin container, mosquito poison, etc). Inorganic and B3 waste collected on a specific schedule to be sorted considering the possibility of recycling and reuse.
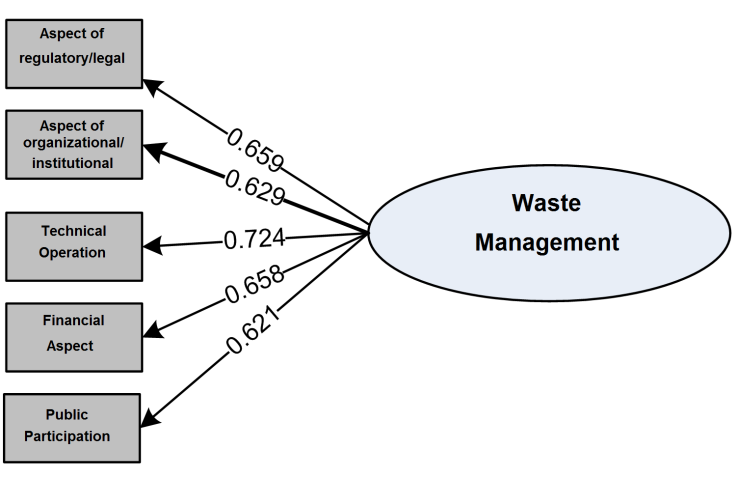 | Figure 7. Outer Model of Waste Management Variable |
|
4. Discussion
- Tulungagung society has a fairly good behavior in waste management. Factors that influence the society behavior on the household waste management are analysis, acceptance, mechanisms, and operational techniques. Most citizens have awareness on their own waste processing, although the waste management is still limited in the activities of sorting the garbage. They separate the wet and dry trash, and utilize reusable items by reselling it. Although many people analyze the waste management and its implementation, but the desire of a good waste management has not been done completely. There are piles of garbage of each home which is burned and some people choose to throw their trash in the garbage disposal in the area adjacent to the house. Behavior of household waste management is influenced by the knowledge, age and maturity level of public. For some people who do not behave well in waste management is influenced by the lack of waste transporting facilities and infrastructure in their area, thus most people burn the trash. This research study is in line with Burton et al. [34] who found that there is a significant correlation between knowledge and the society behavior in waste management. Some studies also suggest that someone with knowledge and skills shaped their attitudes. Change of behavior is absolutely impossible without knowledge and the supported material, e.g. facilities and infrastructure [25, 36-38].The strength of this study is to provide an overview of the society behavior on the household waste management. The behavior assessed from the correlation of knowledge, attitudes and actions. Thus, government would understand better improvement in the household waste management in the community. Knowledge improvement will need to be differred with attitudes improvement and so on. The respondents in this study is still limited to housewive as research subjects, whereas there are other family member such as husbands and children.
5. Conclusions
- The society behavior on household waste management in Tulungagung is fairly good. Factors that influence the society behavior of people on the household waste management is analysis, acceptance, mechanisms, and technical operation. Household waste management behavior is also strongly influenced by knowledge, age and maturity level of the society. There is a significant direct impact between knowledge and attitudes, attitudes toward action, and action toward waste management. Higher knowledge will lead to a higher attitude, a higher attitude will result in action, and the higher action will result in waste management.
ACKNOWLEDGEMENTS
- The author would like to thank: (1) The Government of Tulungagung, (2) The community of Plosokandang, Tamanan, and Beji, Tulungagung (3) Rector and the Graduate Program Director of the University of Brawijaya.
References
| [1] | Finnveden, G., 1999, Methodological aspects of life cycle assessment of integrated solid waste management systems. Resources, Conservation and Recycling, 26, 173-187. |
| [2] | Ekvall, T., Assefa, G., Björklund, A., Eriksson, O., and Finnveden, G., 2007, What life-cycle assessment does and does not do in assessments of waste management, Waste Manage., 27, 989–996. |
| [3] | Merrild, H., Damgaard, A., and Christensen, T. H., 2008, Life cycle assessment of waste paper management: the importance of technology data and system boundaries in assessing recycling and incineration, Resour., Conserv. and Recyc., 52, 1391–1398. |
| [4] | Rigamonti, L., Grosso, M., Giugliano, M., 2010, Life cycle assessment of sub-units composing a MSW Management System. J. of Cleaner Prod., 18, 1652–1662. |
| [5] | Blengini, G. A., Fantoni, M., Busto, M., Genon, G., Zanneti, M. C., 2012, Participatory approach, acceptability and transparency of waste management LCAs: case studies of Torino and Cuneo, Waste Manage., 32 (2012) 1712–1721. |
| [6] | Ackerman, F.M., 2001, Waste in the inner city: Asset or Assault?, Local Environment, 6, 133-120. |
| [7] | Bovea, M.D., and Powell, J.C., 2006, Alternative scenarios to meet the demands of sustainable waste management, Journal of Environmental Management, 79, 115-132. |
| [8] | Salhofer, S., Wassermann, G., Binner, E., 2007, Strategic Environmental Assessment as an approach to assess waste management systems: Experiences from an Austrian case study, Environmental Modelling and Software, 22, 610–618. |
| [9] | Suprihatin, 1999, Concept of environmental education and Wall Chart: A manual of environmental education. PPPGT/VEDC, Malang. ISBN: 978-104058-5846-5. |
| [10] | Damanhuri, E., Widyarsana, I.M.W., Sembiring, E., 2006, Updating recycling potential in Bandung as a basis for 3Rs Management, Bandung Institute of Technology (ITB), Bandung. |
| [11] | Wilson, D. S., 2007, Social semantics: toward a genuine pluralism in the study of social behaviour. J. Compilation, Eur. Soc. for Evol. Biol., 21, 368 – 373. |
| [12] | Djajanegara, S., 2004, Assessment of waste management in West Java, Research and Development Agency of West Java Province, Bandung. |
| [13] | Solimun, 2011, Testing for mediation variable: what necessary? International Conference of Basic Science, Faculty of Mathematics and Natural Sciences, University of Brawijaya. |
| [14] | Singarimbun and Efendi, 1995, Survey Research Method, LP3ES, Jakarta. |
| [15] | Wilson, D.C, Velis, C, Cheeseman, C., 2006, Role of informal sector recycling in waste management in developing countries, Habitat International, 30, 797–808. |
| [16] | Riduwan and Kuncoro, 2007, Manual and interpretation of Path Analysis, Alfabeta, Bandung. |
| [17] | Sugiyono, 2007, Quantitative and qualitative research method, and Research and Development, Alfabeta, Bandung. |
| [18] | Arikunto, S., 2006, Research procedure of practical approach, Revision VI, PT Rineka Cipta, Jakarta. |
| [19] | Arikunto, S., 2002, A research procedure: practical approach, Fifth Rev., PT Rineka Cipta, Jakarta. |
| [20] | Indriantoro, N., Supomo, B., 2009, Research methodology of business, 2nd Ed., BPFE, Yogyakarta. |
| [21] | Irvine, R.J., Fiorini, S., Yearley, S., Mcleod, J.E., Turner, A., Armstrong, H., White, P.C.L., and Wal, R.V.D., 2009, Can managers inform models? Integrating local knowledge into models of Red Deer Habitat Use, Journal of Applied Ecology, 46, 344–352. |
| [22] | Tobin, K., and Roth, W. M., 2007, Identity in science: What for? Where to? How? In Roth, W. M., Tobin, K., (Eds.), Science, learning, and identity: Sociocultural and cultural-historical perspectives, NL: Sense Publishing, Rotterdam. |
| [23] | Brown, B., 2004, Discursive identity in science classroom, Journal of Research in Science Teaching, 41, 810-834. |
| [24] | Carlone, H., and Johnson, A., 2007, Understanding the science experiences of successful women of color: Science identity as an analytic lens, Journal of Research in Science Teaching, 44, 1187-1218. |
| [25] | Notoatmodjo, 2003, Education and health attitude, Rineka Cipta, Jakarta. |
| [26] | Fishbein, M., and Ajzen, I., 1975, Belief, attitude, intention and behavior: An introduction to theory and research, Reading, MA, Addison-Wesley. |
| [27] | Lindsay, J.J., and Strathman, A., 1997, Predictors of recycling behaviour: an application of a Modified Health Belief Model, Journal of Applied Social Psychology, 27, 1799-1823. |
| [28] | Sutton, S., 1998, Predicting and explaining intentions and behavior: how well are we doing? J. of Appl. Soc. Psychol. 28, 1317–1338. |
| [29] | Littell, J.H., and Girvin, H., 2002, Stages of change: A critique, Behaviour Modification, 26, 223-273. |
| [30] | Heimlich, J. E., and Ardoin, N. M., 2008, Understanding behavior to understand behavior change: a literature review. Environ. Edu. Res., 14, 215-237. |
| [31] | Osbeck, L. and Nersessian, N., 2006, The distribution of representation, J. for the Theor. of Soc. Behav., 36(2), 141-160. |
| [32] | Osbeck, L. M., 2010, Forms of positioning in interdisciplinary science practice and their epistemic effects, The J. for the Theor. of Soc. Behav., 40, 136-161. |
| [33] | Harré, R., Moghaddam, F., Cairnie, T. Rothbart, and Sabat, S., 2009, Recent advances in positioning theory, Theor. and Psychol., 19 (1), 5-31. |
| [34] | Burton, M., Marsh, S., and Patterson, J., 2007, Community attitudes towards water management in the Moore Catchment, Western Australia, Agr. Syst., 92, 157–178. |
| [35] | Ferreira, S., and Gallagher, L., 2010, Protest responses and community attitudes toward accepting compensation to host waste disposal infrastructure, Land Use Pol., 27, 638–652. |
| [36] | Sharp, V., Giorgi, S., and Wilson, D. C., 2010, Methods to monitor and evaluate household waste prevention. Waste Manage. and Res., 28, 269–280. |
| [37] | Cox, J., Giorgi, S., Sharp, V., Strange, K., Wilson, D. C., and Blakey, N., 2010, Household waste prevention – a review of evidence, Waste Manage. and Res., 28, 193–219. |
| [38] | Slagstad, H., and Brattebø, H., 2012, LCA for household waste management when planning a new urban settlement, Waste Manage., 32, 1482–1490. |