American Journal of Sociological Research

p-ISSN: 2166-5443    e-ISSN: 2166-5451

2013;  3(2): 36-45

doi:10.5923/j.sociology.20130302.04

Child Poverty in Uganda: Analysis of the UNHS 2009/2010 Survey

Gideon Rutaremwa

Center for Population and Applied Statistics, Makerere University, Uganda

Correspondence to: Gideon Rutaremwa, Center for Population and Applied Statistics, Makerere University, Uganda.

Email:

Copyright © 2012 Scientific & Academic Publishing. All Rights Reserved.

Abstract

Understanding the extent and characteristics of child poverty in Uganda is vital for policy and programs aimed at addressing it. In addition, child poverty eradication would lead to all children enjoying their rights, reaching their full potential and to participating as full members of society. Data used in this study were from the Uganda National Household Survey – 2009/2010. Although this was a national survey covering 6,800 households, this paper utilizes data from 20,045 children of age18 years and younger, to provide analyses of child poverty in Uganda. In the analysis, three logistic regression models were estimated, predicting the odds of a child being severely deprived of education and health and finally falling below the poverty line. Child poverty was conceptualized both in its narrow definition to imply resource deprivation terms and was measured in relation to the proportion of children severely deprived of basic human needs including: education and health. On the other hand, the poverty line definition was adopted and used. The study shows that the proportion of children living below the poverty line was higher compared to the national average. In addition regional differences existed in the level of poverty: severity of education and health deprivation. The number of persons living in the household where a child was resident was directly associated with the likelihood of a child being poor. Other factors affecting the level of poverty among children included; rural-urban residence and sex of child.

Keywords: Child, Poverty, Uganda, National Household Survey

Cite this paper: Gideon Rutaremwa, Child Poverty in Uganda: Analysis of the UNHS 2009/2010 Survey, American Journal of Sociological Research, Vol. 3 No. 2, 2013, pp. 36-45. doi: 10.5923/j.sociology.20130302.04.

1. Introduction

Poverty is a condition usually characterized by a severe deprivation of basic human needs[1]. It is estimated that one third of all children in developing countries (approximately 674 million) are living in poverty, the highest rates being in the rural areas of Sub-Saharan Africa and South Asia (over 70%). Children are often viewed as having no personal responsibility for their own economic situation and since the negative consequences of child poverty for both the individual and society may be quite large[2][3][4]. Given these perspectives, therefore, child poverty has often been viewed in the broader spectrum of child protection. However, this is a difficult and complex area in social work practice and the decisions made by social workers and other practitioners may have a significant effect on the well-being of children and their families[5].
Studies related to poverty often subsume children within the poverty categories most often referred to such as households, communities and people. The latter implies that there is a high tendency to focus on adult-related poverty while child poverty is ignored, partly because children have little power and influence within a group that contains adults. Poverty in the household often has far reaching impacts on the welfare and security of children. For example, much has been written about the relationship between socioeconomic status and child abuse and neglect. It is well documented that children from poor families are overrepresented in the child welfare system[6]. Poverty is an important factor in child protection caseloads in other countries as well. In their discussion of ecological factors in child abuse and neglect in the UK Spencer and Baldwin[7] identify the strong correlation between poverty, low income and child maltreatment. They referred to a study by[8], who found that 57 per cent of children in their sample had no wage-earner in the household. In the USA, researchers[9] in their analysis of the child welfare data in Missouri, found that the critical variable for children coming into care was poverty.
A few studies written about child poverty in Uganda have come up with, some conclusions concerning the role of social protection programs, mechanisms for addressing child poverty including community and local level interventions and the need for a research agenda all geared at reducing child poverty[10]. In a related study by[11] on children in abject poverty in Uganda suggests simple criteria for recognizing children in abject poverty, as opposed to a sophisticated one. They add that top on the list should be absence of basic necessities such as shelter, food, clothing and water. However, equally important are the ‘human condition’ in terms of physical health and parental care and protection. The latter observations resonate well with similar studies in both developed and developing countries[12][13].
The dynamics of child poverty have important policy implications, notably, chronic poverty may call for a different policy response than temporary poverty, and the identification of key negative events that consistently push children into poverty may signal undesirable weaknesses in the public safety net[13]. Furthermore, by following children (and their families) over time, we can determine whether policies should, perhaps, be tailored according to the age of the child, since most families have a particular income and career life-cycle pattern. Thus, information about the dynamics of child poverty may help us construct more salient policies for fighting child poverty.
The purpose of this paper is to contribute to the understanding of child poverty in Uganda by using data from the Uganda National Household Survey - (UNHS 2009/2010) to provide basic results concerning the child poverty among the Ugandan population. The use of the UNHS 2009/2010 data is very useful, among others, for the study of child poverty, because this survey was nationally representative. By providing adequate information on households and individuals in these households, the data offers a useful opportunity for analysis of child poverty in the country, which impacts on their capacity to overcome difficulties. This study is important because children under 18 represent the largest group of the poor in Uganda[10]. Besides, child poverty, to-date, has not been adequately incorporated in the many poverty analyses which have been carried out. First, we examine the framework with which we approach child poverty and how UNHS 2009/2010 survey data documents child poverty. Then, we shall analyse these data to illustrate the case for Uganda, and discuss the results obtained.

2. The Dimensions of Child Poverty

Throughout this paper, we use deprivation as opposed to income-based measures of poverty other measures based on expenditures and/or consumption. There are several good reasons for this, but more importantly, this aspect captures the severity, intensity and contextualized nature of children’s experiences of impoverishment with regard to their material conditions and access to basic services[14]. Children living in poverty are invariably deprived of nutrition, water and sanitation facilities, access to basic health-care services, shelter, education, participation and protection. It is most threatening and harmful to children, leaving them unable to enjoy their rights, to reach their full potential and to participate as full members of the society[15].
The DEV child poverty framework[14] posits that child poverty is composed of three dimensions: Deprivation, Exclusion and Vulnerability, which together capture the broad spectrum of experience of child poverty. This paper will be concerned with only one segment of this framework, the deprivation dimension of child poverty.
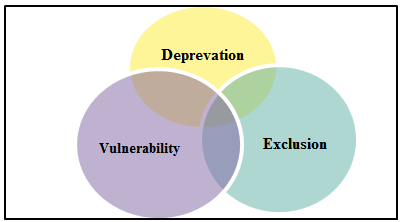
Figure 1. The DEV Child Poverty Framework[14]
Central to the framework presented in Figure 1 is that each of the three dimensions depicted above can be used to capture the complexity of children’s experience of poverty - in this paper deprivation has been used. However, it should be noted that Figure 1 is designed to illustrate not only the areas of conceptual overlap and interrelation among the three, but also to illustrate the importance of incorporating all three dimensions for a more holistic appreciation of children’s experiences. Furthermore, while many children will undoubtedly fall into the darker central area this does not necessarily mean that they are ultimately any “more” impoverished than those outside – rather, that they are simply experiencing elements from each dimension simultaneously. The authors of the framework acknowledge that the three dimensions of deprivation, exclusion and vulnerability are strongly interrelated and may act to mutually reinforce each other. The “Deprivation” dimension of child poverty should be understood as denoting the lack of material conditions and services generally held to be essential to the development of children’s well-being. These may include (but are not limited to) the following: food, health, safe drinking water, shelter, sanitation facilities and education. As earlier mentioned, the basic physical needs are essential to survival and growth in all children, and must be given due weight and consideration when developing targeting methodologies and interventions.
For most children, the experience of deprivation is highly dynamic and varied, characterized by moving in and out of critical periods during which they are less able to meet one or more of their basic needs. These periods are often linked to seasonal fluctuations, and may relate to failed harvests, or the prevalence and spread of disease through monsoon and winter climates. However, for a significant number of children, the experience of deprivation is one of unchanging and grinding want. They form part of populations that are variously referred to as the “poorest of the poor,” the “ultra-poor” or the “destitute,” and struggle with the weight of hunger, illness, weakness and desperation on a daily basis[14]. Children in these circumstances are often likely to suffer serious adverse consequences with regard to their health, well-being and general development.
In Figure 1, the Exclusion dimension of child poverty looks at the processes through which individuals or groups of children are wholly or partially marginalized from full participation in the society in which they live. Exclusion differs from deprivation in that while the latter focuses on a lack of basic necessities, exclusion focuses on the broader processes that contribute to this lack. It is also strongly relational in nature, and is one of the most immediate ways in which children experience poverty. Children can be excluded for many different reasons, by many different kinds of people (including other children) and in many different ways. It may be the direct result of who a child is (e.g., racial/ethnic discrimination) or the indirect consequence of the child’s association with others (e.g., social stigma against the child of a parent with HIV/AIDS). Besides, it can take place in both formal (e.g., school) and informal (e.g., family) environments, from the moment a child is born through childhood, adolescence and sometimes the entire adult life. The frequently intangible nature of social stigma in particular can also make it very difficult for outsiders to perceive, let alone target. Exclusion, therefore, is the most common and often the most deeply felt form of exclusion experienced by impoverished children, who are particularly sensitive to how their appearance or social status affects their immediate relationships with family and friends.
Finally the framework in Figure 1 alludes to vulnerability - this dimension of child poverty addresses the dynamic nature of children’s experience of poverty in terms of how they are affected by, or resilient to, the array of changing threats in their environment. Understanding vulnerability is therefore a question of tracking the dynamics of poverty over time, and examining how this relates to the factors that lift children in and out of impoverishment. The concept has a dual aspect, incorporating, first, the external threats to well-being, and second, internal risk management and coping capability. External threats may include large forces such as HIV/AIDS, conflict, market collapse and natural disasters, as well as more localized threats such as domestic violence, crime, job loss, sickness or the death of a parent. Internal risk management and coping capability is also dependent on a number of factors, including access to services/assets, the socio-political context and, most importantly, the resilience of the individuals themselves.

3. Data and Study Context

In this study, we use data from the Uganda National Household Survey - UNHS 2009/2010, which allows us to track the individual child record within the household. The UNHS 2009/2010 is part of a series of household surveys that started in 1989 in Uganda. The survey collected information on socioeconomic characteristics both at household and community levels as well as information on the informal sector. The main objective of the survey was to collect data on population and socioeconomic characteristics of households for monitoring development performance.
The economic characteristics and household structure are used in this paper only to account for part of the daily life of children who are often affectively and economically linked to other neighboring households. The household, on which these results are based, represents the visible part of a wider social system that certainly deserves to be better understood[16][16][17] and that would necessarily have to be taken into account to have a full view of child poverty, no doubt, poverty does not stop children from hoping, nor does it prevent them from enjoying certain other aspects of their lives, their household and communities[14].
Nevertheless, the analysis in this study hinges on the basic hypothesis that the household is a relevant unit for studying the living conditions of children. Comparable definitions of the household lead to comparable data. Even though data procedures have a tendency of defining the household as the smallest unit in any ambiguous case[18], this unit obviously cannot capture the entirety of the social network around a person; it provides information on the closest persons around the child. This physical proximity should not overshadow the quality and intensity of other relationships in a broader social network, like relatives sending remittances or visiting regularly, yet it actually accounts for daily contacts and potential care in case of event of threat. We therefore assume that living together provides more physical and emotional support than mere physical proximity, a frequently used starting point[19][20].
Another limitation of the use of household characteristics to assess the immediate contact circle on which a child can rely is its flexibility over time. The image of domestic structures given by cross-sectional demographic surveys is a fixed image, while household structure changes over time and adjusts according to needs and opportunities[21]. The purpose of this study is partly to point out situations where issues related to child poverty are evident. In order to measure absolute poverty amongst children, it is necessary to define the threshold measures of severe deprivation of some basic human needs for: food, safe drinking water, sanitation facilities, health, shelter, education, information and access to services. Figure 2 presents the continuum of deprivation.
Figure 2. The Continuum of deprivation[22]
In this study, deprivation is conceptualized as a continuum, which ranges from no deprivation through mild and moderate deprivation to extreme deprivation. The following are the operational definitions of severe deprivation of basic human needs for children adopted[22] in this study:
1) Severe Nutrition Deprivation– severely malnourished children whose heights and weights were more than 3 Standard Deviations below the median of the international reference population e.g. severe anthropometric failure.
2) Severe Water Deprivation - children who only had access to surface water (e.g. rivers) for drinking or who lived in households where the nearest source of water was more than 30 minutes round trip away (e.g. indicators of severe deprivation of water quality or quantity).
3) Severe Deprivation of Sanitation Facilities – children who had no access to a toilet of any kind in the vicinity of their dwelling, e.g. no private or communal toilets or latrines.
4) Severe Health Deprivation – children who had not been immunized against any diseases or young children who had a recent illness and had not received any medical advice or treatment.
5) Severe Shelter Deprivation – children in dwellings with five or more people per room (severe overcrowding) or with no flooring material (e.g. a mud floor).
6) Severe Education Deprivation – children aged between 7 and 18 who had never been to school and were not currently attending school (e.g. no professional education of any kind).
7) Severe Information Deprivation – children aged between 3 and 18 with no access to newspapers, radio or television or computers or phones at home.
8) Severe Deprivation of Access to Basic Services – children living 20 kilometres or more from any type of school or 50 kilometres or more from any medical facility with doctors.
Unfortunately, this kind of information is rarely available for a few countries so it has not been possible to construct accurate regional estimates of severe deprivation of access to basic services. Only two indicators of deprivation, namely severe education deprivation and severe health deprivation were examined in this study. The study first addresses descriptive analysis in order to compare the characteristics of children across the different individual and socioeconomic factors including: age, sex of child, region, residence, school attendance, household size, poverty status and most important source of earnings for the household, among others At the second stage of analysis, three logistic regression models are estimated predicting three outcomes: 1). The log-odds of a child being severely education deprived; 2). The log-odds of a child being severely health deprived; and 3). The log-odds of a child being poor (falling below the poverty line). In all the three models control variables were added to account for either mediation or confounding effects of these variables. Formally, these equations may be expressed as follows:
(1)
Where logit[P(Y=1)] refers to the natural log odds that a respondent will: be severely education deprived (Table 5), severely health deprived (Table 6), or be below the poverty line (Table 7); β0 refers to the intercept of the regression model; and βjXj refer to regression estimates for the set of explanatory variables (numbered 1 through k) included in each of these models.

4. Results and Discussion

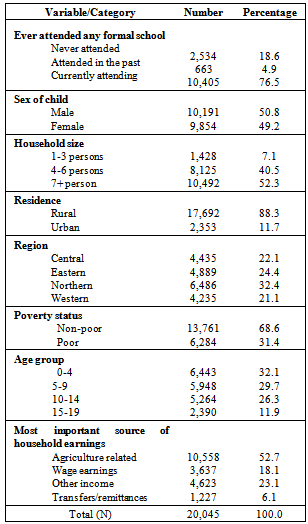
The analysis starts with presentation of the characteristics of the children below the age of 18 as presented in Table 1.The descriptive statistics presented in Table 1 suggest that nearly one fifth of the children (18.6%) had never attended school this proportion does not vary significantly among boys and girls. Similarly slightly more than three quarters (76.5%) of the children less than 18 years of age were currently attending school. The study population comprised 51% male and 49% female. Given the broad base structure of the Ugandan population, the majority of the children were of ages below 10 years (62%).
In terms of residential characteristics the findings presented in Table 1 show that 88% of the children were from rural households, with only about 12% urban. The regional distribution indicates that the Northern region of the country was fairly better represented in the sample (33.4%) compared to other regions and that Western Region which had the least numbers comprised only 21% of the study population. Given that the majority of the children hailed from rural areas where household sizes are large, the majority of children belonged to households of seven (7) and more persons (52.2%). Only 7% of the children were from small households of less than four children.
Table 1. Percentage distribution of children below age 18 by selected characteristics
     
The descriptive results presented in Table 1 also suggest that 31% of the children were from poor households, implying that these individual children were living below a daily threshold of one dollar. The absolute poverty line defined by Appleton[23], is obtained after applying the method of Ravallion and Bidani[24] to data. As Uganda Bureau of Statistics[25] clearly indicates, this method focused on the cost of meeting caloric needs, given the food basket of the poorest half of the population and some allowance for non-food needs. Given that there is a strong element of judgment and discretion when setting a poverty line, attention should not be given to the numerical value of any single poverty statistic. However, the latter percentage of poor children is far above the national estimate of the population living in poverty as estimated at 24.5%. Concerning the most important source of livelihood for the household, the majority (52.7%) depended on agriculture related sources.
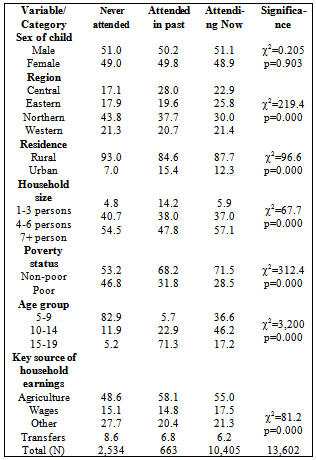
Table 2. Relationship between School attendance status and selected characteristics
     
The bivariate relationship between ever attending formal schooling and some selected characteristics is presented in Table 2. The findings suggest that there exist no child sex differences in access to education by children below the age of 18. However significant regional differences in ever-attended school were observed. Similarly, the results show significant rural-urban variations in children’s school attendance. Household size appears to be a significant factor associated with children school attendance and non-attendance. As expected, household poverty, household size, most important source of earnings, region of residence, rural-urban residence status and age of child were equally identified as significantly associated with school attendance outcomes among children, hence education deprivation outcomes.
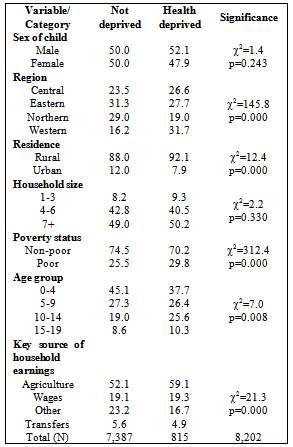
Table 3. Relationship between health deprivation status and selected characteristics
     
Table 3 presents findings for the bivariate association between severe health deprivation and some selected characteristics of the children. The findings suggest that the sex of child and household size were the only variables not significantly associated with health deprivation of the child. However, Table 3 shows that there was a highly significant association between a child’s health deprivation and the region the child hailed from. Given that the northern region of the country has been undergoing decades of civil war, the expectation is that children in this part of the country would be severely health deprived compared to those children from other regions of the country. This latter relationship will be explored further using regression procedures in order to examine the pattern of this relationship.
The findings also suggest that there was a significant rural-urban association with health deprivation of children. Furthermore, there was a significant association between the children’s age the health deprivation variable. Since the most important source of earning for the household is probably related to the household level of income, it is envisaged that there are significant differences in health deprivation due to varying earning sources. In this regards a significant association was observed between household most important source of earning and health deprivation indicator. Finally, the findings presented in Table 3 show that there was a similar significant relationship between the poverty indicator and children’s health deprivation. The expectation was that children who are from poor household would at the same time be more health deprived compared to their counterparts who hailed from non-poor households. As earlier mentioned these bivariate relationships will be further analyzed using regression procedures in order to determine the pattern of the association between these variables and the children’s health deprivation.
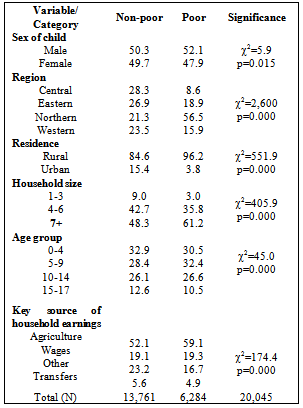
Table 4 shows the bivariate results of the relationship between poverty as measured by the cost required to meet the caloric food needs of the household. In the UNHS 2009/10 data a variable exists categorizing households that spent less than what was necessary to meet these caloric requirements as poor. Based on this description, the selected variables, namely sex of child household size, region, rural-urban residence, and age of child and most important source of household earnings were all significantly associated with this particular poverty indicator.
Table 4. Relationship between poverty status and selected characteristics
     
According to Uganda Bureau of Statistics[25], the proportion of Ugandans that lived in households below the poverty line was about one quarter (24.5%). However among children age below 18 years, as high as 31.4% of the children lived in poor households. This clearly suggests that poverty appears to be more concentrated among household with children. Analysis in the next section of this paper will therefore attempt to provide some further insights into the profile of poverty among Ugandan children. Specifically, this paper will make an attempt to examine the population groups that are most affected by such poverty as defined. The findings related to this latter measure of poverty are presented in Table 7 in the multivariate analysis section of this paper.

5. Multivariate Analysis

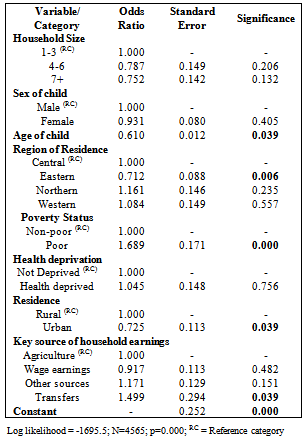
This section presents findings from the regression analyses where first the two forms of deprivation: severe education deprivation and severe health deprivation are examined. The second sets of results pertain to the variable poverty, defined as households who lived below the minimum daily caloric requirements as presented in Table 7. The findings presented in Table 5 show that only a few variables was significantly associated with education deprivation among children in Uganda. Notably household size and sex of child were not significant in the regression models. However, a significant association was observed between age of child and education deprivation. The log-odds of a child being severely education deprived were inversely related to the age of child (OR=0.610; p=0.039). The latter implies that as children grow older their likelihood of being enrolled in school tends to increase.
The results in Table 5 show that each unit increase in the age of the child was associated with a 35% reduction in the odds of the child being severely education deprived. The implication for this finding is that as children grow older, they are more likely to enrol in school. This can be attributed to the existing government sponsored universal primary education (UPE) and universal secondary education (USE) programs, which among other issues tend to promote school enrolment among children. Concerning region of residence, the likelihood of a child being severely education deprived reduced significantly (OR=0.712; p=0.006) if the child was from the Eastern region of the country compared to the Central region. However, there was no significant difference in severe education deprivation between western, Northern and Central regions of Uganda. The seemingly low severe education deprivation in Eastern region compared to Central region can partly be attributed to the socioeconomic and political dynamics in these various parts of the country that are either supportive or otherwise negative. The findings in Table 5 further suggest that children from “poor” household were as expected more likely to be severely education deprived compared to those from non-poor households. The results show that the odds of a child from poor household being severely education deprived were twice as much compared to those of a child from a non-poor household (OR=0.524; p=0.000). This finding is particularly disturbing and implies that even with free education under the UPE program; still the poor cannot access education. Furthermore, the results suggest that children residing in urban areas had reduced odds of being severely education deprived compared to those from rural areas (OR=0.725; p=0.039). Finally, it appears that children from households where the most important source of earning was from the transfers including remittances, had increased log odds of being severely education deprived (OR=0.405; p=0.039). If this latter result is not a mere artefact of data, then it presents a contrary view to the theory of “economics of new migration”. Concerning children’s education, the argument often put across is that transfers and remittances ably contribute to significantly financing education of children in the remittance receiving households.
Table 5. Logistic regression predicting the odds of a child being severely education deprived
     
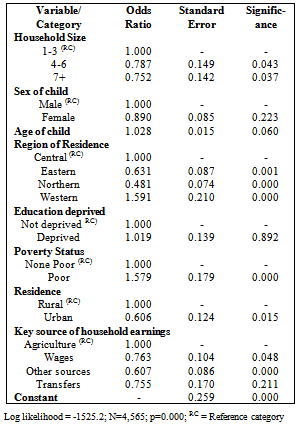
The results in Table 6 show the log-odds of a child being severely health deprived. The findings concerning household size show that the odds of a child being severely health deprived reduced with increasing size of the household. Whereas the expectation would be that a large family size would impact negatively on the health of its members, the current findings seem to suggest the contrary. The results in Table 6 further show that all the coefficients for region of residence were significant in the logistic regression models estimated.
Two regional patterns seem to emerge from the current findings, first the log-odds of children’s severe health deprivation significantly reduced in Eastern and Northern regions of the country compared to central region. The second pattern is exhibited by Western region, where the log-odds of children’s severe health deprivation significantly increased compared to central region (OR=1.591; p=0.000). These significant regional variations in severity of child health deprivation are perhaps a manifestation of the existing differences in access to the health resources. The seemingly privileged position of Northern and Eastern regions of the country relative to central region could be due to the influence of war recovery programmes, which among other activities target to improve access to health. The findings would therefore seem to imply that Western region is less privileged in terms of access to health resources. As expected, the findings in Table 6 also show that being in a poor household significantly increased the log-odds of a child’s being severely health deprived (OR=1.579; p=0.000).
Table 6. Logistic regression predicting the odds of severely health deprived among children
     
The results presented in Table 6 further show that residence in urban areas significantly reduced the log-odds of being severely health deprived among children (OR=0.606; p=0.015). This can once again be attributed to the issue of accessibility to health resources in urban areas, which tend to be more privileged, compared to the rural areas. Finally, the findings presented in Table 6 concerning the most important source of earnings shows that children hailing from households whose earnings source is agriculture related were more severely health deprived compared to those in other categories.
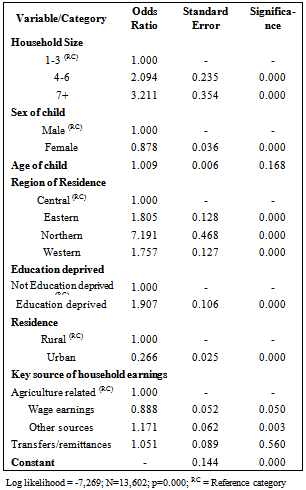
In the final model (Table 7), the purpose was to explore the factors associated with child poverty, specifically, the model attempts to predict the log-odds of a child falling below the poverty threshold (the poverty line). The explanatory variables examined include: household size, sex of child, age, region of residence, education deprivation, rural-urban residence status, and the most important source of earning for the household.
Table 7. Logistic regression model predicting the odds of a child being from a poor household
     
Concerning household size, the findings in Table 7 show that there was a direct relationship between household size and the log-odds of a child being poor. Compared to children from households of between 1 and 3 persons those from household of between 4 and 6 persons experiences twice as much the odds of being poor (OR=2.094; p=0.000). Similarly, children from household of more than 6 members experienced more than three times the log-odds of being poor compared to smaller households of between 1 and 3 persons (OR=3.211, p=0.000). As noted earlier, given the low income country context, large families are often associated with increased household consumption expenditure compared to smaller size households. The findings also show that female children experienced reduced odds of being poor compared to their male counterparts (OR=0.878; p=0.000). These gender differences though unexpected among children below the age of 18 could be a reflection of the varying levels of expenditure as well as the costing of items used by boys and girls.
Again all regional coefficients were highly significant in the regression model, and were suggestive higher odds of children being from poor households in all regions of the country compared to Central region. The log-odds of a child being from a poor household were highest in Northern region of Uganda (OR=7.191; p=0.000) compared to Central region, this was followed by Eastern region and Western region, respectively. These findings are consistent with other related findings that suggest that the proportion of the population that lived in poverty in Northern Uganda was 46.2 percent, which was far above the National average of 24.2 percent as noted earlier[26].
The findings also show that the odds of a child being from a poor household increased nearly twice (OR=1.907; p=0.000) when the child was education deprived. This is expected, given the strong relationship between the two variables, education and poverty. Rural-urban residence was also highly significant in the regression model. The findings show that residence in urban areas significantly reduced the log-odds of a child being poor compared to residence in rural areas (OR=0.266; p=0.000). There is evidence to suggest that on average the urban areas enjoy more favorable living conditions than peri-urban areas and rural areas[27][28][29]. Therefore, one of possible explanations for the rural urban differences in poverty levels could be the relative differences in access to resources and opportunities for a better livelihood.
Finally, concerning the most important source of earning for the household, the findings show that children from households where wage earnings were the most important source experienced reduced log-odds of poverty (OR=0.888; p=0.050) compared to those in agriculture related sources. Furthermore, those from households who’s most important source of earning were other non-agricultural sources experienced higher log-odds of being poor (OR=1.171; p=0.003) compared to those with agricultural related sources. It seems apparent that on average wage earnings are far more important than either agricultural or other non-agricultural sources, probably because wage incomes usually more stable.

6. Conclusions

Given that this study is an initial attempt to explore the factors associated with child poverty in Uganda, it is difficult to make clear policy recommendations at this point. However, a few policy implications emerge from this study and can be confirmed by additional research. First, the proportion of children living in poverty is higher than the national average. This suggests that targeted programmes aimed at up lifting the conditions of children should be put in place. Such programmes should focus on children who come from poor rural households. In terms of severe education deprivation, Eastern region should be the region of focus, while Western region and Central regions should be the focus for regions of health interventions among children under 18 years.
Second the analyses suggest that children who live in households with more persons are more disadvantaged and are particularly at risk of being poor. Public campaigns and social policies designed specifically to promote a small family size norm could prove effective in reducing poverty among households and among children ultimately. Such interventions could target households whose main sources of livelihood are agricultural related earnings. Invariably most such households are found in the rural settings of the country.
Third, the investigation found that the boy children are more likely to be poor compared to their female counterparts. However, this finding was not conclusive, given that the analysis in this study did not find female children to be better off when it came to severe education and health deprivation. Further research is therefore necessary to make this determination and also to account for the other indicators of poverty among children that were not captured in the data set used in this study, the UNHS 2009/2010.
Finally, an improved understanding of issues related to child poverty would go a long way in improving the social policies, ultimately reducing child poverty and otherwise deprivation of various needs among children including health and education. Future investigations could also address other components of child poverty such as sanitation, shelter, nutrition, information and access to basic services. Therefore, replicating and expanding studies of this nature could be a useful contribution for future research.

ACKNOWLEDGEMENTS

The author would like to thank the French Institute for Research in Africa (IFRA) for the financial support under the ANR EVEPJVAE project that enabled the preparation of this paper.

References

[1]  United Nations, “The Copenhagen Declaration and Programme of Action: World Summit for Social Development 6-12 March 1995,” New York, 1995.
[2]  G. J. Duncan and J. Brooks-Gunn, Eds., The consequences of growing up poor. New York: Russel Sage Foundation, 1997.
[3]  D. T. Lichter, “Poverty and inequality among children,” Annual Review of Sociology, vol. 23, pp. 121–145, 1997.
[4]  K. Vleminckx and T. . Smeeding, Child well-being, child poverty and child policy in modern nations: what do we know?, Second. Bristol: The policy Press, 2001.
[5]  J. Stokes and G. Schmidt, “Race , Poverty and Child Protection Decision Making,” no. January, pp. 1105–1121, 2011.
[6]  R. Jonson-Reid, B. Drake, and P. Kohl, “Is the overrepresentation of the poor in child welfare caseloads due to bias or need?,” Children and Youth Services Review, vol. 31, pp. 422–427, 2009.
[7]  N. Spencer and N. Baldwin, Economic, cultural, and social contexts of neglect’, in J. Taylor and B. Daniel (eds), Child Neglect: Practice Issues for Health and Social Care. London: Jessica Kingsley Publishers, 2005.
[8]  J. Thoburn, J. Wilding, and J. Watson, Family Support in Cases of Emotional Maltreatment and Neglect. London: The Stationery Office, 2000.
[9]  B. Drake, S. Moo Lee, and M. Jonson-Reid, “Race and child maltreatment reporting: Are Blacks overrepresented?,” Children and Youth Services Review, vol. 31, pp. 309–316, 2009.
[10]  S. Witter, “The silent majority: Child Poverty in Uganda The silent majority: Child poverty in Uganda The silent majority: Child poverty in Uganda,” 2002.
[11]  UNESCO, MFPED, and MOES, “Children in Abject Poverty in Uganda: A Study of criteria and status of those in and out of school in selected districts in Uganda,” Paris, 2005.
[12]  V. Morrow and K. Pells, “Integrating Children’s Human Rights and Child Poverty Debates: Examples from Young Lives in Ethiopia and India,” Sociology, vol. 46, no. 5, pp. 906–920, Oct. 2012.
[13]  M. J. Lindquist and G. Sjögren Lindquist, “The dynamics of child poverty in Sweden,” Journal of Population Economics, vol. 25, no. 4, pp. 1423–1450, Mar. 2010.
[14]  D. Wordsworth, M. McPeak, and T. Feeny, “Understanding Children’s Experience of Poverty: An Introduction to the DEV Framework.” Richmond, Virginia, 2005.
[15]  N. Jones and A. Sumner, Child Poverty, Evidence and Policy: Mainstreaming Children in International Development. Bristol, UK: The policy Press, 2011.
[16]  T. C. Bonvale and E. Lelievre, “Du concept de ménage à celui d’entourage: une redéfinition de l’espace familial,” Sociologie et sociétés, vol. 27, pp. 177–190, 1995.
[17]  A. Whitehead, “Beyond the household? Gender and kinship based resource allocation in a ghanaian domestic economy", in: Jane I. Guyer and Pauline E. Peters (éds), 1984, Conceptualizing the household: Issues of theory, Method and Application, Workshop held at Harvard Un,” pp. 50–54, 1984.
[18]  E. Coast, S. Randall, V. Golaz, and B. Gnoumou, “‘Problematic polygamy: implications of changing typologies and definitions of polygamy’,,” in Paper presented at the UAPS conference, Ouagadougou, Session 903. Marchés matrimoniaux, endogamie, polygamie et hétérogamie, 2011.
[19]  Z. Zimmer and J. Dayton, “Older adults in Sub-Saharan Africa living with children and grandchildren,” Population studies, vol. 59, no. 3, pp. 295–312, 2005.
[20]  V. Velkoff, “Living arrangements and well-being of the older population: Future research directions”, Population Bulletin of the United Nations,Special Issue Nos 42/43,” New York, 2001.
[21]  V. Golaz and G. Rutaremwa, “The Vulnerability of Older Adults: What do Census Data Say? An Application to Uganda,” Journal of African Population Studies, vol. 25, no. 2, pp. 605–620, 2011.
[22]  D. Gordon and S. Nandy, “UNICEF Global Study of Child Poverty and Disparities: Measuring Child Poverty for Policy Purposes.,” 2008.
[23]  S. Appleton, “Poverty in Uganda, 1999/2000: preliminary estimates from the Uganda National Household Survey (UNHS). Unpublished,” 2001.
[24]  M. Ravallion and B. Bidani, “How Robust is a Poverty Profile?” World Bank Economic Review 8,” New York, 1994.
[25]  Uganda Bureau of Statistics, “The Uganda National Household Survey (UNHS) 2009/2010,” Kampala, Uganda, 2010.
[26]  Uganda Bureau of Statistics, “The Uganda National Household Survey (UNHS) 2009/10,” Kampala, Uganda, 2010.
[27]  G. Rutaremwa, “Under-five mortality differentials in urban East Africa: a study of three capital cities,” Journal of African Population Studies, vol. 26, no. 1, 2012.
[28]  M. Brockerhoff and E. Brennan, “The poverty of cities in developing countries,” Population and Development Review, vol. 24, no. 1, 1998.
[29]  W. J. Hanna and J. L. Hanna, Urban Dynamics in Black Africa, Second Rev. New York: Aldine Publishing Company, 1981.