-
Paper Information
- Previous Paper
- Paper Submission
-
Journal Information
- About This Journal
- Editorial Board
- Current Issue
- Archive
- Author Guidelines
- Contact Us
American Journal of Sociological Research
p-ISSN: 2166-5443 e-ISSN: 2166-5451
2012; 2(5): 113-119
doi: 10.5923/j.sociology.20120205.04
Affecting Socio-Demographic Factors on Children Ever Born for Women Who Have Experienced Domestic Violence and Women Who Have Not Experienced Domestic Violence in Bangladesh
 Abstract
 Reference
 Full-Text PDF
 Full-Text HTML
Md. Rafiqul Islam, Md. Rabiul Islam, Md. Rashed Alam, Md. Mosharaf Hossain
Department of Population Science & HRD University of Rajshahi Rajshahi, 6205, Bangladesh
Correspondence to: Md. Rafiqul Islam, Department of Population Science & HRD University of Rajshahi Rajshahi, 6205, Bangladesh.
| Email: |  |
Copyright © 2012 Scientific & Academic Publishing. All Rights Reserved.
This study assesses the contribution of socio-economic and demographic variables on children ever born (CEB) for women who have experienced domestic violence and women who have not experienced domestic violence by applying multiple classification analysis (MCA). The shrinkage coefficient ( ) is employed for goodness of fit of the model. For this, Bangladesh Demographic and Health Survey (BDHS) 2007 data is used in this study. This study contains 10,146 currently married women out of 10,996 ever-married women. Findings reveal that respondent’s education, age at marriage and wealth index has a negative significant effect on CEB and these are the first, second and third strongest influential factors for explaining the variability of CEB included all other variables for both women who have experienced domestic violence and women who have not experienced domestic violence. In this paper, it is recommended that respondent’s age at marriage and educational qualification should be raised substantially for abating fertility and domestic violence against women in Bangladesh.
Keywords: Domestic and Non-Domestic Violence, Children Ever Born (CEB), Socio-demographic Factors, Multiple Classification Analysis (MCA), Cross- validity prediction power (CVPP), Shrinkage Coefficient and Bangladesh
Cite this paper: Md. Rafiqul Islam, Md. Rabiul Islam, Md. Rashed Alam, Md. Mosharaf Hossain, "Affecting Socio-Demographic Factors on Children Ever Born for Women Who Have Experienced Domestic Violence and Women Who Have Not Experienced Domestic Violence in Bangladesh", American Journal of Sociological Research, Vol. 2 No. 5, 2012, pp. 113-119. doi: 10.5923/j.sociology.20120205.04.
Article Outline
1. Introduction
- Over the past decades, there have been growing recognition of the scope of domestic violence globally and the implications of such violence for the health and well-being of women, children and families[1]. The definition of domestic violence defined by World Health Organization (WHO) extends beyond physical acts of violence toward one’s partner to include sexual coercion, physical threats, psychological abuse and controlling actions, such as, physical isolation or restricting access to health care or financial resources[2]. Evidence received from developing countries suggests that 10% to 60% of married women of reproductive age group having ever experienced some form of domestic violence[3]. It was recorded the highest levels coming from South Asia[4]. Domestic violence affects a range of health outcomes, both for the women who experience it and for their children[5]. For women, the consequences associated with domestic violence include physical injury, chronic pain and gastrointestinal symptoms[1] and adverse mental health outcomes[6]. Negative reproductive health outcomes linked to violence include nonuse of contraception or condoms and unintended pregnancy[7]. For children, evidence shows an association between domestic violence and low birth weight and prematurity baby[8] and elevated risks of prenatal and early childhood mortality[9]. Domestic violence is not a rare occasion in Bangladesh. The exact prevalence in domestic violence is difficult to control due to cultural understanding and sensitivity of the issues existing in the society. As domestic violence enclosed a range of issues, the magnitudes of the problem were observed in various forms and facts[10]. When children ever born (CEB) influences population growth, which has consequences towards force on resources, service situations, health facilities and saving investment, in turn, such penalty have great bearing on the socio-economic and demographic characteristics that affect fertility behavior. However, the factors that are perceived to influence fertility are highly interrelated among themselves; the conceptualization of the determinants of fertility involves a multitude of factors that vary greatly in intensity and direction of force they exert on fertility[11]. In our society, the effects of fertility and domestic violence are obviously vast, but it is impossible to measure. Our entire nation suffers this increasing problem every day. In our country, most of the women have experienced domestic violence: physical, mental and sexual due to lack of their educational knowledge, their partner’s illiteracy, their early marriage, increasing number of children and their lower resources etc. In present time, the study of domestic violence against women and its effect on fertility particularly in Bangladesh have a great importance. Actually, in this paper, women are classified into two groups such as i) domestically violated women, i. e., women who have experienced domestic violence and ii) non-domestically violated women, i.e., women who have not experienced domestic violence.Therefore, the objective of this study is to determine the effects of some socio-economic and demographic variables on CEB for women who have experienced domestic violence and women who have not experienced domestic violence employing MCA. Moreover, shrinkage coefficient is employed in this paper to test the adequacy of the model.
2. Sources of Data
- The data for this study is extracted from Bangladesh Demographic and Health Survey (BDHS) 2007[12]. This study contains 10,146 currently married women out of 10,996 ever-married women in which 4214 are women who have experienced domestic violence and 5932 are women who have not experienced domestic violence.
3. Methodology
3.1. Multiple Classification Analysis (MCA)
- The multiple classification analysis (MCA) developed by Yates in 1934 is employed here[13]. It was later expanded and modified by Anderson and Bancraft in 1952[14]. The computerized MCA program was made by a group of researchers at the Survey Research Center of the University of Michigan in 1963. Since then, the MCA program has been widely used in social science research. MCA requires one dependent variable and two or more independent variables. The dependent variable is continuous but all the independent variables must be categorical. MCA can equally handle the nominal and ordinal variables and can also deal with linear and non-linear relationships of predictor variables with dependent variable. Mathematically, the model can be expressed by the following equation:
 .Where,Yijk is the value or score of an individual who falls in the i th category of the factor A, j th category of the factor B and k th category of the factor C.
 is the grand mean of Y.ai is the effect due to the i th category of the factor A, which is equal to the difference between
  and the mean of its category of factor A.bj is the effect due to j th category of the factor B, which is equal to the difference between
  and the mean of its category of factor B.ck is the effect due to the k th category of the factor C, which is equal to the difference between
  and the mean of its category of factor C.eijk is the error term related with Yijk score of the individuals.The coefficients, which are estimated by solving the normal equation systems, are called the adjusted or net effect of the predictors. These effects measure those of the predictor alone after taking into account the effects of all other predictors. If there is no interrelation among the predictors, the adjusted and unadjusted effects of the predictors will be same. The unadjusted, eta-square (2) coefficient is a correlation ratio, which explains how well the predictor variable explains the variation in the dependent variables and is usually estimated by solving the normal equations with only one predictor. This unadjusted coefficient indicates the proportion of variance explained by a single predictor alone. Similarly, the beta-square (2) coefficient indicates the proportion of variation explained by the other predictor variables. The beta coefficient is compared to the partial correlation coefficient in multiple regressions. It is noted that for women who have experienced domestic violence and women who have not experienced domestic violence, CEB are taken to be the dependent variable and the socio-economic and demographic variables named as: respondent’s age, age at first marriage, religion, respondent’s occupation, wealth index, respondent’s education and type of place of residence are treated as explanatory variables.
3.2. Model Accuracy Test
- In this paper, to assess the accuracy and reliability of model, the CVPP,
 , is applied. The mathematical formula for CVPP is addressed by
 .In which, n is the number of cases, k is the number of regressors in the fitted model and the cross-validated R is the correlation between observed and predicted values of the predicated variable[15]. The shrinkage coefficient (
 ) of the model is the positive value of (
 - R2); where
 is CVPP and R2 is the coefficient of determination of the model. The stability of R2 of the model is 1-shrinkage. The shrinkage coefficient (
 ) determines the adequacy of the model. The estimated CVPP related to their R2 and information on model fittings are presented in Table 5.
 3.3. F-test
- To find out the measure of overall significance of the fitted model as well as the significance of R2, the F-test is employed in this study[16] that is presented in Table 5.
4. Results and Discussion
4.1. For Women Who Have Experienced Domestic Violence
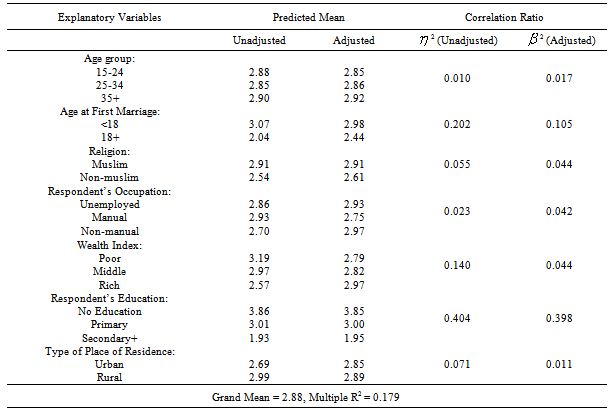
- Different types of socio-economic and demographic factors that may be influence the CEB for women who have experienced domestic violence. To investigate the differential patterns of mean number of CEB for women who have experienced domestic violence, the well-known MCA is used. It is revealed from the results that the proportion of variance explained by MCA for women who have experienced domestic violence is R2 = 0.179. Table 1 shows the mean number of CEB both unadjusted and adjusted by various types of socio-economic and demographic characteristics for domestic violence with the values of
 2 and
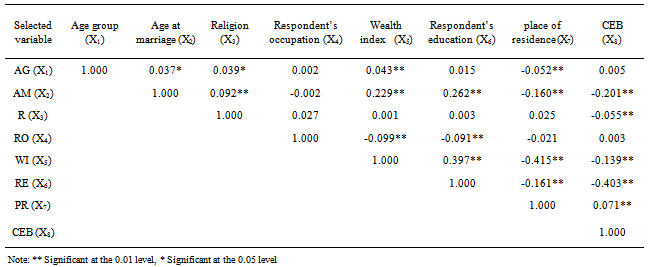
2 and 2 produced from MCA. Also the Table 2 produce the results of zero order correlation coefficients of CEB for women who have experienced domestic violence with various socio-economic and demographic variables.From the Table 2, it is revealed that respondent’s education has a negative significant contribution on CEB. The correlation coefficient is found to be r = -0.403. From the selected variables respondent’s education is the first strongest influential factor for explaining the variation on CEB among all other selected variables. The result depicted that educational qualification has strong association (
 2 = 0.404) with mean number of CEB. It is also presented that the effects of educational level remain low after adjusting for the effect of all other variables in the model (
 2 = 0.398). The mean number of CEB was 3.85 for illiterate women and 1.95 for highly educated women (Table 1). From the result, it is important to note that highly educated women marry later and found to have lower fertility.It is noticed from the Table 2, age at marriage has a significant effect on CEB and has a negative association (r = -0.201). From the Table 1, it is observed that the effect of age at marriage has been found to be the second strongest influential factor for explaining the variation on CEB as well as the proportion of variance explained by age at marriage was
  2 = 0.202 and
 2 = 0.105 respectively. It is also observed that respondent’s who were marry at earlier 18 years of age had on average 2.98 children and respondent’s who were marry within 18 years and above had on average 2.44 children respectively.Respondent’s wealth index is negative (r = -0.139) significantly effects on CEB (Table 2). It is noticed that the Table 1, respondent’s wealth index was found to be the third strongest influential factor for explaining variability of CEB among the included variables. The proportion of variance explained by wealth index was
  2 = 0.140 and
 2 = 0.044 respectively. The Table 1 also indicated that respondent’s who were poor, middle class and rich had on average 2.79, 2.82 and 2.97 children respectively. From the result, it is important to note that rich respondents have no food problems, shelter problems, health problems and economical problems etc. than that of the poor respondents. As a result, rich respondent’s has been found to have higher fertility.
|
|
 2 = 0.071 and
 2 = 0.011 respectively. The mean numbers of CEB (adjusted) for urban and rural areas are 2.85 and 2.89 children respectively. This may be due to fact that women in urban areas have late marriage, higher educational facilities and employment opportunities in the modern sector.From the Table 2, it is observed that religion of the respondent’s has a negative (r =-0.055) significant contribution on CEB. It is also found that respondent’s occupation and age of the respondents has significant impact on CEB. Their association with CEB are found to be r = 0.003 and r = 0.005 respectively. The Table 1 shows the effect of religion, respondent’s occupation and respondent’s age group are the fifth, sixth and seventh strongest influential factors for explaining the proportion of variability of CEB among the selected variables respectively. Religion becomes less important effect (
 2 = 0.055 and
 2 = 0.044) on CEB when other selected variables were controlled. It is also noticed that Muslim community has higher fertility than Non-Muslim community. The mean CEB for Muslim and Non-Muslim community were 2.91 and 2.61 children respectively. Respondent’s occupation also had the low effect on CEB (
 2 = 0.023 and
 2 = 0.042). Results show that mean number of CEB for unemployed, manual and non-manual respondents are 2.93, 2.75 and 2.97 children respectively. Respondent’s age group is another less important effect (
 2 = 0.010 and
 2 = 0.017) on CEB. From the results, it is observed that respondent’s who belong to the age group 15-24, 25-34 and 35+ years had on average 2.85, 2.86 and 2.92 children respectively. The mean number of CEB by using MCA and the zero order correlation coefficients among the selected variables of CEB for women who have experienced domestic violence are given below:
4.2. For Women Who Have Not Experienced Domestic Violence
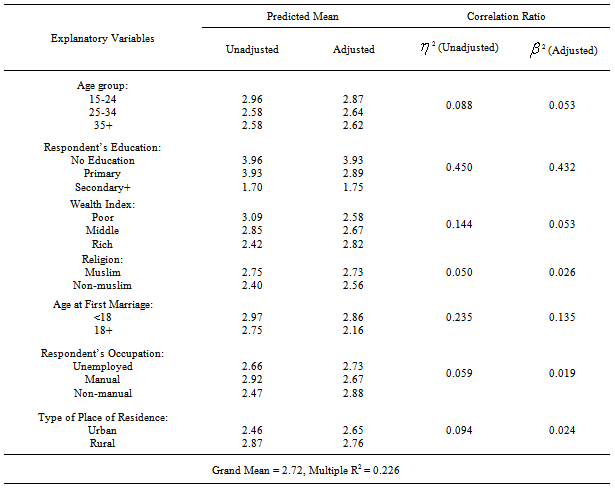
- For women who have not experienced domestic violence, various types of socio-economic and demographic factors that may influence the CEB. The MCA is used to examine the differential patterns of mean number of CEB for women who have not experienced domestic violence. The results show that the proportion of variance explained by MCA for women who have not experienced domestic violence is R2 = 0.226. Table 3 shows the mean number of CEB both unadjusted and adjusted by different socio-economic and demographic characteristics with the values of
 2 and
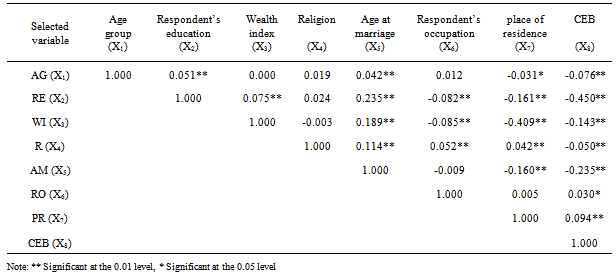
2 and 2 produced from MCA. The zero order correlation coefficients of CEB with various socio-economic and demographic for women who have not experienced domestic violence are presented in the Table 4. For women who have not experienced domestic violence, Table 4 depicted that women education has a negative significant impact on CEB. The correlation coefficient of women education on CEB is found to be r = -0.450. Table 3 revealed that the effect of the respondent’s education is the first strongest positive influential factor for explaining the proportion of variance on CEB among all other included variables. The proportion of variance explained by respondent’s education was
 2 = 0.450 and
 2 = 0.432 respectively. The results also noticed that the respondent’s who are illiterate had on average 3.93 children and those who are highly educated had on average 1.75 children respectively.Age at marriage has also a significant negative association (r = -0.235) on CEB (Table 4). From the Table 3, it is seen that the effect of the age at marriage is the second strongest influential factor for explaining the variation on CEB among the remaining variables. Findings indicate that the age at marriage has strong association (
 2 = 0.235) with mean number of children ever born. But the effect of age at marriage remains low even after adjusting for the effect of all other predictors in the model (
 2 = 0.135). The mean number of CEB was 2.86 for those women who marry before 18 years and was 2.16 for those women who marry after 18 years and above respectively.Table 4 revealed that respondent’s wealth index has negative (r = -0.143) significantly effect on CEB. It is noticed that the Table 3, respondent’s wealth index has been found to be the third strongest influential factor for explaining the variation on CEB as well as the proportion of variance explained by wealth index was
 2 = 0.144 and
 2 = 0.053 respectively. It is also noticed from the Table 3, respondents who are rich had on average 2.82 children and are poor had on average 2.58 children respectively.Place of residence has a significant contribution on CEB. The correlation coefficient is found to be r = 0.094 (Table 4). Findings indicated that the effect of type of place of residence has been found to be the fourth strongest influential factors for explaining the proportion of variance on CEB among all other selected variables. Respondents with an urban residence have lower fertility than that of rural residence. It is seen that type of place of residence has low effect on mean number of CEB (
 2 = 0.094 and
 2 = 0.024). The mean CEB (adjusted) in urban and rural areas are 2.65 and 2.76 children respectively (Table 3).It is observed from the Table 4, respondent’s age group and religion has also a significant contribution on CEB and found to be negative association (r = -0.076 and r = -0.050 respectively). Occupation of the women has positive (r = 0.030) significantly effect on CEB. Table 3 shows that the effects of the respondent’s age group, occupation and religions is found to be the fifth, sixth and seventh strongest influential factors for explaining the variation on CEB for all other variables. The proportion of variance explained by respondent’s age group was
  2 = 0.088 and
 2 = 0.053 respectively. It is observed that respondent’s who belong to the age group 15-24 had highest effect on mean number of CEB (2.87) and who belongs to the age group 25-34 and 35+ years had lowest effect on CEB were 2.64 and 2.62 children respectively. Respondent’s occupation has less importance on CEB (
 2 = 0.059 and
 2 = 0.019). Religion also had the low effect on CEB (
 2 = 0.050 and
 2 = 0.026). The Muslim and Non-muslim respondent’s had on average 2.73 and 2.56 children respectively. Findings indicate that the Muslim community has higher fertility than their Non-muslim counterparts. The mean number of CEB by using MCA and the zero order correlation coefficients among the selected variables of CEB for women who have not experienced domestic violence are given below:
|
|
|
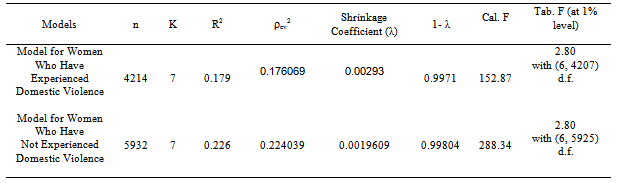
 ) are 0.00293 and 0.0019609. These imply that the fitted models are fit well. Moreover, the stability for R2 of these models is stable more than 99%. The F statistic results at 1% level of significance are indicated from the Table 5 that these models and their corresponding to R2 are highly statistically significant and hence, these are well fitted to the data.
5. Conclusions and Recommendations
- In MCA respondent’s education and age at first marriage women who have experienced domestic violence and women who have not experienced domestic violence is one of the most important correlates, which is the strongest effect for explaining the variability on CEB. Although the average level of education is very low, education still has a strong inverse relationship with CEB. Respondent’s wealth index and type of place of residence have effects on CEB. Other variables have also some importance on reducing fertility such as respondent’s age, respondent’s occupation and religion of the respondents etc. From the above findings it is noticed that total effect of female education on CEB is negative. Education may provide better employment opportunities outside home and age at marriage can be raised through providing education. In this paper, it might be suggested that respondent’s age at marriage should be raised and attention should be focused on the need of providing educational facilities, particularly in rural areas in order to reduce the level of fertility as well as domestic violence against women in Bangladesh.