-
Paper Information
- Paper Submission
-
Journal Information
- About This Journal
- Editorial Board
- Current Issue
- Archive
- Author Guidelines
- Contact Us
Software Engineering
p-ISSN: 2162-934X e-ISSN: 2162-8408
2014; 4(1): 10-18
doi:10.5923/j.se.20140401.02
Analysis of the Workflow System Ehancement Project Speed and Duration – A Case Study
 Abstract
 Reference
 Full-Text PDF
 Full-text HTML
Beata Czarnacka-Chrobot
Institute of Information Systems and Digital Economy, Warsaw School of Economics, Warsaw, 02-554, Poland
Correspondence to: Beata Czarnacka-Chrobot, Institute of Information Systems and Digital Economy, Warsaw School of Economics, Warsaw, 02-554, Poland.
| Email: |  |
Copyright © 2014 Scientific & Academic Publishing. All Rights Reserved.
In this paper we present a case study on tender competition concerning the enhancement of Workflow System (WS) of one of the public institutions in Poland in which one of the two potential developers offered a possibility to enhance such system at the project speed of 0,8 Function Point (FP) of the Common Software Measurement International Consortium (COSMIC) method per one hour, whereas the other one attempted to prove that such project speed is overestimated. The criterion of project speed, being one of the three criteria considered, determined client’s decision on selecting developer offering that particular value. The goal of this paper is to demonstrate if it is possible to carry out the WS enhancement at the above mentioned project speed and, consequently, within the project duration resulting from that attribute. The analysis served as a main basis for settling legal dispute between a company offering values of attributes that are being analysed in the paper and the competing company.
Keywords: Workflow System (WS), Software development/enhancement projects, Project Speed, Project duration, Per-unit work effort, Per-unit cost, Functional size measurement, COSMIC method, IFPUG method
Cite this paper: Beata Czarnacka-Chrobot, Analysis of the Workflow System Ehancement Project Speed and Duration – A Case Study, Software Engineering, Vol. 4 No. 1, 2014, pp. 10-18. doi: 10.5923/j.se.20140401.02.
Article Outline
1. Introduction
- Software systems, including Workflow System (WS), like any other products, especially of engineering character, are characterised by certain attributes that should be subject to measurement. Basic attribute of each and every product is its size. Software engineering, however, cannot boast about being as mature in terms of units designed for size measurement (here: of software/applications) as other engineering disciplines (e.g., construction engineering) [1]. This constitutes fundamental cause of the problems in reliable and objective estimation of such basic attributes of projects aimed at development, enhancement and maintenance of software systems as: total work effort and total cost, work effort per unit and cost per unit, project speed, project duration and project productivity. “Measurement of software size (...) is as important to a software professional as measurement of a building (…) is to a building contractor. All other derived data, including effort to deliver a software project, delivery schedule, and cost of the project, are based on one of its major input elements: software size.” [2, p. 149].However, it is not possible to give answer to the question about the values of the above mentioned project’s attributes - in particular speed and duration of software system development or enhancement projects - without prior adoption of adequate, i.e., sufficiently reliable and objective software system size unit. Among the three measures of software system size being used in practice, that is: (1) programming units (e.g., source lines of code), (2) construction complexity units (e.g., object points), and (3) functionality units, this is just functionality units that currently are the most widely recognised worldwide [3]. This has been confirmed by the fact that they were accepted by the international standardization organizations: ISO (International Organization for Standardization) and IEC (International Electrotechnical Commission) as the only appropriate units of software system size – in the ISO/IEC 14143 norm, which standardizes the concept of the so-called software Functional Size Measurement (FSM) [4].As a result of many years’ verification of reliability and objectivity of particular FSM methods, five among them (out of approx. 25) have been acknowledged by the ISO and IEC as conforming to the rules laid down in the ISO/IEC 14143 norm. They are the following (for more details see e.g., [5], [6]): A. First generation methods: ● International Function Point Users Group (IFPUG) method in its part limited to the so-called unadjusted Function Points (FP) - normalized in the ISO/IEC 20926 standard [7]. ● Netherlands Software Metrics Association (NESMA) function point method in its part taking into account the functional size - normalized in the ISO/IEC 24570 standard [8]; in this method the unit of software size is 1 NESMA FP, which is now considered to be equivalent to 1 IFPUG FP. ● Mark II (MkII) function point method, having been developed by the United Kingdom Software Metrics Association (UKSMA) in its part taking into account the functional size - normalized in the ISO/IEC 20968 standard [9]. B. Second generation methods:● Common Software Measurement International Consortium (COSMIC) function point method - normalized in the ISO/IEC 19761 standard [10]; in this method the unit of software size is 1 COSMIC Function Point (1 CFP). ● FSM method having been developed by the Finnish Software Measurement Association (FiSMA) – normalized in the ISO/IEC 29881 standard [11]. The IFPUG FP method continues to be the most popular FSM method, at least in Poland [12], hence, for this very method, the largest resources of benchmarking data can be found [13], on the basis of which the above mentioned attributes of software systems development or enhancement projects, including project speed and project duration, are being estimated. On the other hand, for the past couple of years, this is the COSMIC method that has been growing dynamically, however, the existing resources of benchmarking data for it are considerably scarce compared to such data available for the IFPUG method as it is a much newer approach. This is the COSMIC FP method that was chosen by one of the public institutions in Poland as a point of reference for software size, being the Workflow System, and thus for the WS enhancement project speed and duration.Thus in this paper we present a case study on tender competition concerning the enhancement of Workflow System (WS) of one of the public institutions in Poland in which one of the two potential developers offered a possibility to enhance such system at the project speed of 0,8 CFP per 1 hour, whereas the other one attempted to prove that such project speed is overestimated - since the criterion of project speed, being one of the three criteria considered, determined client’s decision on selecting developer offering that particular value. The goal of this paper is to demonstrate if it is possible to carry out the WS enhancement at the above mentioned project speed and, consequently, within the project duration resulting from that attribute. The analysis served as a main basis for settling legal dispute between a company offering values of attributes that are being analysed in the paper and the competing company.Thus the structure of the paper reads as follows: after presenting the assumptions adopted in the considered case study in Section 2 and then the resources of benchmarking data that are worth using in the analysis of the considered issues in Section 3, in Section 4 we will present analysis of the project speed in case of dedicated business application projects. On the other hand, Section 5 will be devoted to the analysis of the project speed in case of dedicated business application projects versus other project parameters, i.e., per-unit work effort, project duration, per-unit cost, and work costs. In Section 6, a synthesis of conclusions for the considered case study will be presented.
2. Assumptions for the Considered Case Study
- Project speed is a quotient of project’s software product size to the duration of product delivery, that is in this case it is understood as the number of the COSMIC function points delivered within a certain time, e.g., 1 hour (CFP/h). Project speed is difficult to determine since it depends on a number of factors. Primarily it depends on the type of project, type and size of project’s product (software) as well as technological environment of project execution, mainly on the generation of programming languages being used. As indicated by the documentation provided by a client commissioning analysis, the subject of considerations in this paper is project speed for which the following factors affecting its value should be taken into account:● size of changes of the Workflow system up to 4000 CFP;● the Workflow system has a character of business application (i.e., being data-driven); ● the Workflow system is dedicated to the client’s needs (it does not constitute a commercial software package) ;● undertakings within the area of interest of this analysis consists in software extension (enhancement project) – as they are not activities aimed at developing new, non-existing application nor maintenance ones; ● for development activities, the third Generation Languages (3GL) will be used. Based on the above assumptions, certain company offered project speed of 0,8 CFP per 1 hour, with the size of project development team being as required by the client, that is 10 persons. Thus the company believes it is possible to deliver not less than 0,8 CFP within the time of 1 hour by the team consisting of 10 persons. Additionally, net cost of 1 CFP (that is 1,25 hours of work) was estimated by the company to be approx. 1000 USD.The above assumptions not only have an effect on the value of project speed and project duration but they also determine use of specific resources of benchmarking data for comparison purposes.
3. Usefulness of Benchmarking Data
- Appropriate resources of own benchmarking data, which would allow to properly determine project speed specific to a given software development organization, are owned by relatively few development organizations since owning such resources is conditioned not only by the effective implementation of measurement programmes for software products and processes, which in its own right does not occur often, but also by the collecting of such data for relatively many projects completed in the past, being similar in terms of application and technology, and additionally, referring them to the correct units of software systems size (for more details see [14]). This situation is all the more likely to happen in Poland where the FSM methods, including COSMIC method, have been employed for a relatively short time now.In the situation like that, and also when comparing organizational project speed with the so-called good practices, usefulness of repositories with general and commonly available benchmarking data reveals. Usefulness of such data gets additionally strengthened by the purpose of this paper which is meant to indicate possible values of project speed and project duration by taking into account the assumptions listed in Section 2. The largest, commonly recognised and widely available repository containing general benchmarking data for dedicated software system development and enhancement projects whose products are measured using the FSM methods, including COSMIC method, is managed by the International Software Benchmarking Standards Group (ISBSG)1. The ISBSG is a non-profit organization founded in the second half of the 1990s. with the purpose to enhance the processes of IT resources management both in business entities as well as in public administration institutions. This goal is being fulfilled by developing, maintaining and using several repositories with benchmarking data. One of them, the biggest one (current version of this repository contains data concerning about 6000 projects from about 30 countries) includes data for software development and enhancement projects2. It is normalized according to the ISO/IEC 15939 standard [15], verified and representative of the current technology.Data gathered in the discussed repository had been classified by the ISBSG with regard to the following criteria (see [16], [17]):● country of effort, including: Finland (18%), Holland (14%), Australia (13%), India (11%), Japan (10%), USA (10%), Canada (5%), Denmark (5%), Great Britain (4%), Brazil (3%), China (2%), France (2%);● context of project, including: type of organization (including: developed for public institutions – approx. 750 projects) and area of business;● type of project, including: type of actions (modification/enhancement of a system – approx. 60%, development from scratch – approx. 40%), purpose of project (internal needs – approx. 48%, external needs – approx. 52%) and size of development team;● type of product, including: type of application (including business applications) and product size – for the most part expressed in IFPUG FP, however products measured in CFP are represented sufficiently too (approx. 400 projects);● project execution environment, including: programming language (over 100 programming languages, among them 64% are 3GL languages, 33% - 4GL languages, while 3% are application generators; main programming languages include: COBOL, C/C++/C#, Java/J2EE/JavaScript, Visual Basic, PL/I, PL/SQL, Oracle, .Net, SQL, Natural, Access, PowerBuilder, ASP, and Lotus Notes) and hardware platform (approx. 40% are mainframe projects); ● development methods and tools being used.When using data gathered by this organization one should bear in mind that they are representative of rather above-average projects which results from the following (for more details see [14]):● criteria of gathering data in the ISBSG repository take into account only those organizations that are using FSM methods while such organizations are considered more mature than others because they execute programmes concerning implementation of software measures; ● this is developers themselves that choose projects whose data they provide to the ISBSG repository – those may include projects that are typical of them as well as projects having best parameters, including e.g., highest productivity and/or project speed (apparently, data concerning projects characterised by poor parameters, e.g., low productivity, are not provided);● the ISBSG repository does not feature too many data about very large projects (such projects rarely may be considered as successful projects, i.e., as a rule their parameters do not fit within the estimated limits, going beyond them significantly).It should be stressed that the ISBSG data are subject to rigorous process of verification with regard to quality. Hence they are appreciated in the IT industry.
4. Dedicated Business Application Project Speed
- Based on data concerning dedicated software system development and enhancement projects the ISBSG produces cyclic analytical reports. From the perspective of the issues discussed in this paper the most important is the ISBSG report of March 2012 entitled „The Performance of Business Application, Real-Time and Component Software Projects. An analysis of COSMIC - measured projects in the ISBSG database”, made in collaboration with the COSMIC [18], which analyses, among others, speed of delivering COSMIC function points and project duration for various types of software systems, including their sizes, depending on the type of project and generation of programming language. What is of our interest here is project speed of dedicated business applications enhancement with the use of 3GL programming language.
4.1. Business Application Enhancement Project Speed
- In case of business application enhancement projects (i.e., those adding new, modifying and/or removing existing functionality), the following regularities prove characteristic - they were identified on the basis of all 76 projects, i.e., without dividing them by the criterion of the generation of programming language being used; there were 67 projects analysed for applications in the 3GL and 9 projects for 4GL applications ([18, pp. 20-21]):● project speed (PS) for delivery of COSMIC function points during a month is calculated according to the below formula:● project duration in months (Ms) is calculated according to the below formula:
 | (2) |
 i.e., taking into account conversion rate set by the client where the number of working days during one month is 21 days whereas each working day is 8 hours we obtain the following:
 which implies PS being twice lower than the offered one while:
 Conclusion 1:Taking into account assumptions adopted in the analysis and regularities resulting from the ISBSG benchmarking data it should be stated that project speed in case of dedicated business application enhancement project of the size of 4000 CFP should oscillate around 0,38 CFP per hour. On the other hand, enhancement of product of the size of 4000 CFP should take approx. 62,33 months, that is approx. 5,19 years.
4.2. Business Application Development Project Speed
- In the analysed report it is also stated that, generally speaking, for application sizes above 100 CFP there are no significant differences with regard to the project speed between application enhancement projects and application development projects (below that size there is a difference in favour of project speed for application enhancement projects). Therefore, suggestion of the authors of the report made with regard to the analysis of the per-unit work effort, indicating that large business application enhancement projects (i.e., those having application size above 1000 CFP) should be treated as projects of their development may not apply to the project speed nor project duration; also there are no statistically adequate data that would allow to determine the effect of particular impact factors on project speed.However, to keep up the objectivity of our analysis it is worth to bring up data featured in the already mentioned ISBSG report [18], concerning projects consisting in development of dedicated business applications. In this case projects employing 3GL and 4GL programming languages were analysed separately. Data presented in the discussed report indicate that for business application development projects using 3GL programming languages (77 among the analysed projects) particular regularities read as follows ([18, pp. 13-16]):● project speed (PS) for delivery of COSMIC function points per month:
 | (3) |
 | (4) |
 i.e., taking into account conversion rate set by the client where the number of working days during one month is 21 days whereas each working day is 8 hours we obtain the following:
 which means PS being nearly 70% lower that the offered one while:
  Conclusion 2:Taking into account assumptions adopted in the analysis and regularities resulting from the ISBSG benchmarking data it should be stated that project speed in case of dedicated business application development project of the size of 4000 CFP should oscillate around 0,48 CFP per hour. On the other hand, duration of the development of product of the size of 4000 CFP should be approx. 49,41 months, that is approx. 4,11 years.Conclusions 1 and 2 get additionally strengthened by the following facts, having significant effect on the way of reducing the project speed: 1. It is necessary to take into account the risk resulting from the fact that application developer has no full control over project speed nor project duration since this is parameters that to a large extent depend on other participants of the development process (e.g., subcontractors, client - first of all duration of approval tests and formal approval). 2. There occurs evident, inversely proportional dependence between project speed and quality of the delivered product: the higher the project speed, as a rule the lower the quality – this being due to lower amount of time dedicated to eliminating defects and testing.3. In case of business application enhancement projects, for the mentioned regularities there were also included projects whose products were written using 4GL programming languages whereas these languages increase work productivity (without those languages being taken into account the indicated project speed probably would be lower).4. It is worth pointing out that in formulas (1) – (4) the economy of scale for project speed had been taken into account, according to which the project speed increases along with the growth of product size – however this regularity is still being considered as controversial and de facto was observed for projects having product size up to 1000 CFP – other references indicate inverse dependence (see e.g., [19]), that would have an effect on reducing the project speed.
5. Dedicated Business Application Project Speed Versus Other Project Parameters
5.1. Project Speed Versus Per-unit Work Effort
- Thorough assessment of project execution should also include – next to project speed and quality of product – productivity, that is the inverse of the so-called per-unit work effort. Between these parameters the so-called “trade-off” may occur, which may bring about significant consequences. For instance, project speed may be increased by increasing the size of development team yet this would cause – apart from very likely lowering of product quality - lowering of productivity as well (increase of per-unit work effort). The discussed ISBSG report [7] analyses also the value of the per-unit work effort with regard to 1 CFP, that is the so-called Project Delivery Rate (PDR) – for various types of projects and various types of software systems, depending on the key impact factors, including generation of programming language being employed. Per-unit work effort is measured in work-hours, being a measure of work effort of one employee per product size unit. Therefore it signifies the number of hours that one employee needs to develop a unit of software product. In the discussed report, total work effort is normalised at the so-called first level meaning that it comprises activities making up the whole lifecycle of the project: from analytical works to implementation. Analysis of the PDR with regard to 1 CFP is based on data coming from business application projects completed in 1999-2011. What’s of our interest here is PDR for dedicated business application projects developed with the use of 3GL.
5.1.1. Business Application Development Projects
- In the cited ISBSG report (see [18, pp. 8-13, 16-17]) it is suggested that large business application enhancement projects (i.e., those having application size above 1000 CFP) should be treated as projects of development of such applications when it comes to productivity/per-unit work effort. Hence it is appropriate here to mention first of all those data, along with regularities resulting from them, that pertain to business application development projects. Data presented in the discussed report indicate that per-unit work effort with regard to 1 CFP for business application development projects, given that their products are developed using 3GL programming languages (120 of the projects under analysis), reads as follows: the PDR median is 24,5 work-hours/1 CFP, maximum value – as many as 330,6 work-hours/1 CFP while minimum number of work-hours needed to develop 1 CFP amounts to 2,7 work-hours. The PDR varies also with regard to the size of software. However in case of this issue we are dealing with two contradictory views (see [20]). According to one of them, presented in the cited ISBSG report, in case of business application development and enhancement the economies of scale occur, i.e., the growth of application size entails the increase of productivity median, therefore the median of per-unit work effort decreases. However, in the discussed report such regularity was observed only for the application size up to somewhat above 1000 CFP – for larger sizes of application data are not known to the authors. This view about economies of scale is not shared by the authors of other studies (see e.g., [19]), who claim that we deal with totally opposite situation, i.e., productivity median decreases (per-unit work effort median increases) with the growth of application size thus in such projects we are dealing with the so-called diseconomies of scale. Due to the above controversy as well as to the fact that in case of per-unit work effort we have at our disposal also data that – unlike data concerning project speed – do not force taking it into account, in this paper we will consider neither economies nor diseconomies of scale – since we do not have at our disposal any information proving unequivocally one of the concepts, particularly for an application having size of 4000 CFP.Thus assuming that:● there are no reasons to diverge from commonly accepted rules of comparison and to assume that per-unit work effort will be lower (or higher) than the median;● project speed (PS) is a quotient of the size of development team (TS) to the per-unit work effort (PDR), therefore:
 | (5) |
5.1.2. Business Application Enhancement Projects
- As mentioned earlier in this paper, the ISBSG report suggested that in the context of productivity (per-unit work effort), large business application enhancement projects (i.e., those having application size above 1000 CFP) should be treated as projects of development of such applications. However, to keep up the objectivity of our analysis it is worth to bring up data featured in the already cited ISBSG report, concerning projects consisting in the enhancement of the existing business applications (see [18, pp. 17-22]). Data presented in the report indicate that per-unit work effort with regard to 1 CFP for business application enhancement projects using the 3GL programming languages (there were 96 such projects analysed) reads as follows: the PDR median is 26,5 work-hours/1 CFP, while minimum value is 3,0, and maximum value – as many as 326,0 work-hours/1 CFP. Thus, assuming that:● there are no reasons to diverge from commonly accepted rules of comparison and to assume that per-unit work effort will be lower (or higher) than the median;● project speed (PS) is a quotient of the size of development team (TS) to the per-unit work effort (PDR) – see formula (5),we obtain:● for the offered PS = 0,8 CFP/1 hour and for PDR = 26,5 work-hours/1 CFP – necessary development team size (TS) being over 21 people (21,2), which implies necessity to employ for the considered project more than 21 people throughout its duration;● for PDR = 26,5 work-hours/1 CFP and assuming development team size on the level of 10 people (being employed throughout the considered project) – project speed amounting to 0,38 CFP/1 hour, that is nearly twice as less as the offered speed; it should be clearly pointed out, though, that it is identical with the PS calculated on the basis of the formula (1);● for the offered PS = 0,8 CFP/1 hour and assuming development team size on the level of 10 people (being employed throughout the considered project) – PDR amounting to 12,5 work-hours/1 CFP, being nearly twice as less as the median therefore development team must demonstrate productivity nearly twice as higher as the productivity characteristic of the above-average projects. In this case too the above calculated values do not take into account the following risk having an effect on reducing the project speed: ● low chance to maintain the team consisting of 21 project developers throughout such a long project’s lifecycle (4 – 5 years);● possibility of the per-unit work effort to grow above the median (and of productivity to drop below the median) – for the same reasons as mentioned in the preceding part of the paper (see section 5.1.1);● possibility of occurrence of diseconomies of scale (increase of per-unit work effort along with the increase of system size). Conclusion 4:Taking into account assumptions adopted in the analysis and regularities resulting from the ISBSG benchmarking data it should be stated that having assumed the median of per-unit effort (or productivity) characteristic of business application enhancement projects using the 3GL programming languages it is possible to achieve the offered project speed only on the condition of employing for the considered project more than 21 people for its entire duration (4 – 5 years). With the employment on the level of 10 people, on the other hand, it is possible to achieve project speed being maximally nearly as twice less as the offered one, amounting to 0,38 CFP/1 hour since achieving the offered project speed would require at least nearly double increase of team productivity comparing to the productivity typical of projects of the considered type, and additionally being of above-average character.The ISBSG report indicates also that, in general, business application enhancement projects require more work-hours per 1 CFP comparing to business application development projects, i.e., they are characterised by the higher per-unit work effort (lower productivity).
5.2. Project Speed Versus Project Duration
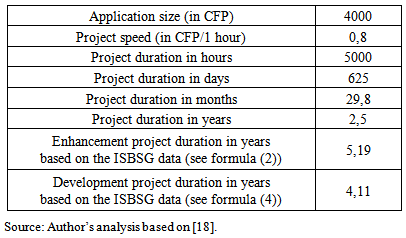
- The ISBSG data indicate that duration of project having application of the size of 4000 CFP should range from somewhat more than 4 years (if the considered project is treated as an application development project – see section 4.2 and formula (4)) to somewhat more than 5 years (in case we treat the considered project as an application enhancement project – see section 4.1 and formula (2)). These values are higher than the offered project speed by 1,6 to over 2 times what can be observed in Table 1.
|
5.3. Project Speed Versus Per-unit Cost and Work Costs
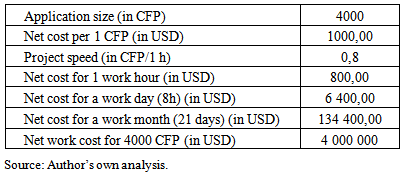
- It is also worth pointing to the correlation between the offered project speed and the per-unit cost measured with regard to 1 CFP and to work duration. Based on the ISBSG data featured in the report “Software Project Costs” [21], where the value of the per-unit cost with regard to 1 unadjusted function point (UFP) IPFUG is being analysed, which in practice of calculating of per-unit cost is assumed to be equivalent to 1 COSMIC function point (1 CFP) (see e.g., [22]), we can state that in definite majority of cases the per-unit cost ranges from 300 USD to 1000 USD per 1 IPFUG UFP (1 CFP) with the median amounting to 716 USD per 1 IFPUG UFP (1 CFP). These costs are measured with project development team and support personnel (e.g., database administrators) being taken into account – they are approx. 15% higher comparing to the costs calculated solely for project development teams. What’s more, C. Jones proves (see [23]) that Poland is among countries having lowest per-unit work cost per 1 IPFUG UFP (1 CFP). While the ISBSG data (see section 3) in 80% concern projects executed in countries where per-unit work cost is many times higher (even approx. ten times higher), with the median on the level of 716 USD. Naturally, these differences result from the factors of macroeconomic nature and although they decrease over time they still remain significant. Thus, with some caution though, it should be stated that per-unit cost of delivering 1 CFP in Poland should not go above the cost median resulting from the ISBSG data (amounting to 716 USD). Enhancement of application having the size of 4000 CFP should therefore cost (in the sense of the net work cost) not more than 2,86 million PLN, that is nearly 40% less in comparison with the offered net work cost (see Table 2).
|
6. Conclusions
- In the ISBSG report, the above cited regularities were derived on the basis of the analysis of approx. 150 – 200 dedicated business application development and enhancement projects being similar technology-wise. Naturally, the more projects are being taken into account, the more representative are data resulting from them and the closer to the reality are the regularities. What’s more, the ISBSG data undergo rigorous verification – both with regard to the correctness of measurement process (the ISO/IEC 15939 norm) and to the quality of data. Thus it should be stated that in this respect they have objective character – however only if they pertain to the above-average projects, being projects that in general are characterised by better parameters (including higher project speed and productivity). At the moment there is no better repository of benchmarking data for dedicated business application development and enhancement projects measured in COSMIC function points that would indicate the so-called good practices in the area of issues considered in this paper than the ISBSG repository.Hence, taking into account regularities resulting from the ISBSG benchmarking data along with the assumptions adopted in the analysis that concern the actual project, it should be stated that:If we assume that the analysed project shall be considered as business application enhancement project then the (enhancement) project speed for the application of the size of 4000 CFP should oscillate around 0,38 CFP per hour therefore it should be over twice as less as the offered one. On the other hand, enhancement of product of the size of 4000 CFP should not last significantly less than approx. 62,33 months, that is approx. 5,19 years.However, if we assume that due to the product size the analysed project shall be considered as business application development project then the (development) project speed for the application of the size of 4000 CFP should oscillate around 0,48 CFP per hour therefore it should be nearly twice as less as the offered one. On the other hand, development of product of the size of 4000 CFP should not last significantly less than approx. 49,41 months, that is approx. 4,11 years.Having assumed the median of per-unit effort (or productivity) characteristic of business application development projects using the 3GL programming languages it is possible to achieve the offered project speed only on the condition of employing for the considered project not less than 20 people for its entire duration (4 – 5 years). With the employment on the level of 10 people, on the other hand, it is possible to achieve project speed being maximally nearly twice as less as the offered one, amounting to 0,41 CFP per 1 hour since achieving the offered project speed would require at least nearly double increase of team productivity comparing to productivity typical of projects of the considered type (additionally being of above-average character). Having assumed the median of per-unit effort (or productivity) characteristic of business application enhancement projects using the 3GL programming languages it is possible to achieve the offered project speed only on the condition of employing for the considered project more than 21 people for its entire duration (4 – 5 years). With the employment on the level of 10 people, on the other hand, it is possible to achieve project speed being maximally nearly twice as less as the offered one, amounting to 0,38 CFP per 1 hour since achieving the offered project speed would require at least nearly double increase of team productivity comparing to productivity typical of projects of the considered type (additionally being of above-average character). The offered duration of the project having product of the size of 4000 CFP is from 1,6 to over two times shorter than the project duration resulting from the ISBSG regularities – this being the result of a tenderer adopting the overestimated project speed, or possibly inversely: overestimated project speed may be the effect of the underestimated offered project duration.Additionally taking into account the value of work cost in Poland it should be stated that the offered net work cost in relation to work time is significantly overestimated which results, among others, from the overestimated project speed. The offered project speed is not completely unachievable however to keep it up throughout the entire project execution on the level not lower than the offered one, for which developer’s statement was required, seems rather unlikely - it would be possible only in a very favourable conditions and in circumstances that are rather unreal to occur in practice, even for a company that is very well organized and whose development personnel is exceptionally efficient. As indicated by the above, the highest rational project speed should not exceed 0,48 CFP per 1 hour – however solely on the condition that the considered project due to the product size will be regarded as business application development project, otherwise it should be even lower. What’s more, let’s point it up again, values of the ISBSG parameters, being point of reference, concern above-average projects. Moreover, the conclusions get strengthened also by the fact that calculation of project speed and project duration does not include various categories of risk that were mentioned in our considerations – the biggest among them is significantly limited influence of project developer on these very parameters. What’s also of significance is risk related to low quality of the delivered product – in the considered case development organization offers values of the analysed parameters that seriously question the possibility of carrying out the Workflow system enhancement with due meticulousness. Summing up it should be stated that from the rational point of view, taking into account assumptions adopted in this analysis as well as the above presented regularities resulting from the objective benchmarking data, the offered Workflow system enhancement project speed on the level of 0,8 CFP per 1 hour should be regarded as overestimated.
Notes
- 1. http://www.isbsg.org (14.14.2014). C. Jones estimates that there are dozen or so sources of benchmarking data at the moment however definite majority of them are not widely available. What’s more, part of them contain data about relatively low number of projects, in addition they do not always concern the FSM methods (see [13]). Due to these reasons, the ISBSG repository of benchmarking data is recognised as best at the moment.2. As it indicates, at this level the ISBSG does not differ development of new software products from scratch from projects consisting in the enhancement of the existing software believing that they are of similar character with regard to key attributes. However, the ISBSG clearly differentiates software maintenance and support projects from them since data for such projects are collected in a different, separate repository – which is not a subject of our analysis here.