-
Paper Information
- Next Paper
- Previous Paper
- Paper Submission
-
Journal Information
- About This Journal
- Editorial Board
- Current Issue
- Archive
- Author Guidelines
- Contact Us
Software Engineering
p-ISSN: 2162-934X e-ISSN: 2162-8408
2012; 2(4): 147-159
doi: 10.5923/j.se.20120204.08
Formal UML Modelling of Isotopo, Bioinformatical Software for Mass Isotopomers Distribution Analysis
 Abstract
 Reference
 Full-Text PDF
 Full-Text HTML
Zeeshan Ahmed , Saman Majeed , Thomas Dandekar
Department of Bioinformatics, Biocenter, University of Wuerzburg, Germany
Correspondence to: Zeeshan Ahmed , Department of Bioinformatics, Biocenter, University of Wuerzburg, Germany.
| Email: |  |
Copyright © 2012 Scientific & Academic Publishing. All Rights Reserved.
Mass isotopomer distribution analysis (MIDA) is a technique towards the measurement of amalgamation of polymers by involving the process of quantification of relative abundances of molecular species with mass spectrometry. The objective of this research is to study metabolic isotopes to quantify the fraction of metabolites of interest in the mixture typically by tracing isotopes. Estimating mass isotopomers distribution from spectral data is an extension of the quantitative mass spectrometric method to a multi component mixture analysis. Focusing on identifying the quantity of population of labelled isotopomers for resolving the exact rate of synthesized fractions present in the mixture and metabolic experimental data management, a new software application named “Isotopo” is proposed and designed. Isotopo is an application with proposed abilities of performing quantitative mass spectrometry to readily mixtures of materials labelled with stable isotopes. This can be very important for both biomedicine and biochemistry. Most recent version of Isotopo will have the ability of processing experimental isotopomers data and estimating mass values and relative intensities. Using formal mathematical algorithms which generate an appropriate set of linear simultaneous equations, it will predict natural abundance values, relative isotopic abundance values and fractional molar abundance values for each fragment from labelled substance based experimental data elements. Using Isotopo it will also possible to process data sets with multiple data entries up to three actual intensity values against one mass to charge ratio values, estimate absolute enrichment, mean and standard deviation of both natural and relative isotopic abundances. Isotopo will also provide the standardization of experimental data with a file based record keeping system for experimental data manipulation and management. In this paper justifying the need of a new software application, we also present the followed V-Model, formal UML designs (including use case, data flow, flow chart, system sequence, component and class diagrams), and designed graphical user interface of Isotopo.
Keywords: Bioinformatics, Design, Human Computer Interaction (HCI), Mockup, Mass Isotopomers Distribution Analysis (MIDA), Metabolic Flux Analysis (MFA), Unified Modelling Language (UML)
Cite this paper: Zeeshan Ahmed , Saman Majeed , Thomas Dandekar , "Formal UML Modelling of Isotopo, Bioinformatical Software for Mass Isotopomers Distribution Analysis", Software Engineering, Vol. 2 No. 4, 2012, pp. 147-159. doi: 10.5923/j.se.20120204.08.
Article Outline
1. Introduction
- Bioinformatics is one of the recently introduced and highly contributing fields towards empirical, computational and complex data analysis with the involvement of probability, statistics, mathematics and informatics (e.g.[1]). It is providing heavy experimental data management and manipulation using relational database management system (e.g.[2],[3]) and globalizing data at web using grid[4] and semantic web[5] technologies etc. Bioinformatics has already challenged to explore several natural sciences areas e.g. metabolic network analysis and (re)construction, automation of genome annotation, protein structure determination etc., and provided values to the field of biology (& related) but still lots of areas need to be targeted and improved. The objective of this research is to study metabolic isotope to quantify the fraction of metabolites of interest in the mixture typically by tracing isotopes. Mass isotopomer distribution analysis (MIDA) measures the mixtures of polymers (e.g. lipids, carbohydrates and proteins) by quantifying relative abundances of molecular species with Mass Spectrometry (MS; a systematic technique to measure the mass-to-charge ratio values of charged particles)[6]. MS converts individual molecules into ions to direct them in magnetic fields using Mass Spectrometer[7]. During GC-MS, at first a mixture of compounds is inserted into the GC to vaporize using a heated chamber to separate compounds for MS analysis, by travelling into GC column.A chromatogram is drawn, representing each compound with its peak. All Mass Spectrometers consists of three main sections: Ionizer, Ion Analyzer and Detector[8] (Figure 1). Electron impact ionization is performed by Ionizer with a gas chromatograph using a high-energy electron beam to collect molecular ions and fragments. Ion Analyzer accelerates obtained molecular ions and fragments by manoeuvring the charged particles using mass spectrometer, eliminating uncharged molecular ions and fragments. The job of the Detector is to generate an electronic signal at every ion hit. During this process mass analyser classifies the ions with respect to the mass to charge ratio values and detector extracts the abundance values of each mass to charge ratio value.
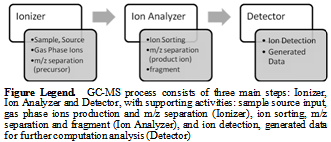 | Figure 1. Gas Chromatography Mass Spectrometry Process (GC-MS) |
2. Isotopo: V-Model
- The software development of any kind should be done following some process model. There are already some well established development models existing and followed e.g. Waterfall model, Spiral model, Iterative and incremental development, Agile development, Code and fix, and some Process improvement models. During our software design and development, we are following a well established software development model i.e. V-Model; an extended form of waterfall model proposed by Paul Rook[25]. The V-Model expresses the relationships between each phase of the development life cycle forming typical V shape[26] (Figure 2). The overall job of Isotopo V-Model software development process starts with the initialization of main concept (which in our case was MIDA), then scientific requirements for operational scenarios have to be clearly described and to be strictly followed to model Isotopo. Later on following architected software designs, a real time system has to be developed using programming, which then has to be in house tested (integrated) and validated by scientists. The final step is to maintain Isotopo and if needed then repeat V-Model for software releases with more computational and feature updates.
3. Isotopo: UML Modelling
- As computational and empirical software systems development becomes more complex, scientific academias as well as commercial organizations require high-quality products in short time. Unfortunately usually wrong presumptions leads to direct software development without adopting software development life cycle and formal design modelling which gives a temporary and limited (scripted) solution and in the long run it is quite difficult to enhance and improve it. Software design modelling helps in dealing with complexity as the meta-model architecture provides abstraction and modification techniques which allows the designer to concentrate on the basis of a problem by reducing gratuitous details.Today, a better way of architecture modelling for a newly proposed software application is available in the form of Unified Modelling Language (UML). It is a modelling language, a well suited and the standard way of designing software application by creating different abstract models. UML is capable of facilitating software engineers stand alone and interconnected semiformal (Meta) design views for modelling software architectures[23]. Here software designs are created using UML principles to have better understanding of Isotopo in terms of its implementation, usage and working, Designed UML diagrams describe over all feature based functionality, user accessibility, experimental data flow, internal system work flow, system sequence, involved component’s integration and source code structure. In this manuscript we present following Isotopo UML diagrams: Use Case, Data Flow, System Sequence, Internal Work Flow, Component and Class Diagrams. This logical design presentation will give an overall physical view of the Isotopo focusing on its technical architecture, grouped functionalities, flow of information, operational perspective focusing on interface requirements and involved technologies during software design, development, deployment and testing.
3.1. Use Case
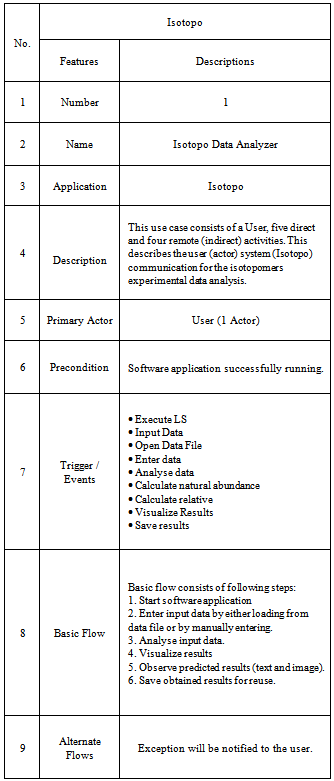
- Use case is the specific textual and visual method of presenting software application’s functionalities comprising all ways of user system interactions[27]. It consists of two main symbolic notations: Actor and Activities. In most of the cases actor is either user or system itself as a remote actor. Activity is the event triggered by the system in response to the request by actor for some action.We have designed a use case diagram (Figure 3) and explained in detail (Table 1). The designed use case diagram describes the user system communication for the isotopomers experimental data analysis, which consists of a user (actor), five direct activities (Execute LS, Input Data, Analyze data, Visualize Results, Save results) and four indirect activities (Open Data File, Enter data, Calculate natural abundance, Calculate relative).Use case diagram explains over all user system interaction. At first user needs to execute the software application Isotopo, then user can input experimental data in two ways to the software application for analysis, by entering manually and by loading experimental data file. After data inout, user can analyse it to calculate relative abundances. User can visualize obtained results by drawing a mass spectrum and also can save results in the form of an image file.
3.2. Data Flow Diagram (DFD)
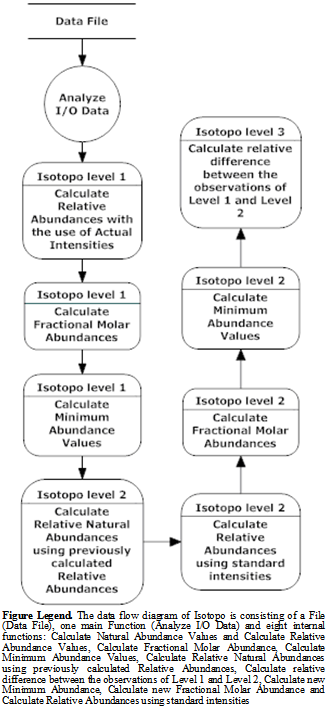
- Data Flow Diagram[28] presents the basic data flow inside the Isotopo Data Analyzer (Figure 4). Data has to be loaded from the Data File as input so called I/O Data, which will be then analysed by the system. Systematic analysis procedure is divided in to two levels. First level starts by calculating relative and natural abundances using actual intensities using user inputted experimental. Then fractional molar abundance values and minimum abundance values are calculated using already calculated relative and natural abundance values.In second level, again, new relative natural abundance values are calculated using previously calculated relative abundance values in level 1. Then relative abundance values are calculated using standard intensity values, inputted by user. Using these two newly calculated relative and natural abundance values, likewise level 1, fractional molar abundance and minimum values are calculated. In third level relative difference between the observations of level 1 and 2 is calculated.
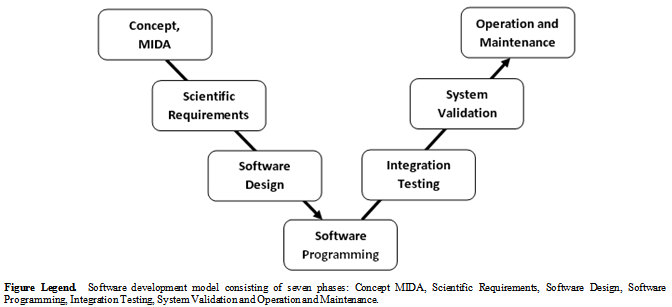 | Figure 2. Isotopo; V-Model Software Development Process |
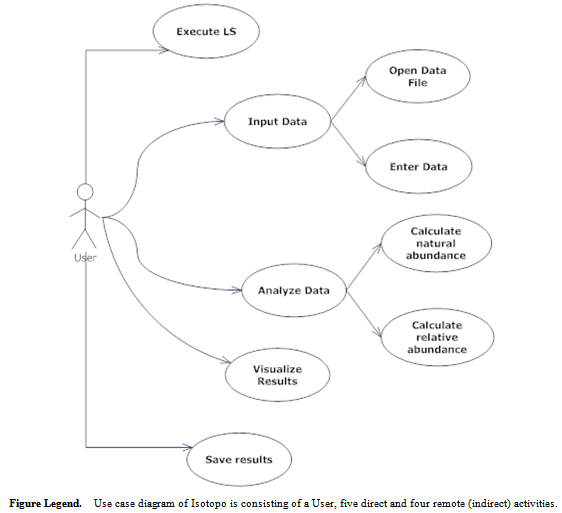 | Figure 3. Isotopo; Use Case |
|
3.4. System Sequence Diagram (SSD)
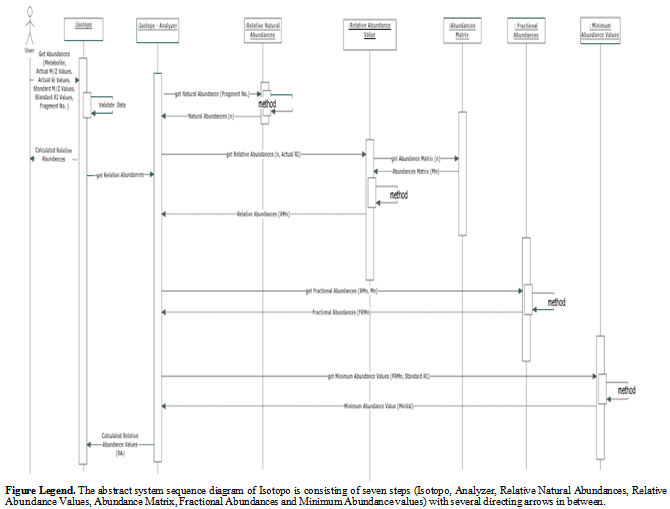
- The System Sequence Diagram represents a particular scenario (text or graphic) defined by use case, especially for transaction oriented systems[29]. A SSD consists of actors (users), messages (methods) called by the actors, return values (optional, if any) and loop indicators. The main reason of using SSD is to explore the logic of multifaceted operations (procedures or functions).The system sequence of Isotopo Analyzer is consists of seven sequential steps with individual tasks (Figure 5). At first the experimental data (Metabolite, Actual Mass to charge ratio (M/Z) Values, Actual Relative Intensity (RI) Values, Standard M/Z Values, Standard RI Values and Number of Fragments) has to be inputted to the system via the user via graphical user interface.
 | Figure 4. Isotopo; Data Flow Diagram |
 | Figure 5. UML System Sequence Diagram (SSD) |
3.3. Internal Work Flow Diagram
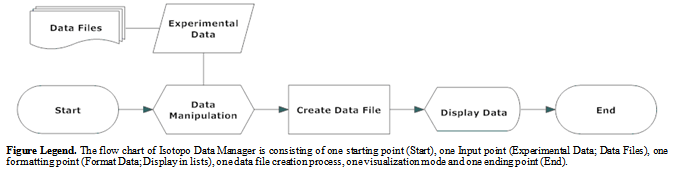
- Internal flow chart is also known as the Flow chart; a step by step visual representation of defined interlinked processes (operations) in a software application[30], categorized in different shaped boxes representing different kinds of operations connected by directional and unidirectional (associated) arrows. As the whole software application is divided in to two main modules: Data Analyzer and Data Manager. The internal work flow of Isotopo Data Analyzer (Figure6) starts with experimental data input from data file which then formatted by the system and resultant structured data will be displayed in graphical user interface of Isotopo Data Analyzer. Later selected data by the user from graphical user interface is taken by the system to calculate natural, relative, fractional molar abundances and minimum values with the ratio of two. Then differences between to transitional abundance values is calculated and based on the resultant information a spectrum will be drawn by the system, which will be presented in graphical form at graphical user interface for the user visualization and analysis. The internal work flow of the Isotopo data manager starts with experimental data manipulation (Figure 7), which leads to the experimental data extraction from existing data files and storing data by creating new data files. Furthermore it displays data loaded from data file into system and let user manipulate it by adding some new data, merging data from other files, deleting some data, and updating data.
3.5. Component Diagram
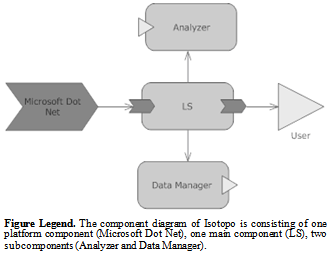
- Component diagram is the visual presentation of assembled constituents representing structural relationship between service provider and consumer[24].
 | Figure 6. Isotopo; UML Flow chart of Data Analyzer |
 | Figure 7. Isotopo; UML Flow chart of Data Manager |
 | Figure 8. Isotopo; UML Component Diagram |
3.6. Class Diagram
- Class diagram is the static representation of relationships between defined classes for the development of a software application[31],[32]. The source code of Isotopo will be divided into three namespaces i.e. SBEDA, System and ZEDGraph. SBEDA is the main namespace containing all related and newly developed source code classes, System is the by default namespace provided by C-Sharp language used during the software development, and this namespace is responsible for providing access to default language based controls and components. Namespace REDGraph is a third party application programming interface used mainly for the development of graphical visualization of statistical, mathematical and experimental data in the form of two and three dimensional colored bar charts.There are seven newly developed interlinked classes: Main, IsotopoDataAnalyzer, Isotopo DataManager, Isotopo About, Calculation, Complex and Matrix (Figure 9). As Isotopo is a multi document interface (MDI) application, Main MDI parent class which contains all other child classes. IsotopoDataAnalyzer is the multi attribute class developed as the graphical user interface of the Isotopo analyzer which provides all visual options to the user to load, edit, analyze and visualize experimental data and observed results. IsotopoDataManager is the multi attribute class developed as the graphical user interface of the Isotopo Data Manager which provides all visual options to the user for file based experimental data management and manipulation including entering, loading, editing, updating, deleting, merging, replacing and saving data in files. Calculations is the multi attribute class developed for performing all mathematical operations including mass value estimations, relative abundances, data parsing and different data format conversions.Matrix is the multi attribute class developed for performing matrix operations including drawing simple matrix of NxM rows and columns, calculation inverse and transpose of matrix. Complex is the multi attribute class developed for difficult mathematical operations including square root, absolute, tangent and operator overloading. IsotopoAbout is the single attribute class, providing information Isotopo and development team and research group. Main sequence of classes, starts with Main container class, which provides other graphical user interface based classes IsotopoDataAnalyzer, IsotopoDataManager and IsotopoDataAbout. IsotopoDataAnalyzer perform user system communication, let user enter, edit and visualize experimental data, and analyze experimental data by directly using class Calculations which the uses classes i.e. Matrix and Complex. IsotopoDataManager is an independent multi attribute class performing operations including user system communication for file based data management and manipulations.LeastSquareDataManager is the multi attribute class developed as the graphical user interface of the Isotopo Data Manager which provides all visual options to the user for file based experimental data management and manipulation including entering, loading, editing, updating, deleting, merging, replacing and saving data in files. Calculation is the multi attribute class developed for performing all mathematical operations including mass value estimations, relative abundances, data parsing and different data format conversions.
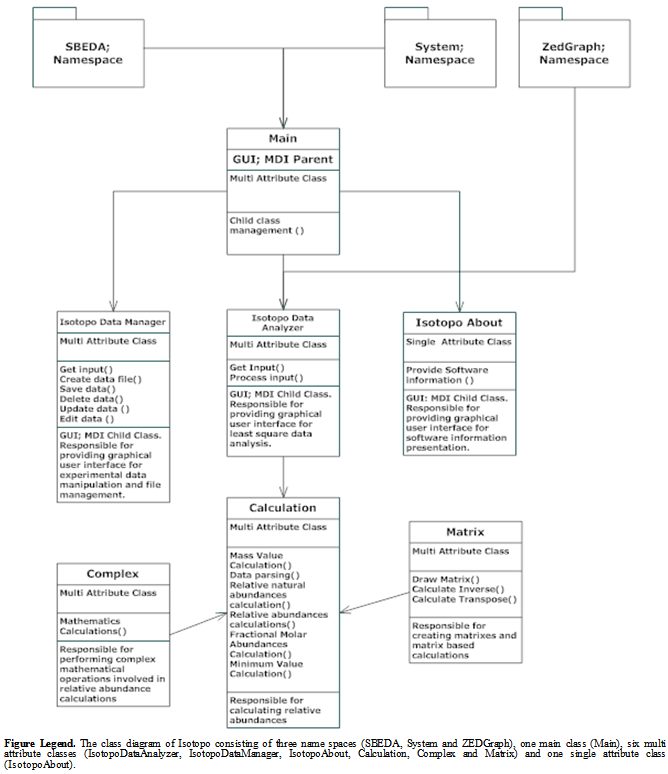 | Figure 9. Isotopo; UML Class Diagram |
 | Figure 10 (a). Designed Main Graphical User Interface |
4. GUI Design
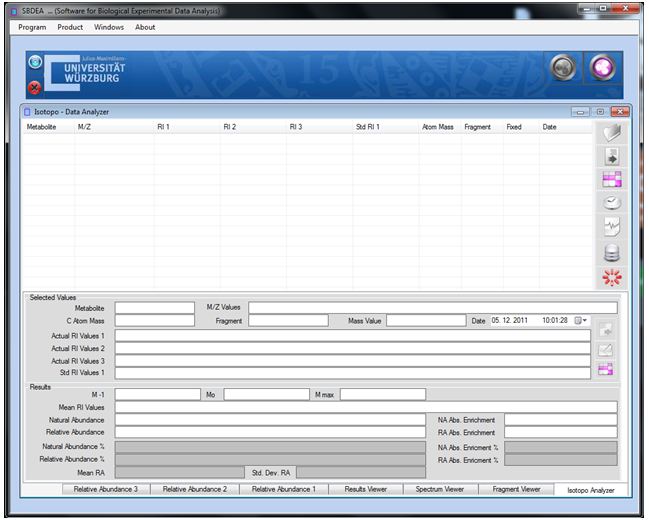
- This section intends to provide an overview of Graphical User Interface (GUI) designing and basic understanding of the proposed Isotopo GUI. Targeting the challenge of the proposition of designing a standardized graphical user interface, a review research is conducted in a chosen the field i.e. Human Computer Interaction (HCI), to have complete understanding of graphical user interface design and development. HCI is renowned as Human Machine Interface (HMI); the study of designing, evaluating and implementing interactive computing systems for human use[33]. Designing High quality HCI design is difficult to implement because of many reasons: market pressure of less time development, rapid functionality addition during development, excessive several iterations, competitive general purpose software and human behaviour analysis.Designing human computer interaction interface is an important and a complex task, but it could be simplified by decomposing task into subcomponents and maintaining relationships among those subcomponents. Task decomposition is a structured approach, applicable in both Software Engineering and Human Computer Interaction (HCI) fields depending on specific processes and design artifacts. Using design artifacts applications could be made for analysis and design by making the hand draw sketches to provide high level of logical design based on user requirements, usage scenarios and essential use cases. To design hand drawn sketches there are some strategies to be followed .i.e., planning, sequential work flow, and levels of details. While evaluating or designing a user interface, it is important to keep in mind the HCI design principles. There are four major HCI design principles .i.e., Cooperation, Experimentation, Contextualization, Iteration and Empirical Measurement[33].Like software engineering design patterns there are some graphical user interface design patterns (Window Per Task, Direct Manipulation, Conversational Text, Selection, Form, Limited Selection Size, Ephemeral Feedback, Disabled Irrelevant Things, Supplementary Window and Step-by-Step Instructions) needs to be strictly followed in software graphical user interface design. These patterns help designers in analysing already designed graphical interfaces and designing a user friendly and required on demand graphical interface.As the proposed software will probably be used by the scientist belonging to the fields of Biology and related fields (e.g. Biochemistry etc.), the major need of the design is to be simple and easy to use, as most of the time people belonging to aforementioned fields are not interested in learning and spending time familiarizing their selves to new software application. The designed graphical user interface[34] of Isotopo Data Analyzer is presented in Figure 10 and Data Manager in Figure 11. The graphical user interface of Isotopo data analyzer consists of 10 main controls: open data file, clear all text controls, measure selected data, process all data, remove selected data, open data manager, close Isotopo, selected values and results. Moreover the graphical interface is divided into seven views: Isotopo Analyzer, Fragment Viewer, Spectrum Viewer, Result Viewer, Relative Abundance 1, Relative Abundance 2 and Relative Abundance 3.The graphical user interface of Isotopo Data Manager consists of 16 main controls: open data file, clear all text controls, close isotopo data manager, add new values, update edited values, clear text fields, save data in file, select values to edit, delete values, create new data file, select source directory, save file, cancel creating file, data view, Open Isotopo Data Analyzer and Open Isotopo Data Viewer.
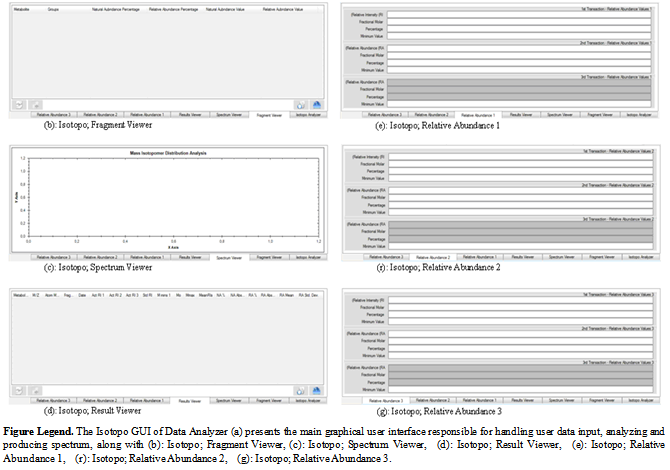 | Figure 10. Isotopo; Designed Main and Analyzer Graphical User Interface |
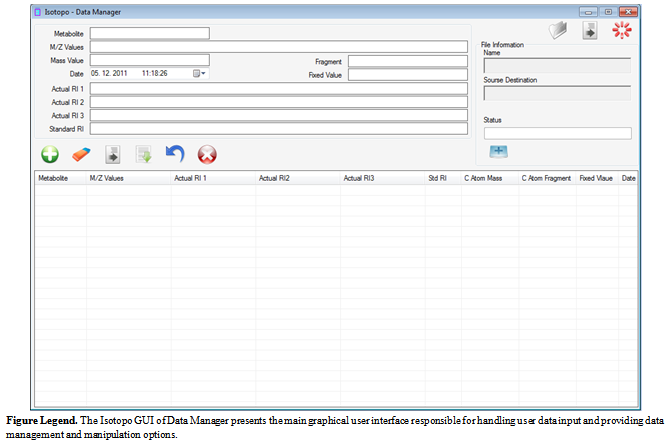 | Figure 11. Isotopo; Designed Data Manager Graphical User Interface |
5. Conclusions
- In this manuscript we have presented newly proposed and formally modelled bioinformatical software for mass isotopomers distribution analysis. This manuscript thus provides guidance in advance for using the release of the architected meta-models and designed user interface of IsotopoNow we are looking forward to successfully implement designs using V-Model software development model.
ACKNOWLEDGEMENTS
- We (authors) are thankful to the Department of Bioinformatics, Biocenter, University of Wuerzburg Germany for giving us the opportunity to work on this research. We are thankful to the editor for considering, blind reviewers for reviewing and publishers for publishing this manuscript. We thank German Research Foundation (DFG)[TR34-Z1] for funding this research.
AUTHOR’S Contribution
- Zeeshan Ahmed architected software designs and drafted manuscript as the First and Corresponding Author. Saman Majeed contributed in writing of the manuscript as co-author. Prof. Thomas Dandekar Lead and guided the study. All authors participated in evaluation of the architecture designs as well as writing of the manuscript.