-
Paper Information
- Previous Paper
- Paper Submission
-
Journal Information
- About This Journal
- Editorial Board
- Current Issue
- Archive
- Author Guidelines
- Contact Us
Software Engineering
p-ISSN: 2162-934X e-ISSN: 2162-8408
2012; 2(1): 7-13
doi: 10.5923/j.se.20120201.02
Towards the Development of K-Map Model in Visualizing the Dengue Hotspot Using Venn Diagram and AHP Technique
 Abstract
 Reference
 Full-Text PDF
 Full-Text HTML
Az-Azira Abdul Aziz , Rusli Abdullah, Hamidah Ibrahim
Faculty Science Computer and Information Technology, University Putra Malaysia, Serdang Selangor, Malaysia
Correspondence to: Az-Azira Abdul Aziz , Faculty Science Computer and Information Technology, University Putra Malaysia, Serdang Selangor, Malaysia.
| Email: |  |
Copyright © 2012 Scientific & Academic Publishing. All Rights Reserved.
This study was performed as a formulation process for the K-Map model development in order to visualize the dengue hotspot. Purpose of this study is to find the appropriate technique on knowledge visualization and also to identify the contributing parameters for the dengue outbreak. Methodology that has been used is by analysing the literature review from empirical paper and the priority level of parameter was determined by using Analytical Hierarchy Process (AHP) technique. Result from this study shows that Venn diagram is one of the technique that can be used to visualize the dengue hotspot while the environmental parameter is one of the contributing factors in dengue transmission and distribution. Ten environmental parameters that are land use, housing types, Elevation, Land Surface Temperature (LST), Soil Moisture (Wetness), Greenness (Vegetated and Non-vegetated), Population Density, rainfall, temperature and humidity have been identified. As a conclusion, climate change impact is one of the environmental parameter, which influences the trend of dengue transmission and distribution. The impact of climate change on the transmission patterns of dengue diseases can be both direct and indirect. A direct impact describes how the changes in precipitation and temperature trend can influence the trend of the dengue transmission and distribution pattern. Instead indirect impact describe how the factors such as human population dynamics and their effects on exposure risk, changes in vegetation, hydrology and other landscape features can influence the trend of dengue transmission and distribution pattern.
Keywords: Literature Review, Environmental Parameter, Knowledge Map, Knowledge Visualization and Dengue Hotspot
Article Outline
1. Introduction
- K-Map today has ever expanding application in science, education, engineering and environmental health especially in disease phenomena like dengue. As we know dengue is a dangerous infectious disease, which could bring mortality, and until today there are no medicine or antidote to cure it. Although the authorities have adopted various preventive measures, dengue fever cases still rises from year to year. This scenario requires a more effective monitoring system, such as a schematic control activity of dengue, in high- risk places of dengue fever occurrence. One of the most important information that can be used in controlling dengue is a Dengue Hotspot Map. This map should be produced quickly in order to take immediate action to control dengue from spreading. Ministry Of health (MOH) Malaysia in their Strategic Plan 2006-2010 also needs a Dengue Hotspot to be produced frequently for the purpose of notification to public for awareness and decision making process. Any delay in notification will increase the risk of dengue transmission in the locality of the residence.Yasin and Egbu[27] in their study has revealed that the main benefits of K-Map in evaluating facilities performance are: improvements in decision making process, problems identification and problem solving by providing quick access to critical information, knowledge gaps and island of expertise. Because the urgency of the dengue hotspot information and also the advantage that K-Map has, there is a great need to develop new model using K-Map in order to expedite the process of getting the information.K-Map is one of the important processes in Knowledge Management (KM). It is a user interface element similar to a graphical organizer, which displays connections between data by a series of shapes (or images) representing ideas and arrows representing relations between them. It is a form of knowledge visualization and is also known as a Concept Map (CM). CM is a general method; it is particularly useful for helping social researchers and research teams develop and detail ideas for research. Essentially, CM is a structured process, focused on a topic or construct of interest, involving input from one or more participants, that produces an interpretable pictorial view of their ideas and concepts and how these are interrelated. It is a diagram showing the relationship among the concepts. They are graphical tool for organizing and representing knowledge (wikipedia). CM is not only a powerful tool for capturing, representing, and archiving knowledge of individuals, but also a powerful tool to create new knowledge.The main advantage of K-Map is to improve decision-making and problem solving because it provides applicable information. From the K-Map it is easy to find the key sources of knowledge creation and moreover can quickly access to critical information. Beside that, by using the K-Map it encourage reuse of information and prevent reinvention of knowledge.Analysis from the literature review has been done to find out the appropriate technique that can be used to develop the K-Map model. In formulation process, there seven dengue parameters that have a role in influencing the trend of the dengue transmission and the pattern of the dengue distribution has been identified. It is important to prioritise the parameters before they can be used as input to the model. In many situations it is extremely difficult to assign relative weights to the different criteria involved in making a decision on determination of priority level for each dengue parameter. Therefore it is necessary to adopt a technique that allows an estimation of the weights. One such technique is the Analytical Hierarchy Process (AHP).
2. Literature Review
- Most previous work focuses on K-Map and knowledge visualization technique. K-Map is defined as the process, methods and tools for analysing knowledge areas in order to discover features or meaning and to visualize them in a comprehensive, transparent form such that the business-relevant features are clearly highlighted[22]. Previous research[10] have found that capturing and representing knowledge is critical in KM, so they was using K-Map as a tool for representing knowledge and also suggest a roadmap for building the K-Map. Stanford[20] define it as follows: “K-Map quite simply is any visualization of knowledge beyond textual for the purpose of eliciting, codifying, sharing, using, and expanding knowledge”. Graphic symbols play a key role in each K-Map; their positions and spatial relationships are mostly expressed with the use of arcs or edges. The K-Map must show a progression of ideas with relationships beyond their being just spatial. K-Map includes conceptual relationships, such as chronological, hierarchical, associative, causal, logical and evaluative[20]. Each knowledge map as a special type of reality model, for instance, a reality image, simplifies the visualization of reality.Knowledge Visualization examines the use of visual representations to improve the transfer and creation of knowledge between at least two people[1-3]. Knowledge Visualization thus designates all graphic means that can be used to construct and convey complex insights. Beyond the mere transport of facts, Knowledge Visualization aims to transfer insights, experiences, attitudes, values, expectations, perspectives, opinions, and predictions. And this in a way that enables someone else to re-construct, remember, and apply this knowledge correctly. According to[2] six formats can be distinguished in Knowledge Visualization: Heuristic Sketches, Conceptual Diagrams, Visual Metaphors, Knowledge Animations, Knowledge Maps, Domain Structures.There are few techniques in knowledge visualization can be applied in KM such as Decision Tree, Venn Diagram, Chart, Matrix and so on. Table 1 shows a few techniques in knowledge visualization that has been applied by previous researchers. Kandogan[9] in their study on Multi- dimensional Visualization Technique with Uniform Treatment Dimensions was used Star Coordinates to support users in early stages of their visual thinking activities. It uses simply points to represent data, treating each dimension uniformly at the cost of coarse representation. Faisal[5] was used Self Organizing Map (SOM) technique in their study for visualizing, understanding and exploring the significant of Bio-impedance Analysis parameters to differentiate between the dengue patient and the healthy patient.
3. Methodology
- In order to develop the K-Map model in visualizing the case of hotspot in dengue, we are standing by introducing the following steps:- Analysis the Literature Review from Empirical PaperAnalysis the literature review from empirical paper is very important to study the problem and find out the appropriate technique that can be used to develop the K-Map model. In order to develop the model there is a need to identify the parameter that contribute to dengue outbreak. From the literature, it was found that the environmental parameter is one of the contributing factors in dengue transmission and distribution. Climate change impact is one of the environmental parameter, which influences the trend of dengue transmission and distribution. The impact of climate change on the transmission patterns of these diseases can be both direct and indirect. A direct impact describes how the changes in precipitation and temperature trend can influence the trend of the dengue transmission and distribution pattern. There are several examples of environment factors which give an indirect impact to the trend of dengue transmission and distribution pattern such as human population dynamics and their effects on exposure risk, changes in vegetation, hydrology and other landscape features.- Identification of ParametersProcess identification of parameters is very important in order to develop the model of K-Map. All the parameters that might contribute to dengue outbreak will be consider in selecting the appropriate parameter. The parameters selected in this study are based on the previous finding by others researcher that might suggest several environmental parameters that which they found might contribute to the dengue occurrence. From the literature review (empirical paper) as well as expert opinion, it was found that the lists of environmental parameters that contribute to dengue outbreak are as land use, housing types, land surface temperature, soil moisture, greenness and elevation. Others parameter that relate to climate change such as rainfall, temperature and humidity were also been selected because it has directly influences the presence, development, activity and longevity of pathogens and vectors. Beside that, population density also been identified as having an influence on dengue transmission and distribution. - Determine Priority Level of ParametersSubsequently, priority level of the identified parameters has been determined in order to study the most significant parameters as well as to visualize their relationship. This priority level has been determined based on their intensity level of influences to dengue outbreak. The process for determines priority level of parameters is performing in three stages: Ranking of parameters, Classification of parameters and Risk score of parameters. In the ranking stage, the percentage of all the identified parameters were determine due to their intensity level of influences to the dengue outbreak. The highest percentage was given to the parameter that is the most significant influence to the outbreak problem and instead. The next stage is the classification process of each parameter to their detail attribute and the last stage is the process of determination the risk score value for each attribute. Another technique that been used in this study to determined the priority level of parameter is Analytical Hierarchy process (AHP) technique. AHP is a structured technique for organizing and analyzing complex decisions and was developed by[18]. This technique is based on mathematics and psychology. It can helps decision makers find one that best suits their goal and their understanding of the problem. It provides a comprehensive and rational framework for structuring a decision problem, for representing and quantifying its elements, for relating those elements to overall goals, and for evaluating alternative solutions.Even though AHP is a best technique to determine the priority level of dengue parameter but it is important make a comparison between this technique and previous research to ensure that level of priority that has been given is logic and correct.- Formulation a New K-Map ModelThe Last step is to formulate a new K-Map model. As mention before in Section 2.0, VD is one of the technique that can be used to develop a new K-Map model and to visualize the level of dengue in term of its seriousness or in other word is called dengue hotspot. Due to that, the technique of VD will be applied for this study in order to develop the new model. Using the ten environmental parameters that has been identified before will develop this new model and this developed model can be used as a prototype by health agency and the local authorities to enhance the effectiveness of dengue surveillance and mitigation programmed which can aid in decision-making process.
|
4. Results and Discussion
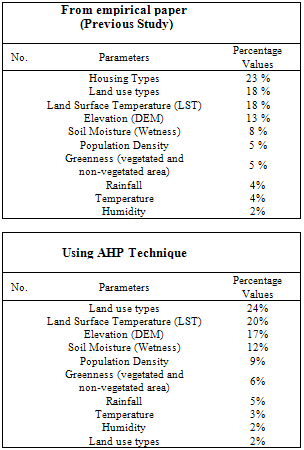
- Result from the analysis of empirical paper as well as the expert opinion, it was helped us to identify and classify the priority level of dengue parameters that can be used to develop the K-Map model as shown in Table 2 and Figure 1. Most of previous study have been discussed about the main drivers for dengue outbreak encompasses land use, housing types, land surface temperature, digital elevation model (DEM), soil moisture (wetness), greenness (vegetation), population density, rainfall, temperature and humidity.Many studies before this have noted that the environmental parameter is one of the contributing factors in dengue transmission and distribution. Climate change impact is one of the environmental parameter, which influences the trend of dengue transmission and distribution. The impact of climate change on the transmission patterns of these diseases can be both direct and indirect. A direct impact describes how the changes in precipitation and temperature trend can influence the trend of the dengue transmission and distribution pattern. There are several examples of environment factors which give an indirect impact to the trend of dengue transmission and distribution pattern such as human population dynamics and their effects on exposure risk, changes in vegetation, hydrology and other landscape features.Subsequently, priority level of the parameters has been determined in order to study the most significant parameters as well as to visualize their relationship. However, the main reference of priority level has been determined based on study by[23]. In their study, all the identified parameters were been tested with the dengue case distribution to measure their significant relationship between the trends of case distribution with the environmental condition. This test is significant as it can be used to measure the contribution of the parameters to the dengue transmission and distribution pattern. It is important to check the significant correlation for each parameters, there for the inputs parameters that been selected are more valuable.
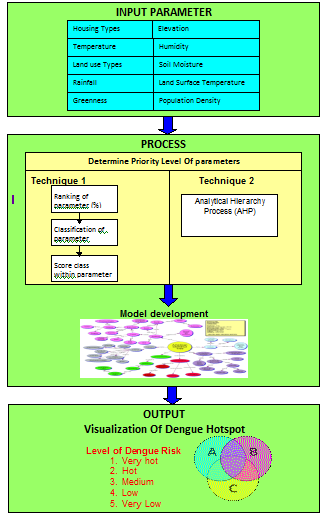 | Figure 1. System Context Diagram |
|
5.Conclusions
- In conclusion, a process-based classification of K-Map is highly needed in order to develop application model. The classification of environmental parameters is required to develop model due to visualize dengue hotspot since it is one of the contributing factors in dengue transmission and distribution. Housing types act as a major contributor; followed by land use type, land surface temperature, elevation, soil moisture, population density and greenness. However climate change factors including rainfall, temperature and humidity show less impact due to influence the dengue outbreak. Furthermore priority level is important due to check the significant correlation for each parameter. Therefore the inputs parameters that been selected are more valuable.The AHP method commonly used in multi criteria decision-making exercise was found to be a useful method to determined the weights. Compared with other methods used to determining weights, the AHP method is superior because it can deal with inconsistent judgements provides a measure of the inconsistency of the judgement of the respondent.
References
| [1] | Burkhard, R., (2004) .: "Learning from Architects: The Difference between Knowledge Visualization and Information Visualization"; Eight International Conference on Information Visualization (IV04), London, July, (2004). |
| [2] | Burkhard, R.,( 2005).: "Towards a Framework and a Model for Knowledge Visualization: Synergies between Information and Knowledge Visualization"; Knowledge and Information Visualization: Searching for Synergies. Tergan, S.-O. and Keller, T. Springer Lecture Notes in Computer Science, Heidelberg / New York (2005). |
| [3] | Eppler, M. and Burkhard, R.,( 2005).: "Knowledge Visualization"; Encyclopedia of Knowledge Management. Idea Group (2005). |
| [4] | Focks D, Haile D, Daniels E, Mount G. Dynamic life table model for Aedes aegypti (L) (Diptera: Culicidae). Analysis of the literature and model development. J Med Entomol 1993; 30: 1003–17. |
| [5] | Faisal.T, Ibrahim.F, Taib.M.N (2008) Determination of the Bioimpedance Analysis Parameters in Dengue Patient using the Self Organizing Map ,4th Kuala Lumpur international conference on Biomedical Engineering, Proceedings 21, pp.10-173, 2008 |
| [6] | Hales.S, Wet.N.D, Maindonald.J, Woodward.A (2002) Potential effect of population and climate changes on global distribution of dengue fever: an empirical model THE LANCET • Published online August 6, 2002 •http://image.thelancet.com/extras/01art11175web.pdf |
| [7] | Humphrey.M,Cunningham.S.J and Witten.I.H :Knowledge visualization techniques for machine learning, Intelligent Data Analysis Volume 2, Issues 1-41998, Pages 333-347 |
| [8] | Jafari.M, Akhavan.P, Bourouni.A, Amiri.R.H, Iran Universiti of Science and Technology, Tehran (2009) : A Framework for the Selection of Knowledge Mapping Techniques, Journal of Knowledge Management Practice, vol. 10, No 1, March 2009 |
| [9] | Kandogan.E (2000).Star Coordinates: A Multi-dimensional Visualization Technique with Uniform Treatment of Dimensions. Proceedings of the IEEE Information Visualization Symposium |
| [10] | Kim,S., Suh,E. and Hwang,H. (2003): Building the knowledge map: an industrial case study. Journal of Knowledge Management, Vol 7, No 2 |
| [11] | Novak.J.D and Canas.A.J (2006):The theory Underlying Concept Maps and How to Construct and Use Them. Technical Report IHMC CmapTools 2006-01 Rev 2008-01 |
| [12] | Meade, M.S., J.W.Florin, and W.M. Gesler.1998.Medical Geography. The Guilfford Press, New York. |
| [13] | Nhan.N.T, Phuong.C.X.T, Kneen.R, Thuy.P.T.T, Thien.C.V, Nga.N.T.T, Thuy.T.T, Solomon.T, Stepniewska.K, Wills.B and The Dong Nai Study Group (2004) : Clinical Diagnosis and Assessment of Severity of Confirmed Dengue Inffection in Vietnamese Childdren Is The World Health organization Classification System Helpful? Am.J.Trop.med.hyg, 70(2), 2004, pp.172-179 |
| [14] | Pan American Health Organization (PAHO, 1994): The emergence of epidemic dengue fever and dengue hemorrhagic fever in the Americas: a case of failed public health policy, available athttp://journal.paho.org/uploads/1138059937 |
| [15] | Patz,J.(1998) Global warming would foster spread of dengue fever into some temperature regions. Science daily Research News:March 1998http://www.sciendaily.com/releases/1998/03/980310081157.htm[accessed 20 October 2004] |
| [16] | Robert T. Watson, Jonathan Patz, Duane J. Gubler, Edward A. Parson and James H. Vincent (2005): Environmental health implications of global climate change.Journal of environmental Monitoring |
| [17] | Ruskey, F.; Weston, M. (2005): A Survey of Venn Diagrams. Department of Computer Science, University of Victoria. The Electronic Journal of Combinatorics, ed.June 2005 |
| [18] | Saaty, T. L. 1990. The Analytic Hierarchy Process. RWS Publications, USA. |
| [19] | Seng.S.B, Chong.A.K, Moore.A (2005): Geostatistical Modelling, Analysis and Mapping of Epidemiology of dengue Fever in Johor State, Malaysia. The 17th Annual Colloqium of the Spatial Information Research Centre Universiti of Otago, Dunedin, New Zealand |
| [20] | Stanford, X. (2001): Map Your Knowledge Strategy, Information Outlook, Vol. 5, No. 6, Special Libraries Association,[online journal],http://www.sla.org/content/Shop/Information/infoonline/2001/jun01/stanford.cfmWikipedia, the Free Encyklopedia[online], http://en.wikipedia.org |
| [21] | Subrt,T., and Brozova,H.(2007) “Knowledge Maps and Mathematical Modelling”. The Electronic Journal of Knowledge Management Volume 55 Issue 4, pp 497-504, available online at www.ejkm.com |
| [22] | Speel P.H., Shadbolt, N., de Vries,W Van dam P.H., and O’Hara,K. (1999), “Knowledge mapping for industrial purposes”’, Albertaq, Canada, no. October. |
| [23] | Umor, S., Mokhtar, M., Surip, N., Ahmad A (2008); Generating a Dengue Risk Map (DRM) based on environmental factors using Remote Sensing and GIS technologies Available online: http://www.aars-acrs.org/acrs/proceeding/ACRS2007/Papers/TS27.4.pdf |
| [24] | World Health Organization (WHO) 1999, Regional Guidelines on Dengue/DHF Prevention and Control (Regional Publication 29/1999). Clinical Manifestations and Diagnosis |
| [25] | World Health Organization (WHO) 2003, Climate Change and Human Health- Risk and Responses |
| [26] | World Health Organization (WHO,2009):Media center , Dengue and dengue haemorrhagic fever. Available at http://www.who.int/mediacentre/factsheets/fs117/en/index.html |
| [27] | Yasin, F and Egbu, C (2010) Exploitation of knowledge mapping benefits in the facilities performance evaluation process: a conceptual framework. In: Egbu, C. (Ed) Procs 26th Annual ARCOM Conference, 6-8 September 2010, Leeds, UK, Association of Researchers in Construction Management, 799-808. |
| [28] | Duc.T.T (2006):Using GIS and AHP Technique for Land use suitability Analysis: International Symposium on Geoinformmatics for Spatial Infrastructure Development in Earth and Allied Sciences. |