-
Paper Information
- Previous Paper
- Paper Submission
-
Journal Information
- About This Journal
- Editorial Board
- Current Issue
- Archive
- Author Guidelines
- Contact Us
Software Engineering
p-ISSN: 2162-934X e-ISSN: 2162-8408
2011; 1(1): 24-31
doi: 10.5923/j.se.20110101.03
TOUCH-SUV: a Touchscreen-Assisted Tool for Quantitative, Reproducible, Clinically Feasible and Collaborative Diagnostic Reporting of Whole-Body PET-CT Studies
 Abstract
 Reference
 Full-Text PDF
 Full-Text HTML
Alessandro Stefano 1, Francesca Gallivanone 2, Eleonora Grosso 1, Cristina Messa 1, 3, Luigi Gianolli 4, Maria Carla Gilardi 1, 2, Isabella Castiglioni 2
1LATO HSR Giglio, Cefalu’ (Palermo), 90015, Italy
2IBFM-CNR, Segrate (Milan), 20090, Italy
3University of Milan-Bicocca, Milan, 20126, Italy
4H S. Raffaele Institute, Segrate (Milan) , 20090, Italy
Correspondence to: Isabella Castiglioni , IBFM-CNR, Segrate (Milan), 20090, Italy.
| Email: |  |
Copyright © 2012 Scientific & Academic Publishing. All Rights Reserved.
The software package Touch-SUV has been developed and implemented as a user-friendly tool allowing quantitative, reproducible, clinically feasible and collaborative diagnostic reporting of whole-body PET-CT oncological studies. The tool takes advantages of: a) an innovative method allowing accurate and precise quantification of Standardized Uptake Value (SUV) from PET-CT images, b) breakthrough image visualization/manipulation technologies allowing easy extraction of complex regional geometric parameters, and c) collaborative tools for cooperative reporting of PET-CT images among different investigators at distant sites. Clinical feasibility has been assessed by applying the use of Touch-SUV on the diagnostic quantitative reporting of real oncological whole-body PET-CT studies.
Keywords: Software Package, PET-CT, Image Analysis, Quantification, PVE, Bone Metastases
Cite this paper: Alessandro Stefano , Francesca Gallivanone , Eleonora Grosso , Cristina Messa , Luigi Gianolli , Maria Carla Gilardi , Isabella Castiglioni , "TOUCH-SUV: a Touchscreen-Assisted Tool for Quantitative, Reproducible, Clinically Feasible and Collaborative Diagnostic Reporting of Whole-Body PET-CT Studies", Software Engineering, Vol. 1 No. 1, 2011, pp. 24-31. doi: 10.5923/j.se.20110101.03.
Article Outline
1. Introduction
- Molecular imaging with radiotracers (e.g. Fluorodeoxi-glucose, 18F-FDG) and Positron Emission Tomography (PET) is the standard diagnostic technique for the in vivo and non-invasive detection of many oncological diseases [1-5]. Thanks to the current generation multi-modal PET-Computerized Tomography (CT) systems, functional information of cancer cells are nowadays spatially and temporally correlated with anatomical information[6], thus, detected oncological lesions can be better localized and qualitatively characterized. Nevertheless, quantitative analysis of radiotracer uptake in PET oncological studies is important to differentiate benign and malignant lesions, to assess tumour aggressiveness and to monitor therapy response[7-9]. Unfortunately, as a consequence of the PET limited spatial resolution (few millimetres), small oncological lesions (few centimetres) are affected by a physical effect known as “Partial-Volume Effect” (PVE) [10-11]. PVE causes a severe underestimation of radiotracer uptake and hinders accurate quantification.Software tools for PET-CT image manipulation today available, both integrated and not integrated with the acquisition systems (e.g. MRIcro[12], Analyze[13], ImageJ [14], Xeleris[15], Advange[16], Syngo.Via[17], Siemens PERCIST tool[18], Syntegra[19]), satisfy qualitative image analysis, but usually lack in some important areas. In particular they do not allow PVE correction (thus they do not provide quantitative reporting), they do not support operator-independent image analysis, they do not facilitate collaborative image analysis[20-21], and they do not allow code manipulation and customization.Aim of this work was the development, implementation and validation of a software tool designed for quantitative, reproducible, clinically feasible and collaborative diagnostic reporting of whole-body PET-CT studies. The software (Touch-SUV) includes an innovative operator-independent algorithm for the PVE correction of oncological lesions[22] making possible quantitative and reproducible reporting of whole-body PET-CT studies.Implemented on a low cost touchscreen technology system, Touch-SUV takes advantage from a tactile product allowing image visualization and manipulation on touch screen monitor that can be oriented vertically or horizontally dependently from the desired use (e.g. vertically for image evaluation or horizontally for writing report), in addition to the possibility to work in sterile environment. Supporting a variety of features for collaborative diagnostic reporting, the proposed software tool is particularly suitable for remote applications (e.g. multicentric evaluations, telediagnosis, teleconsulting) with current and next-generation touchscreentechnology-assisted devices, also from domestic market (e.g. smartphones, iPAD).
2. Materials and Methods
- Touch-SUV can be implemented with a standard or touchscreen hardware, on condition that a minimum Ram of 1GB (2GB is recommended) is installed for a 32-Bit system, due to the large software memory footprint. A 64-Bit operating systems allows to achieve the best performances.The software runs under Windows and has been implemented into the Desktop PC HP TouchSmart IQ820, equipped with a 25.5-inch touch screen, 1920 x 1200 pixels resolution, Intel processor Core™2 Duo P7450, 4 Giga byte RAM. Graphical acceleration is provided by a NVIDIA® GeForce™ 9600M GS HD graphic card, with 512 MB dedicated memory (expandible up to 2303 MB memory). The native operating system is Windows Vista Home Premium with Windows Media Center (64-bit). Touch-SUV has been registered at the Italian Society for Authors and Editors (SIAE) in 2009[23].
2.1. Touch-SUV Architecture Design
- The system architecture of the Touch-SUV software tool consists into three layers (figure 1):• The first layer is the interactive Graphical User Interface (GUI), optimized for the touchscreen technology, which receives the user input.• The second layer is the Touch-SUV Model, which processes the user requests. • The third layer is the language environment, which support image/data handling and processing.
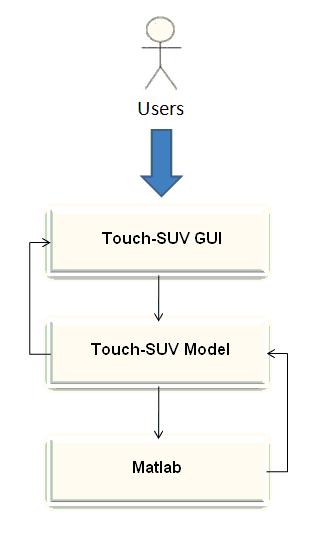 | Figure 1. The Touch-SUV architecture |
2.2. Software Design
- The Touch-SUV software has been developed in Matlab R2008b, a matrix oriented programming environment[24]. The Matlab standard toolbox was used, including Processing Toolbox, Statistic Toolbox and Curve Fitting Toolbox. Ad-hoc utilities were implemented with Java languages[25]. The front-end layout were implemented with the goal to allow a simple, user-friendly graphical interface.
2.2.1. Reading, Writing and Storing Patient, Scan and Image Data
- Functions to open, read, and store image file from PET and CT whole-body studies in DICOM and INTERFILE format have been implemented.Patient and scan information are directly read from the image header file of the DICOM/INTERFILE PET-CT whole body studies and stored in a Touch-SUV Information File (IF). Data are shown in a patient and scan box and can be modified if necessary to include additional data: data needed for PET quantification (e.g. patient weight, radiotracer injection time, administered and residual radiotracer to the patient) can be manually entered and/or modified in the patient and scan box and stored in IF.
2.2.2. Viewing PET, CT and PET-CT Images
- Access functions have been implemented to allow the selection of transaxial slices from both the whole body coronal images or from a numerical slice selection. Functions to enable contemporary visualization of transaxial, coronal and sagittal projections of both PET and CT images have been realized.An automatic co-registration function of PET and CT image modalities has been performed. The fused image is visualized by making PET images transparent by means of openGL rendering, providing a re-sizing of Field Of View (FOV) in order to allow the same FOV for both PET and CT images. A bicubic-spline function has been included, in order to create smoothed images for visualization purposes, and can be excluded from PET images on demand. The image dimensions are handled in terms of real world units (cm).
2.2.3. Manipulating PET, CT and PET-CT Images
- A user friendly graphical interface, including zoom/pan, utility bottoms, sliders, image selection buttons, has been implemented and functions are activated with manual touch or stylus input. When zoom is applied to a transaxial PET image, all transaxial images are automatically resized. The slice control section allows to scroll through the images clicking over the images, or using the slider, or directly entering a slice number. A proper tool allows to visualize pixel position and pixel intensity on the selected PET image by clicking over the PET image with the cursor.Pre-defined colour tables (e.g. gray, hot, jet and rainbow scales) have been implemented and can be chosen by a list in the selection menu. The fused PET-CT color scale has been realized by the concatenation of two color maps (gray and PET color table). A color bar can be used to modify the current color map dragging it with the touch/stylus to interactively alter the brightness and contrast of the image.Region of interests (ROI) can be defined on every transaxial images, on PET, on CT or on fused PET-CT images, by using manual touch or stylus input along the desired trajectory[26]. The drawn ROI can be copied on transaxial corresponding images of both PET and CT modality. Different kinds of ROI have been implemented:• irregular ROI: free-hand ROI can be drawn following the lesion contour on image and offering optimal adherence between contour and unique performances for lesions with complex structures;• thresholded ROI: iso-contourned ROI at a percentage of maximum intensity of lesion radiotracer uptake on PET images (between 40% and 90% with increments of 10%) are automatically drawn on images[27]. Stylus/finger input defines the location of the maximum pixel value and the neighbourhood of the maximum. Functions calculate a lesion contour defined by the intersection between the lesion uptake profile and the horizontal plane at a definite threshold of the maximum lesion uptake and represents it as a closed polygon;• circular ROI: circular ROIs can be drawn with centre manually defined on the image by the operator and radius that can be manually modified by the operator. ROI can be modified, translated on different images using stylus dragging, copied and pasted from one image to another. ROI are always automatically saved and they can be subsequently loaded for further analysis. For each ROI the following values are calculated: area, volume, radioactivity, radioactivity concentration, maximum radioactivity concentration, SUV normalized for the body weight, for the lean body mass and for the body surface area (maximum and mean)[28]. The radioactivity is corrected for the time between the injection and the start time of the PET acquisition. The area of ROI is determined by the sum of the fractions of all pixels occupied by the ROI. All statistics are automatically calculated and written to an Excel file. This approach allows data files to be easily viewed and manipulated also externally to the Touch-SUV program.
2.2.4. Collaborative Analysis
- A dedicated tool was developed to provide a collection of transaxial/coronal projections of PET images over which annotations and texts can be added for collaborative purposes and printed on film or stored in the image file. The image files can be employed for different data transmission use, in order to achieve a fast consultation among geographically distributed medical organizations.
2.2.5. Digital Report
- A specific tool allows physicians to write and compile the final patient text report using the stylus and digital sign; moreover Touch-SUV uses preconfigured sentences to provide a medical support for case history drafting as an alternative to stylus/keyboard use. Once finished, the report can be printed, archived, and saved as PDF (compatible with digital signature).
2.2.6. Quantification of PET Images
- A dedicated tool has been developed and implemented in Touch-SUV in order to provide accurate quantification of lesion radioactivity concentration on PET-CT images, accounting for the PVE of the PET system. The PVE correction is based on numerical coefficient, known as Recovery Coefficient (RC), experimentally obtained by the use of synthetic phantom measuring the PVE errors of the PET-CT system. The phantoms consisted in warm uniform cylinder with hot spheres of different diameter, miming oncological lesions. The RC-based PVE correction has been developed, optimized and validated for 18F-FDG in[22], using the above described ROI to measure the lesion radioactivity uptake in small regions. Each technique presents advantages depending from the characteristics of the lesion under evaluation. If the lesion has a quite simple shape, automatic thresholded ROI is recommended for the measurement of lesion radiotracer uptake. In this case the operator-dependent choice of the ROI around the lesion is avoided and the PVE correction offers maximum reproducibility (Operator-Independent method, OI). If the lesion has a complex shape, typically with necrotic regions inside, free-hand irregular ROI is suggested for the optimal definition of the lesion contour. In this case the touch-assisted technology offers unique performance for delineating the lesion volume at the cost of interoperability (Operator-Dependent method, OD). However, since the RC are obtained from hot spheres, the best accuracy and feasibility of the PVE correction is obtained for spherical and uniformly radioactive lesions, as discussed in[22].Once the ROI is defined around the lesion, at least of four circular ROI (of fixed d=2.5 cm) have to be selected by the operator on the background surrounding the lesion: geometrical functions evaluates the measured lesion-to-background ratio (L/B)m and the lesion volume (Vm) from the PET images, and determine automatically the proper RC to compensate for PVE. The corrected quantitative values are automatically calculated and saved into an Excel file.
2.3. Validation of Quantitative Accuracy and Reproducibility
- In order to validate the accuracy and reproducibility of the Touch-SUV PVE correction method, a thorax phantom, consisting of a cylinder (d1 = 20 cm, d2 = 30 cm, h = 21 cm) with two cork parts simulating lungs and a cardiac insert, was used: hot spheres of different diameters (diameter = 9.8, 12.3, 15.6, 25.8, and 31.3 mm) were inserted in the mediastinum filled with a 18F-FDG radioactive background (B). The phantom was studied by a current generation PET-CT system (Discovery STE, General Electric Medical Systems), a 3D system that combines an helical 16 slice CT scanner with a BGO 47 slice PET scanner. PET-CT studies were performed, according to the oncological clinical protocol, including: a SCOUT scan at 40 mA, a CT scan at 140 keV and 150 mA (10 sec), and 3D PET scans (2.5 min/scan) for adjacent bed positions. PET images were reconstructed by a 3D ordered subset expectation maximization algorithm (OSEM, 28 subsets, 2 iterations, 5.14 mm Gaussian post-smoothing) with corrections for random, scatter and attenuation incorporated into the iterative process. For each bed position, the PET image volume consisted into 128 x 128 x 47 voxels of 4.7 x 4.7 x 3.27 mm3 size, while the CT volume consisted into 512 x 512 x 47 voxels of 0.97 x 0.97 x 3.27 mm3 size. The transaxial spatial resolution of the system (FWHM), for the OSEM reconstruction, was measured at several distances from the centre of the scanner FOV.Measured radioactivity concentration (Cm) within the phantom spheres was evaluated by three different operators using OD irregular ROIs and OI thresholded ROIs. PVE corrected values of Cm were compared with the Gold Standard radioactivity concentration (CGS) obtained with the dose measurement system (Dose calibrator Pet Dose, Comecer) as the best estimate of the actual radioactivity concentration.
2.4. Validation of Clinical Feasibility
- The clinical feasibility of the PVE correction offered by Touch-SUV was assessed by applying the PVE correction on real clinical whole body PET-CT studies. The study protocol was approved by the Institutional Review Board of the Scientific Institute H San Raffaele-Giglio and the patients gave their written informed consent for the study. Patient inclusion criteria required small bone metastases (diameter < 4 cm). Sixteen oncological patients (age: 39-84 years, mean 57.1 years) with bone lesions from breast cancer primitives were selected. Each patient was examined on two separate occasions before (basal) and after (follow up) chemotherapy (Zometa) treatment. The mean interval between the two studies was 3 months ±15 days (range: 2-6 months) after chemotherapy treatment. PET-CT acquisitions were performed at the Nuclear Medicine Department of H San Raffaele-Giglio, Cefalu’ (Pa), Italy. Before the examinations the patients fasted for twelve hour and were injected intravenously with 18F-FDG (1mCi/10kg). The PET-CT oncological protocol began 60 minutes after the radiotracer injection. Twenty-three lesions in different body districts (7 pelvis bones, 5 ribs, 4 vertebral metameres, 4 breast bones, 2 long bones, 1 humerus) were selected for the evaluation study. Table 1 summarizes the characteristics of the selected patients.The clinical feasibility of the Touch-SUV PVE correction method was assessed by considering:the number of lesions with measured lesion diameter (dm) and measured (L/B)m within the range of diameter and L/B ratio sampled by the Touch-SUV RC curves;the number of lesions with uniform radiotracer uptake (uniformity requirement was satisfied if one single peek, within the lesion, was visually detected on the histogram of image voxel values);the number of lesions with spherical shape (roundness was satisfied when the percentage difference between the maximum and the minimum lesion diameter with respect to the maximum lesion diameter, on the PET transaxial, coronal and sagittal images, was < 50%).
3. Results and Discussion
3.1. Walk-Through
- Figure 2 shows a standard Touch-SUV session. A brief walk-through follows in order to demonstrate the main software functionalities.1. On program startup, the user is presented with a blank study and imports the PET-CT images into the program. Then the entire study is saved in a Touch-SUV directory and can be loaded by the user by clicking the browse button selecting the image files. 2. The patient and scan dialog box appears for reading, modifying, and entering specific data such as patient height, weight, administered/residual radioactivity, time of injection. Data are save and store in the IF.3. The PET whole-body coronal images are shown, and, by touching in the desired region, the PET, CT and PET-CT fused transaxial projections corresponding to the selection are contemporary visualized on three different figures in the Touch-SUV main window. It is also possible to choose a transaxial projection selecting the slice number directly. 4. The zoom and the scroll of the images can be optimized by touching the images or with the dedicated slider. A proper function allows to switch between single and multiple PET image views. 5. A proper color button can be used to change the PET, CT, and PET-CT colormap, by dragging the vertical bars of the color scale to adjust the desired level.6. ROIs can be added to the images from the ROI menu (irregular, circular or threshold ROI) in any of the transaxial views. ROIs can be copied from CT to PET and from PET to CT. ROI statistics are generated.7. A PVE button can be selected for applying PVE correction to the considered ROI. A PVE window appears and the operator can choose the measurement techniques (OD or OI) for PVE correction.8. A proper button allows to write and compile patient text report using the stylus and to add text or annotations into the PET image report.
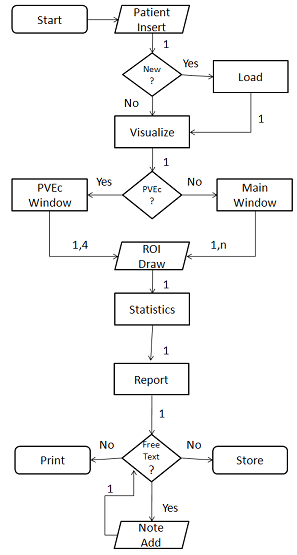 | Figure 2. Touch-SUV session data flow |
3.2. Functions
3.2.1. Reading, Writing and Storing Patient, Scan and Image Data
- Figure 3 shows the patient/scan box corresponding to a PET-CT whole body study. Data are imported from the DICOM image file and can be modified and completed with additional data useful for quantification (e.g. Residual radioactivity).
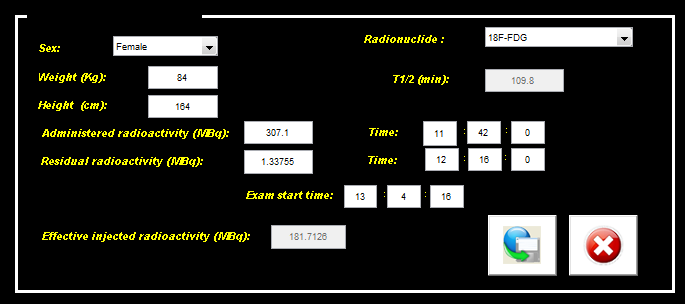 | Figure 3. Patient/scan data box |
3.2.2. Viewing PET, CT and PET-CT Images
- Figure 4 shows the main GUI layout with transaxial images of CT, PET and fused PET-CT images together with the coronal whole body PET images (right, bottom) and patient/scan data.
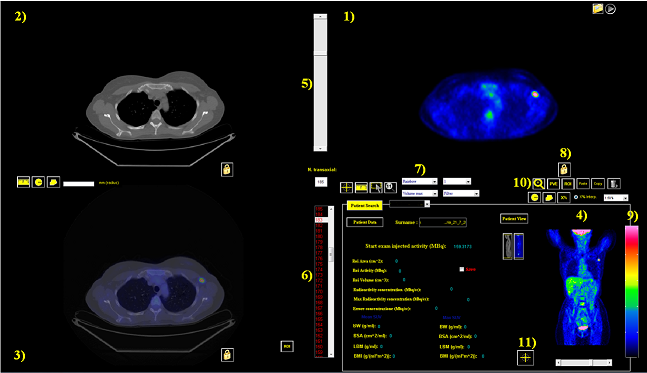 | Figure 4. User interface elements of Touch-SUV: 1) a transaxial PET image, 2) the corresponding CT transaxial image, 3) the corresponding PET-CT co-registered image, 4) the PET coronal whole body image, 5) the slice control slider, 6) the slice number selection, 7) the pre-defined colorbar selection button, 8) the activation colorbar button, 9) colorbar, 10) zoom botton, 11) position button for pixel position and pixel value |
 | Figure 5. Unfiltered and filtered (bicubic-spline function) PET transaxial image (colorbar = rainbow) |
3.2.3. Manipulating PET, CT and PET-CT Images
- Figure 6 shows, as a representative example of image manipulation by touch-assisted functions, a comparison of ROI manually drown on a transaxial PET image obtained by the use of the mouse and of the stylus touch, respectively. The superior performance of the touch screen technology with respect to conventional mouse-controlled image processing methods can be observed.
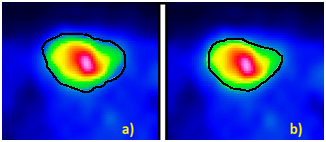 | Figure 6. PET transaxial image: a) ROI drawn with mouse b) ROI drawn with manual/stylus touch |
3.2.4. Collaborative Analysis
- Figure 7. shows a set of PET coronal projections (3 x 7) with annotations and remarks using stylus input. This report can be printed on film or stored on PDF for archiving or email use supporting easy diagnostic reporting for telemedicine purposes.
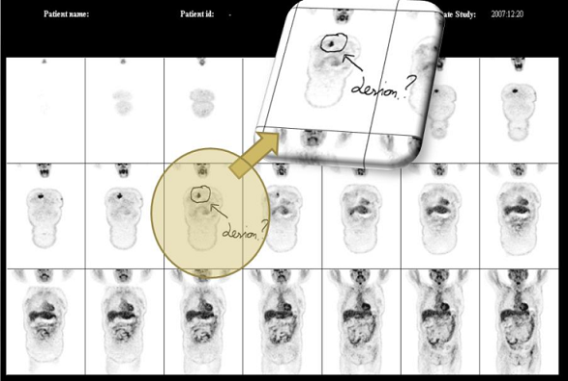 | Figure 7. Image film of a 18F-FDG whole body study (coronal view) for diagnostic report with medical annotations |
3.2.5. Digital Report
- Figure 8 shows the final medical report digitally compiled and signed for printing and/or archiving purposes.
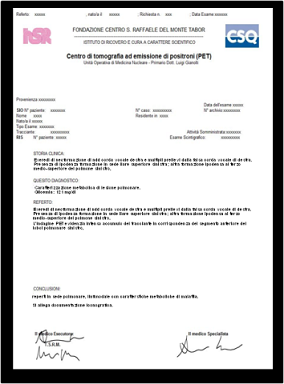 | Figure 8. Example of a text of a diagnostic report with digital signature |
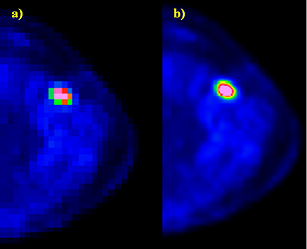
3.2.6. Quantification of PET Images
- Figure 9 shows a PET transaxial image with two ROIs. The external ROI has been manually defined by the user (OD); the internal ROI has been automatically drawn by Touch-SUV from threshold segmentation (OI).
 | Figure 9. Bone metastases: “-black” OI method, “.-white” OD method |
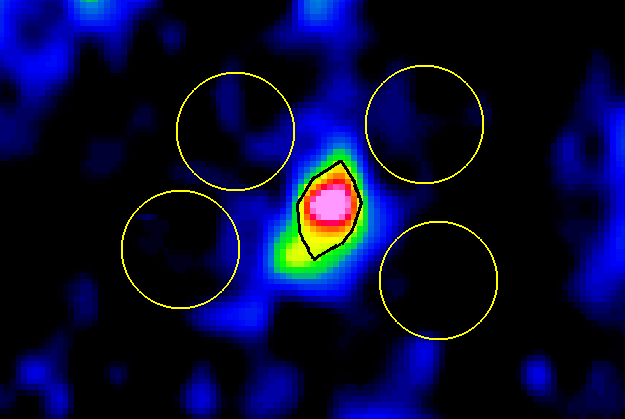 | Figure 10. OI method on a PET-CT image |
3.3. Validation of Quantitative Accuracy and Reproduci-
bility
- Table 2 shows the results obtained from the thorax phantom. The relative difference between the GS radioactivity uptake CGS and the measured PVE corrected Cm are shown for both OD and OI measurement method. The results prove that the most accurate method for PVE correction is the OI method, warranting an accuracy > 90% for lesions with diameter > 1 cm. The OI method is also the most reproducible, as expected, giving the smallest standard deviation among different operators.
|
3.4. Validation of Clinical Feasibility
- The application of Touch-SUV to the considered PET-CT oncological studies proved a good clinical feasibility of both the software tool (in supporting the diagnostic reporting of the studies) and the PVE correction method (in extracting the PVE corrected SUV). Among the 23 bone metastasis, 100% of lesions had a measured sphere-to-background ratio (S/B)m = 6.7±3.9 (range: 2.0÷18.3) and a measured lesion diameter dm= 1.48±0.45 cm (range: 0.7÷2.5 cm), within the range of sphere-to-background ratio and sphere diameter of RC curves sampled by Touch-SUV (2-32 and 0-4 cm, respectively). The requirement of round shape was satisfied by 100% of lesions.Notwithstanding a clinical evaluation on the impact of PVE correction on SUV for therapy response was beyond the purpose of this work, the percentage difference between PVE-affected SUV and PVE-corrected SUV variations during follow up was found >25% for many lesions and up to 150%. These results confirm the importance of PVE correction and its impact on the assessment of response to therapy. In fact a change of the difference of PVE-corrected SUV between basal and follow up studies can significantly affect the interpretation of the response to therapy (e.g. 1999 EORTC recommendations[29]). For this purpose a PVE corrected SUV quantification is important to enhance the diagnostic confidence during the reporting phase of PET-CT studies, and Touch-SUV can offer an effective support to this.
4. Conclusions
- The Touch-SUV software has been developed with the purpose to improve the physician ability to interpret the results of combined PET and CT whole-body studies and to enhance their diagnostic confidence by the provision of quantitative indexes. Touch-SUV provides an open source display application for quantitative and reproducible reporting of PET-CT whole-body studies with innovative touchscreen display technology offering unique performance for ROI analysis on biomedical imaging applications. The use of Touch-SUV in a real clinical environment has demonstrated that a PVE corrected SUV quantification has an important impact on the assessment of response to therapy. Touch-SUV PVE is suitable in a clinical setting allowing a better and more accurate characterization of oncological lesions to be provided. Touch-SUV encourages quantitative diagnostic reporting for collaborative purpose (e.g. multicentric studies, telemedicine), being also suitable for use in sterile environment.
ACKNOWLEDGEMENTS
- The authors would like to thank Dr. C. Canevari for supporting the development and the optimization of the Touch-SUV software with her suggestions and evaluation.
References
| [1] | Mankoff DA, Eubank WB 2006 Current and future use of positron emission tomography (PET) in breast cancer, J Mammary Gland Biol Neopalsia 11 125-136. |
| [2] | Plathow C and Weber WA 2008 Tumor cell metabolism imaging J Nucl Med 49 43S-63S |
| [3] | Lapela M, Eigtved A, Jyrkkiö S, Grénman R, Kurki T, Lindholm P , Nuutinen J, Sutinen E, Solin O, Bjornskov I et al. 2000 Experience in qualitative and quantitative FDG PET in follow-up of patients with suspected recurrence from head and neck cancer Eur J Canc 36 858-867 |
| [4] | Castell F, Cook GJR 2008 Quantitative techniques in 18F-FDG PET scanning in oncology Br J Canc 98 1597-1601 |
| [5] | Rosen EL, Eubank WB, Mankoff DA 2007 FDG PET, PET/CT, and breast cancer imaging Radiographics 27(1) S215-S229 |
| [6] | Lardinois D, Weder W, Hany TF, Kamel EM, Korom S, Seifert B, von Schulthess GK, Steinert HC. Staging of non-small-cell lung cancer with integrated positron-emission tomography and computed tomography. Engl J Med 2003;348:2500-7. |
| [7] | Strobel K, Exner UE, Stumpe KDM, Hany TF, Bode B, Mende K, Veit-Haibach P, von Schulthess GK and Hodler J 2008 The additional value of CT images interpretation in the differential diagnosis of benign vs. malignant primary bone lesions with 18F-FDG-PET/CT Eur J Nucl Med Mol Imaging 35(11) 2000-2008 |
| [8] | Hoshikawa H, Mitani T, Nishiyama Y, Yamamoto Y, Ohkawa M, Mori N 2009 Evaluation of the terapeutic effects and recurrence for head and neck cancer after chemoradiotherapy by FDG-PET Auris Nasus Larynx 36(2) 192-198 |
| [9] | Schmidt M, Bollschwieler E, Dietlein M, Mönig SP, Kobe C, Vallboehmer D, Eschner W, Hölscher A, Schicha H 2009 Mean and maximum standardized utake values in [18F]FDG-PET for assessment of histopathological response in oesophageal squamous cell carcinoma or adenocarcinoma after radiochemotherapy Eur J Nucl Med 36 735-744 |
| [10] | Soret M. et al. (2007) Partial-Volume Effect in PET Tumor Imaging. J Nucl Med 48; 932-945 |
| [11] | Kessler RM, Ellis JR, Eden M 1984 Analysis of emission tomographic scan data: limitations imposed by resolution and background. J Comput Assist Tomogr 8 514-522 |
| [12] | http://www.cabiatl.com/mricro/mricro/index.html |
| [13] | Robb RA, Barillot C. Interactive display and analysis of 3-D medical images. IEEE Transactions on Medical Imaging. 1989;8:217–226. |
| [14] | Rasband W, ImageJ Introduction, http://rsb.info.nih.gov/ij/docs/intro.html, Accessed December 13, 2005. |
| [15] | http://www.gehealthcare.com/euit/fun_img/products/nuclear_medicine/products/xeleris_home.html |
| [16] | http://www.gehealthcare.com/euit/advantage-workstation/ |
| [17] | http://www.siemens.com/syngo.via |
| [18] | http://www.medical.siemens.com/siemens/en_US/gg_nm_FBAs/files/whtpap/wp_10_percist.pdf |
| [19] | http://www.healthcare.philips.com/in/products/ros/products/syntegra/index.wpd |
| [20] | Stahl JN, Zhang J, Huang HK, et al. Teleconferencing withdynamic images. IEEE Trans Inf Technol Biomed 2000;4:88–95. |
| [21] | Raza T et al. Pulmonary telemedicine - A model to access the subspecialist services in underserved rural areas. International Journal of Medical Informatics 2009; 78: 53-59. |
| [22] | F. Gallivanone, A. Stefano, C. Canevari, L. Gianolli, C. Messa, M. C. Gilardi and I. Castiglioni “PVE correction in PET-CT whole-body oncological studies from PVE-affected images”, IEEE Trans Nucl Sci, in press |
| [23] | I. Castiglioni, F. Gallivanone, and A. Stefano, TOUCH SUV, SIAE registration number 007449 – D006667, 2009 |
| [24] | www.mathworks.it |
| [25] | http://java.sun.com |
| [26] | NC. Krak, R. Boellaard, OS. Hoekstra, JW. Twisk, CJ. Hoekstra, and AA. Lammertsma, “Effects of ROI definition and reconstruction method on quantitative outcome and applicability in a response monitoring trial”, Eur J Nucl Med Mol Imaging, vol. 32(3), pp. 294-301, Mar. 2005. |
| [27] | JR. Lee, MT. Madsen, D. Bushnel, and Y. Menda, “A threshold method to improve standardized uptake value reproducibility”, Nucl Med Commun, vol. 21(7), pp. 685-90, Jul. 2000. |
| [28] | Graham MM et al., (2000) Comparison of simplified quantitative analyses of FDG uptake, Nucl. Med. Biol., Vol. 27, 647-655. |
| [29] | H. Young, R. Baum, U. Cremerius, K. Herholz, O. Hoekstra, A. A. Lammertsma, J. Pruim, and P. Price, “Measurement of clinical and subclinical tumour response using [18F]-fluorodeoxyglucose and positron emission tomography: review and 1999 EORTC recommendations”, Eur. J.Canc, vol. 35, pp. 1773-1782, Dec. 1999. |