T. Shimomura
Dept. of Information Science and Intelligent Systems, University of Tokushima, Tokushima, 770-8506, Japan
Correspondence to: T. Shimomura , Dept. of Information Science and Intelligent Systems, University of Tokushima, Tokushima, 770-8506, Japan.
| Email: |  |
Copyright © 2012 Scientific & Academic Publishing. All Rights Reserved.
Abstract
When we execute a program, we cannot know its behaviour inside the program. Even by using a debugger, we cannot know the correspondence between a part of its output and a part of the program, either. The program being executed is a kind of black box to the people who are using it. This paper presents the concept of perceptible software that changes a program being executed from a black box to a white box, and describes an example of its implementation PercSoft.Keywords Enhancement, Maintenance, Perceptible, Virtual GUI, Visualization
Keywords:
Cite this paper:
T. Shimomura , "Perceptible Software for Maintenance and Enhancement", Software Engineering, Vol. 1 No. 1, 2011, pp. 1-8. doi: 10.5923/j.se.20110101.01.
1. Introduction
In the process of software maintenance or software evolution, the specific task of understanding the existing programs is required. A considerable part of the software maintenance task consists of program comprehension. When we execute a program, we cannot know its behaviour inside the program. Even by using a debugger, we cannot know the correspondence between a part of its output and a part of the program, either. The program being executed is a kind of black box to the people who are using it. This makes it difficult to maintain and enhance the program. The maintenance of legacy software is more difficult because it is dealt with by the people other than those who originally developed it.This paper presents the concept of perceptible software and describes an example of its implementation PercSoft. The aim of the perceptible software is to change a program being executed from a black box to a white box. In the perceptible software, we can directly modify the program source code that corresponds to the part of the execution result we choose. We do not need to search the program for the corresponding portion of interest. After modification, we can automatically build and replay the execution of the enhanced program based on the same inputs to immediately check whether the modification is satisfactory. During the replay mode, we can view the program structure and its execution flow on that structure, which will remind us how this program was working before.
2. Perceptible Software
2.1. Definition of Perceptible Software
Perceptible software is defined as a program such that we can run it and view the behaviour of the program as a usual program, and then directly modify a portion of the program that corresponds to the behaviour we are currently watching by directly pointing at it. In addition, we can replay its enhanced version with the same inputs, and view the program structure and its execution flow that are visually represented. Perceptible software consists of a program, its design and execution history. The design is the one that is generated by reverse-engineering[9] the program together with its execution history.
2.2. An Example of Perceptible Software "Age"
Figure 1 shows the outline of an example of perceptible software written in Java. This program "age" calculates the age of a person based on his or her birthday. It shows a window that consists of three kinds of components, JTextField, JLabel and JButton, where we can enter our birthday in year, month and day. When the button labelled "How old?" is clicked, our ages will be displayed as shown in Fig. 1 (a).This is a normal execution of program age.
2.3. Perceptible-Software Mode
When Ctl+Alt+P keys are pressed, its execution mode will be changed to the PS (perceptible software) mode, and some other windows will be shown to visualize the program execution. In the PS mode, if we choose a component with the mouse in the windows the application program displays, we can trace the execution history backward based on the chosen component. By making the mouse cursor lingering over components, we can know the names of the variables to which the instance addresses are assigned when they are created. This helps us read the source code. For example, the name of a variable "jLabelAge" will be shown as a piece of tooltip text as shown in Fig. 1 (b), to which an instance address is assigned when the JLabel component is created. In such a way, we can also know the names of variables that defined the JButton and the JTextFields of the program. Fig. 1 (c) indicates a line of source code in a PS source window where this component was last accessed. We can know that the component variable "jLabelAge" refers to has displayed the age by invoking its setText() method. If we click on this line, the related values will be shown as a popup menu. By choosing one of menu items, we can see the detailed value of the corresponding item. In this case, value 9 is shown, which is only one menu item in the popup menu. In addition, we can mark this line and add a comment "Set age" to this mark. These marks will be utilized when we trace the execution history forward and backward. If necessary, we can modify the calculation of age by directly editing this source code, build and then automatically replay the execution with the same input events to immediately check the results of the modification.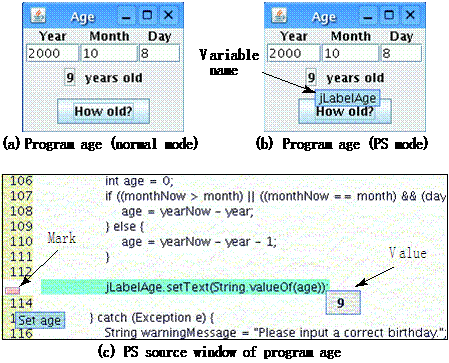 | Figure 1. Perceptible software mode of program age |
2.4. Program Visualization for Tracing Execution
To analyse the execution and modify the behaviour of some components of interest, we need to be able to directly choose and manage those components and visualize program structure and its execution. To fulfil these functions in the PS mode, in addition to the windows an application program displays, some other windows will be shown such as PS main window, PS source window, and PS call history window and so on. Table 1 illustrates the functions of these windows.PS main window controls the execution of perceptible software. It shows a list of the components chosen as being traced and opens additional windows to visualize program structure.PS source window displays the source code of perceptible software, some lines of which indicate that the components being traced were accessed together with their related values. PS call history window shows started threads, invoked methods with their related values, and the locations where components of interest were accessed.
3. System Configuration of Perceptible Software
A program of perceptible software is written in a usual object-oriented programming language like Java. Perceptible software processor processes the program as perceptible software. Perceptible software processor can be an interpreter, a compiler, or a pre-compiler for perceptible software. We here assume that a program is written in Java and that the program is transformed by a PS pre-compiler. Figure 2 illustrates the system configuration of perceptible software. We call this whole system the PS (perceptible software) system, PercSoft.(1) First, the PS pre-compiler transforms source programs to perceptible software programs.(2) We first run this perceptible software as usual, which is called a normal mode. The program will display some GUI windows to perform its processes. During the execution, its execution history will be recorded.(3) When we press a sequence of Ctl+Alt+P keys, its execution mode will be changed to the PS (perceptible software) mode. Some PS windows will appear such as the PS main window, PS source windows, PS | Table 1. Selective displays for perceptible software execution |
| | Windows | Menus / Buttons | Functions | | PS Mainwindow | Set tracedcomponents | For the components to be selected as being traced, choose their background colours and switches that determine whether they are traced or not. | | Build | Build the perceptible software. | | Replay | Replay the perceptible software. | | Visualize structure | Visualize the program structure according to the class structure and the execution history. | | Virtual GUI | Make the virtual components visible, which have no GUI in the normal mode. | | PS Source window | Refer to components | Trace points where selected components were accessed. | | Retrieve events | Trace specified events forward and backward. | | Mark points | Mark a line of code with a specified tooltip text. | | Trace marked points | Trace marked points forward and backward. | | Show values | Show the values referred to at the current point. | | New window | Create the new window of the same contents. | | PS Call History window | Call levels | Show the invocations of selected nesting levels. | | Select threads | Show the thread only selected. | | Trace threads | Trace threads forward and backward. | | Trace invocations | Trace the calls and returns of methods forward and backward. | | Trace Runnable | Trace the starts and stops of Runnable forward and backward. |
|
|
call history windows, PS structure windows, and PS virtual GUI windows. Virtual GUI windows will provide GUI interface for some components that originally do not have their GUI interfaces, which will be described in Section 7.3.(4) We can trace the execution history backward and forward.(5)We can directly locate the lines of source code at which a component of interest was accessed. If necessary, we can edit the source code in the PS source windows.(6) Then we can build the whole program.(7) We can replay the execution of the modified version with the same inputs to check the results of the modification. We can also run the enhanced program again in the normal mode.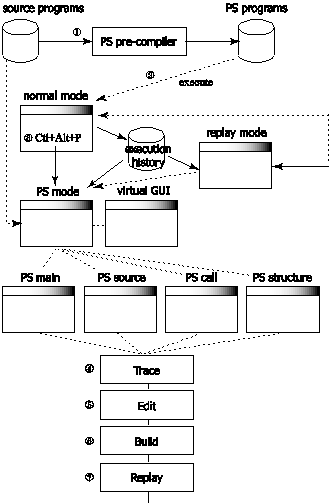 | Figure 2. System configuration of perceptible software |
4. Implementation of Perceptible Software
4.1. Recording Execution History
To locate the lines of source code at which components were accessed, the PS system needs to record the execution history that includes the definition and references of the components. Before we modify or enhance a program, we need to understand the flow of the program execution. Therefore, the PS system needs to visually display method invocations for each thread in the program. To fulfil these requirements, the PS system records some incidents that occurred during the program execution, which are shown in Table 2.When a component is created (Defined) in such a statement as "b = new JButton();", the location of this source code, variable name "b", class name "javax.swing.JButton", and the address of the created instance will be recorded. When this component's method is invoked (Referred) in such a statement as "b.setText("How old?");", the location of this source code, variable name "b", class name "javax.swing.JButton", the address of this instance, and the value of the method parameter "How old?" will be recorded. When the component leaves a part of process to another component (Linked) in such a statement as "b.addActionListener(new AgeListener());", the location of this source code, variable name "b", class name "javax.swing.JButton", the address of the component, and the address of the other component will be recorded. When we trace the incidents of the component "b" in the PS mode, we can trace the incidents of the other component of class AgeListener together.To visually display method invocations for each thread in the program, the PS system records incidents where a method is invoked (CallMethod); a method starts its execution (MethodEntry); a method returns (ReturnMethod); a thread starts its execution (RunStart); or a thread finishes its execution (RunStop).Each incident is recorded together with the address of the current thread in a synchronized way, which enables the PS system to know when threads switch and resume their execution.| Table 2. Types of execution history for perceptible software |
| | Types | Functions | Examples | | Defined | A target component is defined. | b = new JButton(); | | Referred | The component is referred to,the parameter values of which will be recorded. | b.setText("How old?"); | | Linked | The component is linked to another, which will be traced together with it. | b.addActionListener(new AgeListener()); | | CallMethod | A method is invoked. | setButtonMode(row, mode); | | MethodEntry | The method starts its execution, the parameter values of which will be recorded. | void setButtonMode(int row, Mode mode){ ... | | ReturnMethod | The method returns, the returned value of which will be recorded. | ... } | | RunStart | A Runnable method starts its execution, which is defined in either a thread or an AWT event. | public void run() { ... | | RunStop | The Runnable method finishes its execution. | ... } |
|
|
4.2. Transformation of Components
To enable programmers to develop perceptible programs in the same way as usual, the system needs to transform the source code of the programs so that the transformed programs will accept the PS mode and provide its functions. The PS pre-compiler transforms components to PS components that extend their original components. The part of source code that refers to these components is transformed so that it will refer to the corresponding transformed perceptible components. Figure 3 illustrates this transformation. For the JButton class, for example, the PSJButton class is prepared, which extends JButton. The methods of the PSJButton class record the location of the source programs at which these methods will be invoked. In addition, these extended methods will record execution history, detect the PS mode, and set the PS mode so that several PS windows will appear and the variable names that have defined components will be displayed as a tooltip text when the mouse cursor lingers over the components. The source code of an application program that refers to those components is also transformed. For example, "b = new JButton();" will be transformed to "b = new PSJButton(loc);", where loc indicates the location of this source code. | Figure 3. Transformation of components of interest to PS components |
4.3. Perceptible components
Figure 4 shows a part of source code of PSJbutton class, which is a perceptible component for javax.swing.JButton class. PSJbutton class extends its original component JButton and implements PSJComponent, which defines setPSmode() method. The setPSmode() method changes the execution mode between the normal mode and the PS mode. In the PS mode, for example, this method will change the tooltip text from its original text to the name of the variable that defines this component. The perceptible component overrides super class's methods. Each method of the perceptible component invokes the corresponding super class's method and then performs processes specific to the perceptible component.(1) When this perceptible component is created by invoking its constructor, PS.compAccess() method will be called to record a record type, the location of the source code, the address of the created instance, the variable name and the class name of the component, and the value of the constructor parameter. Then, PS.addPSJComponent() method will be invoked to add this component to a list of perceptible components.(2) Its setText() method records the execution in the same way.(3) Its addActionListener() method further records its listener as a linked object. This linked object address will be also used when the address of the perceptible component is traced in the execution history to identify one with the other.(4) Its processKeyEvent() method detects Ctl+Alt+P key press to change the execution mode.
4.4. Pre-compiling for Perceptible Components
Figure 5 (a) shows how a part of source code that refers to a PS component is pre-compiled for the previous program "age". The original program defines AgeListener class. The pre-compiled program defines its wrapper class PSAgeListener, the source code of which is shown in Fig. 5 (b).When button "How old?" is clicked, PSAgeListener's actionPerformed() method will be invoked by the AWT-EventQueue thread of the Java run-time library. This method will perform some PS specific processes to record the start of the method and the access of the object linked to the perceptible component, and then invoke its original listener's actionPerformed() method. | Figure 4. Perceptible software components |
5. Example of Perceptible Software Execution
5.1. Example Program Alarm
We here describe an example of a perceptible program execution, which exploits several classes, threads and method invocations. Figure 6 shows an example perceptible program "alarm". This program is started with the number of alarms as a command-line parameter. The figure shows the window of this program with ten alarms. The alarms are numbered from 1 to 10.The window keeps on updating the current date and time.We can enter a certain time in a row to set its alarm clock. The buttons numbered from 1 to 10 are initially green. When an alarm goes off, the corresponding button will turn yellow and start beeping. If we click on the alarm button, the button will turn red and stop beeping. The first alarm went off at 11:33 and then the button has been clicked to stop beeping. If we enter Ctl+Alt+P keys anytime, the program mode will be changed to the PS mode. | Figure 5. Pre-compiling for generating perceptible software |
5.2. Program Structure of Alarm
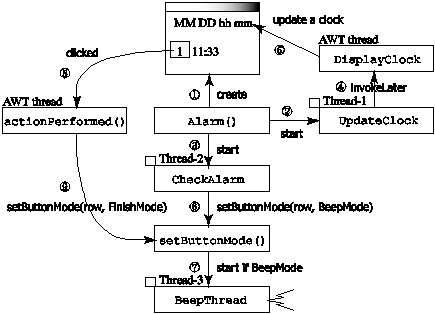
Program alarm is defined as Alarm class that extends JFrame and implements ActionListener. Figure 7 illustrates the structure of program alarm and the flow of its execution.(1) The main method invokes Alarm constructor. The Alarm() constructor creates the window that shows a clock and ten alarms.(2) Then it starts UpdateClock thread, which is actually started as Thread-1 by Java run-time environment.(3) The Alarm() constructor also starts CheckAlarm thread as Thread-2.(4) The UpdateClock thread periodically schedules an AWT event named DisplayClock, (5) which will update the clock.(6) The CheckAlarm thread periodically checks each alarm.If it is time to let an alarm off, it will invoke setButtonMode() method, (7) which will start BeepThread as Thread-3 to keep beeping.(8) When an alarm button is clicked, a listener method actionPerformed() will be invoked as an AWT thread.(9) It will invoke setButtonMode() method to stop beeping.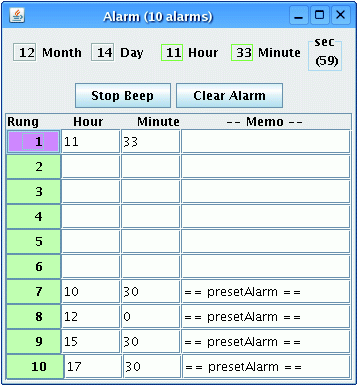 | Figure 6. Alarm window with 10 alarms |
 | Figure 7. Program structure of alarm |
5.3. Switch to the Perceptible Mode
When Ctl+Alt+P keys are pressed, the execution mode will be changed to the PS mode. As shown in Fig. 8 (a), when the mouse cursor moves over a component, the name of the variable that defines the component will be displayed as a tooltip text. The tooltip text "button[0]" indicates that the address of the first alarm button was assigned to the first element of array button when it was created.When we choose components as being traced, these components will be registered. We can see those components being traced if we click on "Traced comp list" button in the PS main window as shown in Fig. 8 (b).We can trace the execution history backward and forward in a variety of ways. The execution history records some incidents such as thread running, component accesses, and method invocations. In the PS source window as shown in Fig. 8 (c), we can know at which line of code these incidents happened. The example shows that button[0] was last accessed at line 471, where its setBackground() method was invoked with a value of java.awt.Color[r= 255, g= 150, b=255], approximately the red color of which means that the alarm stopped beeping because the alarm button was clicked. This line is marked with a tooltip text "Set color" in case this line is overlooked when another incident is chased.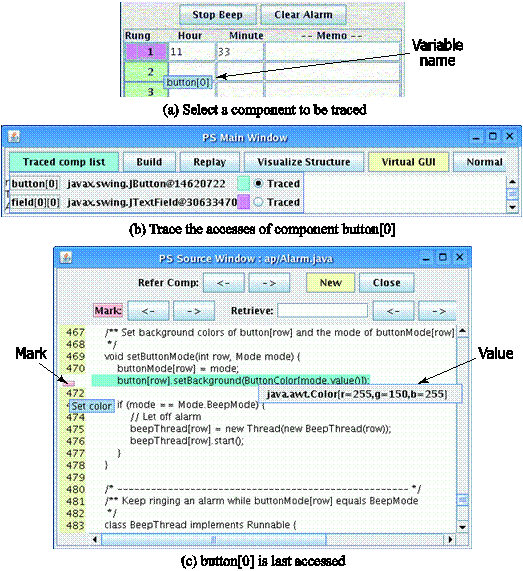 | Figure 8. Switch to the perceptible mode |
5.4. Access-driven Call History of Program Alarm
Figure 9 illustrates the call history of program alarm, where running threads and invoked methods are shown in order of occurrence. Some lines are marked with the color of a traced component "button[0]".It means that the traced component is accessed during the time after the line and before the next line. Figure 9 (a) shows the call history of level 1, which only shows the first invocation in each thread. At line 31, we can see that setButtonMode() method is invoked with BeepMode (yellow) for button[0], and then actionPerformed() method that is related to button[0] is invoked. At line 38, the same setButtonMode() method is invoked with FinishMode (red) for button[0].Figure 9 (b) shows the call history of level ALL, which shows all method invocations in each thread. At line 8, we can see that setButtonMode() method is first invoked to set button[0] to AlarmMode (green).In this way, if we trace component button[0], we can know that its mode has been changed from AlarmMode (green) to BeepMode (yellow) and then to FinishMode (red).Because the execution history could be large, it is important to selectively display its part of interest. In addition to call levels, we can choose a thread that will be shown in the call history by choosing it with the thread pull-down menu as shown in 9 (b)
6. Observation
To implement a perceptible program, we have developed a prototype system PercSoft, which consists of PS pre-compiler, PS components and PS run-time library.Table3 shows the measurements of the sample perceptible software "alarm". With a perceptible program, while we are executing it, we can touch a part of its output and view a part of source code that generates that output. We can modify the source code and then immediately check the result of the modification. We do not have a risk to lose the source files of the perceptible software or forget its location because it contains all of source programs, its design and execution history. The more times we execute the perceptible software, the more complete structure of the program we can view because execution history will reflect a lot of execution paths. 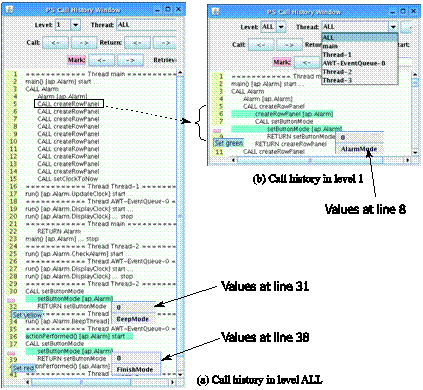 | Figure 9. Access-driven call history of program alarm |
| Table 3. Measurements of sample perceptible software |
| | Measurements | Values | | Lines of source code | 527 lines | | Number of classes | 6 classes | | Number of methods | 12 methods | | Number of threads | 5 threads | | Number of switches of threads | 10 times | | Lines of trace information | 253 lines | | Volume of trace information | 18, 594 bytes |
|
|
7. Future Directions
We have several difficulties left in perceptible software implementation, which are structure visualization, runtime behaviour visualization, virtual GUI and so on. We here discuss some of these problems.
7.1. Structure Visualization
Software visualization is classified as the visualization of program code, software structure and runtime behaviour. The visualization of software structure includes a call graph, a flow chart, class relationship, change history and so on. The visualization of runtime behaviour includes algorithm animation, threads, memory allocation and so on. For software structure visualization, BARRIO[1] detects and visualizes clusters in dependency graphs extracted from Java programs by means of source code and byte code analysis. Imsovision[2] is a system for visualizing object-oriented software in a Virtual Reality Environment. SHriMP[8] offers a variety of different graphical views for exploring software structure and browsing source code.Perceptible software contains source programs, its design and execution history, the resources of which should not be distributed in separate locations. To visualize the structure of perceptible software, we have a plan to visualize it based on source code, its design and execution history to show the program structure and the flow of execution. Structure visualization will consist of the GUIs the program presents, classes, threads, and related method invocations, for example, where program alarm will be visualized as shown in Fig. 7.The execution history could become large. Therefore, we need to record it selectively. For example, older execution histories should be more reduced because they are not often used and might not reflect the latest version of the program. There should be an appropriate way to distinguish between old and late execution histories in the structure visualization, for example, by using distinct colours.
7.2. Runtime Behaviour Visualization
The conventional visualization of runtime behaviour requires either debugger interface or instrumentation to obtain trace information. A dynamic Java visualizer[5], Jinsight[4, 6], Zeller[10], and JaVis[3] require debugger interface to obtain trace information. A dynamic Java visualizer[5]provides a view of a program in action. It shows information about what classes were currently executing, what was happening to memory, and what the various threads were doing. Jinsight[4, 6] is a tool for exploring a program's run-time behaviour visually. It is helpful for performance analysis, debugging, and program understanding. Jinsight's visualizations are based on execution traces. Zeller[10] focuses on the visualization of data structures and memory. They present memory graphs as a means to capture and explore program states. JaVis[3] is an environment for visualizing and debugging concurrent Java programs. The information about a running program is collected by tracing. The Unified Modeling Language (UML) is used for the visualization of traces. On the other hand, in APV[7], once we embed a few probes in a program as assert statements, its execution with multiple threads can be visualized in a variety of ways. The probes of assert statements specify when and what combination of data are visualized. We have a plan to visualize the runtime behaviour of perceptible software in the replay mode by using this APV mechanism, where appropriate assertions will be embedded in perceptible components in advance.
7.3. Virtual GUI
Which components or objects should be perceptible, JButton, HashMap or user-defined classes? Java's JComponents have their own representation as GUIs. On the other hand, most of the components (that is, class instances) do not have their GUI representation. For the components of interest, we will develop their corresponding perceptible components, which will provide their virtual GUI representation in the PS mode. With these virtual GUIs, we can know how the data are processed inside the program, such as sent and received communication data. Figure 10 illustrates a chat system that consists of server-side and client-side programs. First the server-side program is running. Next a client-side program runs to connect the server-side program from a remote machine. The connected client-side program sends a message to the server-side program, and then the server-side program sends the received message to all of the client-side programs. The server-side program has a GUI window that shows the name of a server machine and its port number. Each client-side program also has GUI windows, one of which shows the name of a connected server machine, its port number and the client's nickname for chatting, and the other shows a chatting window, where sent and received messages are shown. When the server-side program gets into the PS mode, a virtual GUI window will appear to show the message last sent and received by the server and at the same time, virtual GUI windows will appear for each remote client to show its real and virtual GUI windows. Ideally, we would like to modify or enhance not only the server-side program but also the client-side program on the server side.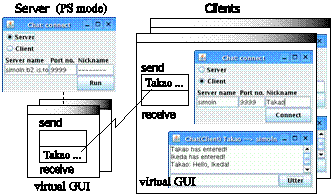 | Figure 10. Virtual GUI for networking programs |
References
| [1] | Jens Dietrich, Vyacheslav Yakovlev, Catherine McCartin, Graham Jenson, and Manfred Duchrow, Cluster analysis of java dependency graphs, Proceedings of the 4th ACM symposium on Software Visualization, 91-94, 9 2008. |
| [2] | J.I. Maletic, J. Leigh, A.Marcus, and G. Dunlap, Visualizing object-oriented software in virtual reality, Proceedings of the 9th IEEE International Workshop on Program Comprehension (IWPC2001), 26-35, 5 2001. |
| [3] | Katharina Mehner, Javis: A uml-based visualization and debugging environment for concurrent java programs, Lecture Notes in Computer Science, 2269:163-175, 2002. |
| [4] | Wim De Pauw, Erik Jensen, Nick Mitchell, Gary Sevitsky, John Vlissides, and Jeaha Yang, Visualizing the execution of java programs, Lecture Notes in Computer Science, 2269:647-650, 2002. |
| [5] | Steven P. Reiss, Visualizing java in action, Proceedings of the 2003 ACM symposium on Software Visuallization, 57-66, 6 2003. |
| [6] | G. Sevitsky, W. DePauw, and R. Konuru, An information exploration tool for performance analysis of java programs, Proceedings of Technology of Object-Oriented Languages and Systems (TOOLS Europe), 85-101, 3 2001. |
| [7] | Takao Shimomura, Kenji Ikeda, and Muneo Takahashi, Attachable software visualization for multiple-thread programs, Proceedings of the IASTED International Conference on Software Engineering, 1-7, 2 2010. |
| [8] | M.-A.D. Storey, K. Wong, F.D. Fracchia, and H.A. Muller, On integrating visualization techniques for software exploration, IEEE Symposium on Information Visualization (INFOVIS '97), 38-45, 10 1997. |
| [9] | Paolo Tonella, Reverse engineering of object oriented code, Proceedings of the 27th international conference on Software engineering, 724-725, 5 2005. |
| [10] | Thomas Zimmermann and Andreas Zeller, Visualizing memory graphs, Lecture Notes in Computer Science, 2269:191-204, 2002. |


 Abstract
 Reference
 Full-Text PDF
 Full-Text HTML