-
Paper Information
- Paper Submission
-
Journal Information
- About This Journal
- Editorial Board
- Current Issue
- Archive
- Author Guidelines
- Contact Us
Science and Technology
p-ISSN: 2163-2669 e-ISSN: 2163-2677
2025; 15(1): 1-11
doi:10.5923/j.scit.20251501.01
Received: Oct. 22, 2025; Accepted: Nov. 16, 2025; Published: Dec. 3, 2025

Optimization of Decolorization of Azadirachta indica. A. Juss Oil by Activated Carbon Based on the Date Palm Seeds (Phoenix dactylifera)
 Abstract
 Reference
 Full-Text PDF
 Full-text HTML
Kom Blaise1, Nana Olga1, Tamfu Ngenge Alfred2, Balike Musongo2, Domga Richard3, Ndil-Idam Enock1, Fokam Tagne Michel Archange4
1Department of Chemistry, Faculty of Science, University of Ngaoundere, Ngaoundere, Cameroon
2Department of Chemical Engineering, School of Chemical Engineering and Mineral Industries, University of Ngaoundere, Ngaoundere, Cameroon
3Department of Applied Chemical, National School of Agro Industrial Sciences, University of Ngaoundere, Ngaoundere, Cameroon
4Department of Biological Sciences, Faculty of Science, University of Ngaoundere, Ngaoundere, Cameroon
Correspondence to: Kom Blaise, Department of Chemistry, Faculty of Science, University of Ngaoundere, Ngaoundere, Cameroon.
| Email: |  |
Copyright © 2025 The Author(s). Published by Scientific & Academic Publishing.
This work is licensed under the Creative Commons Attribution International License (CC BY).
http://creativecommons.org/licenses/by/4.0/

The decolorization of edible plant oils involves the adsorption of pigments like chlorophylls and carotenes, along with removal of impurities such as soaps, metals, and phosphorus. This study aimed to optimize the decolorization of Azadirachtaindica A. Juss oil using activated carbon (AC) derived from Phoenix dactylifera kernels. The activation of the coal obtained from Phoenix dactylifera kernels was carried out using phosphoric acid. The AC used had an iodine index of 427.95 ± 0.02 mg/g, a methylene blue index of 10.58 ± 0.01 mg/g, a specific surface area of 521.52 ± 0.02 m²/g and a pH at the point of zero charge (pHPZC) of 5.5. Azadirachtaindica A. Juss oil was extracted using both the traditional and Soxhlet methods. The optimization of the decolorization of AzadirachtaindicaA. Juss oils was carried out a Central Composite Design (CCD), which is a second-degree mathematical model that involves the variables, mass of AC (X1), temperature (X2) and time (X3). Regarding carotene content, the optimal temperatures were 72°C and 44°C for the oil extracted by the traditional method and for the oil extracted by the Soxhlet method, respectively. For chlorophyll content, the optimal temperature was 55°C for both extraction methods. The optimal reaction times were 40 min and 20 min for carotene content, respectively, for traditional method and for Soxhlet method. Decolorization yields were 41.20% and 4.81% for carotene content and 49.75% and 75% for chlorophyll content, for traditional method and for Soxhlet method respectively. Optimal decolorization of Azadirachtaindica oil is best for Soxhlet extraction method with minimal time (20 min) and minimum temperature (44°C).
Keywords: AzadirachtaindicaA. Jussoil, Activated carbon, Optimization of decolorization, Date palm, Oil extraction
Cite this paper: Kom Blaise, Nana Olga, Tamfu Ngenge Alfred, Balike Musongo, Domga Richard, Ndil-Idam Enock, Fokam Tagne Michel Archange, Optimization of Decolorization of Azadirachta indica. A. Juss Oil by Activated Carbon Based on the Date Palm Seeds (Phoenix dactylifera), Science and Technology, Vol. 15 No. 1, 2025, pp. 1-11. doi: 10.5923/j.scit.20251501.01.
Article Outline
1. Introduction
- Vegetable oils are essential components of the human nutrition. They provide energy, essential fatty acids, fat-soluble vitamins, and perform important organoleptic functions in food [1]. They also serve as raw materials in various industries, including the food and cosmetics sectors. These oils are mainly derived from oilseeds, including soybean, rapeseed, sunflower, palm, and peanuts. These oils are mainly composed of triglycerides (95-98%), fatty acids, and other minor constituents [2]. Diversification of vegetable oil uses worldwide (oleo chemicals, biofuels, cosmetics, and pharmaceuticals) and population growth have boosted global vegetable oil production in recent years [3], [4], [5]. Vegetable oils contain coloring pigments that reduce their shelf life and aesthetic value. Therefore, it is imperative to separate these coloring pigments to increase their shelf life and improve their aesthetic value. These pigments are composed primarily of chlorophyll, carotenoids, and related compounds. In the presence of light, chlorophyll promotes oxidation and significantly reduces the oxidative stability of oils. Chlorophyll pigments act by blocking nickel's active sites and altering the hydrogenation process [6].Azadirachta indica A. Juss seeds are very rich in oil, often exceeding 50% of the dry weight of the seeds and contains more than 300 bioactive compounds [7] including limonoids or tetranortriterpenes, protolimonoids, flavonoids, and other constituents such as tannins, beta-sitosterol, and vilasinin [8]. Neem oil is a vegetable oil extracted from Azadirachta indica A. Juss seeds. In Cameroon, Neem oil production is carried out artisanally and represents a source of income for many households, including seed collectors and processors. The extraction activity is considered profitable, with benefits realized at different levels of the production chain. Neem oil is very bitter, contains vitamin E and essential amino acids. It also has an almost opaque brown color and a distinctive spicy scent and is particularly valued for its medicinal properties, including anti-inflammatory, anti-fungal, antioxidant, cosmetics and biocidal activities [9], but its inherent odor and color pose challenges during consumer use. Therefore, decolorization processes will be essential and necessary to improve its palatability and user acceptance. Decolorization of vegetable oils involves the adsorption of pigments (chlorophylls and carotenes), as well as the removal of impurities (soaps, metals, and phosphorus) [10], [11]. Among the decolorization methods, we have common methods using activated carbon (AC) as an adsorbent, bleaching earths or biosorbents in continuous or batch or processes are used for purification, decolorization, and contaminant removal in applications like wastewater treatment and oil refining. The efficiency of oil decolorization depends on the oil extraction method. This study focuses on the optimization of the decolorization process of Azadirachta indica oils extracted by the traditional method and the Soxlet method using AC derived from Phoenix dactylifera seeds. AC derived from Phoenix dactylifera seeds is particularly promising due to its efficiency and availability as a waste product in date-producing regions [12].The main objective of this work was to determine the optimal conditions (time, temperature and amount of AC) to achieve maximum decolorization efficiency by using response surface methodology (RSM). To achieve this, the centered composite design (CCD) was selected for its ability to efficiently explore a large experimental space [13], [14], [15].
2. Experimental
2.1. Materials
- The fruits of date palm (Phoenix dactylifera) were collected and harvested in N’Djamena, Chad. They were manually pitted, washed thoroughly with tap water to remove kernel impurities, and subsequently rinsed with distilled water. Seeds of Azadirachta indica A. Juss were collected from the far-north region of Cameroon (Maroua) and stored at room temperature. These seeds underwent various processes to obtain the fine powder required for oil extraction. Chemicals utilized in this study were of analytical grade: Sodium chloride NaCl (99%) and sodium hydroxide NaOH (99%) were supplied by Prolabo, while sulfuric acid H2SO4 (96%) was purchased from Sigma-Aldrich (Saint-Quentin Fallavier, France). All test solutions were prepared using ultra-pure Milli-Q water (Millipore, resistivity > 18 MΩ·cm).
2.2. Preparation of Activated Carbon
- To produce the adsorbent material, we followed the method outlined by [16]. Initially, the absorbent material (date seeds or kernels of Phoenix dactylifera) was thoroughly washed with water, then dried in an oven and subsequently dried at 105°C for 24 hours. Once dried, the date seeds were crushed using a muffle mill (brand RAF) and sieved to achieve particles with a diameter of less than 200 µm. The resulting ground material was stored in tightly closed polyethylene bottles to prevent exposure to air. The powders obtained from this process were then subjected to pyrolysis at 600°C using a programmable NABERTHERM muffle furnace 30-3000°C with a heating rate of 2.5°C/min for 3 hours. After calcination, the carbons produced were allowed to cool and stored in a flask.Next, 300 g of the powdered material (powder obtained after calcination) date seeds or kernels was combined with 5.10 mL of a 1N phosphoric acid solution, maintaining a ratio of 1:10. The mixture was stirred for 24 hours on a magnetic stirrer (Mivar Magnetic Stirrer) at room temperature, then filtered through filter paper (whatman flat qualitative filter paper, grade 1, 11 µm). The filtered material was subsequently dried in an oven at 105°C for another 24 hours and cooled in a desiccator. The powders obtained after impregnation were placed back into the programmable NABERTHERM muffle furnace 30-3000°C and heated at 600°C for 3 hours. After cooling in a desiccator for 24 hours, the AC produced underwent a washing process with distilled water for 48 hours, ensuring the pH of the wash water reached 6.5. Following this, the AC was dried for 24 hours in an oven at 105°C. Upon removal from the oven, the sample was cooled for 30 minutes in a desiccator before further use.
2.2.1. Physico-Chemical Characterization of Activated Carbon
- After the preparation of AC, several physicochemical characteristics were determined, including pyrolysis yield, moisture content, ash content, iodine number, methylene blue index, specific surface area, and pH at the point of zero charge.The yield reflects the mass loss during chemical decomposition under heat and indicates the activation degree of activated carbon and was calculated using Equation 1.
 | (1) |
 | (2) |
 | (3) |
 | (4) |
 | (5) |
 | (6) |
 | (7) |
2.3. Oil Extraction Method
- Extraction of Azadirachta indica A. Juss oils was conducted using Soxhlet and traditional methods. For the Soxhlet method, 300g of A. indica A. Juss powder was initially placed in a capsule and introduced into a 500 mL flask containing a refrigerant. Then, 250 mL of hexane was added to the flask with pumice stones to control boiling temperature. The apparatus was connected to tap water for cooling during oil extraction. The entire setup was placed in a heated chamber at 68°C for 8 hours. After heating, the oil-hexane mixture was recovered and subjected to rotary evaporation (Heidolph) to separate the oil from hexane. The residual solvent was removed by placing the mixture in an oven at 105°C for 1 hour. The flask containing the oil was then stored in a desiccator to prevent moisture absorption.Traditional extraction methods involve manual techniques. A. indica A. Juss seeds were ground into a fine powder using a mortar. The powder was mixed with water to form a paste, which was then boiled in a pot until oil appeared on the surface. The oil was collected, cooled, and reheated until all water evaporated. The resulting oil was stored in a bottle to prevent contamination.
2.4. Decolorization of Azadirachta indica Oil
- Nearly all oils undergo a decolorization process during production or processing. This step aims not only to reduce oil color but also to remove or convert undesired products from fats and oils. Decolorization is a batch process. The experiment on the bleaching of Azadirachta indica oil was carried out in a 250 mL Erlenmeyer flask. 10 mL of Azadirachta indica oil was introduced into the Erlenmeyer, then the required amount of activated charcoal (X1) obtained from Phoenix dactylifera seeds was added, and the mixture was brought to the experimental temperature (X2) for a duration (X3) under stirring at 250 rpm using the Mivar Magnetic Stirrer. Subsequently, the bleached oil was separated from the AC using a centrifuge (Centrifuga MKE T4-S) and the carotene and chlorophyll contents were determined.Carotenoid content 0.2 g of oil was weighed into a 20 mL flask and diluted to 1% with cyclohexane. Using a spectrophotometer (Model ZUZI 4211/50), absorbance was measured between 405 and 500 nm, with the control filled with cyclohexane [21], [22]. Carotenoid concentration is expressed in ppm of fat and was calculated using Equation 8.
 | (8) |
 | (9) |
2.5. Optimization of Decolorization of Azadirachta indica A. Juss Oil
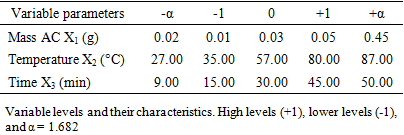
- Response surface methodology (RSM) was employed to optimize the decolorization process of activated carbon-based Neem oil derived from Phoenix dactylifera kernels. Initial experiments guided the selection of temperature, time, and mass of activated carbon as variables. For the optimization of oil decolorization, a centered composite design was chosen. With three factors, this design involves 23 + 2×3 + 3 = 17 tests to be conducted. Thus, variables were designated as X1 for activated carbon (AC) mass (g), X2 for temperature (°C), and X3 for time (min) (Table 1).
|
 | (10) |
3. Results and Discussion
3.1 Characterisation of the Actived Carbon (AC) Derived from Phoenix dactylifera
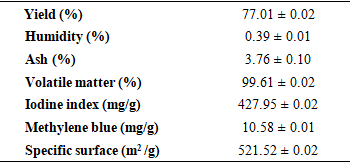
- The yield of AC derived from Phoenix dactylifera was 77.01% (Table 2). It is an important measure of the performance of the AC preparation process. This value is higher than that obtained for AC derived from coconut shells (38%) and close to that obtained for AC derived from date palm pits (73%) [23], [24]. This difference would be due to the nature of the constituents of the different plants.
|
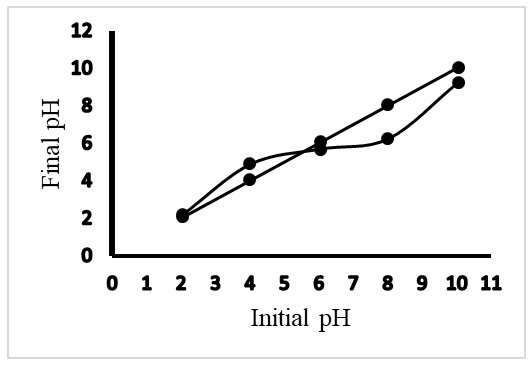 | Figure 1. pH at the point of zero charge |
3.2. Optimization by Response Surface Methodology
3.2.1. Experimental Results
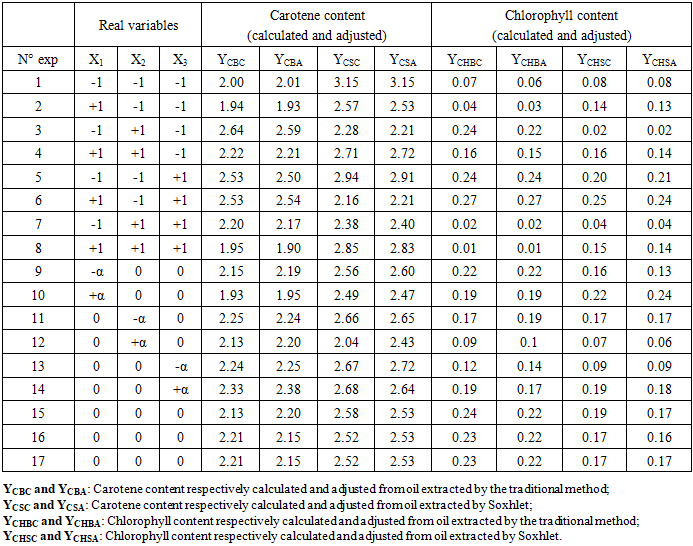
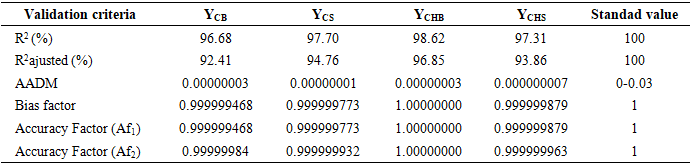
- The study of the influence of variable parameters, namely mass AC (X1), temperature (X2), and time (X3), was conducted. The responses obtained were the content of carotenes (YCB) and chlorophyll (YCHB) in the oil extracted by the traditional method, and the content of carotenes (YCS) and chlorophyll (YCHS) in the oil extracted by Soxhlet extraction. The experimental design chosen was a centered composite design. Thus, with three (3) factors, 17 experiments were conducted, and the results are presented in Table 3. It is noted that the experiments were conducted randomly to avoid any influence of the experimenter on the response. In practice, we assumed that interactions of order three or higher are negligible as these interactions are often not significant in the analysis of variance and are difficult to interpret.
|
 | (11) |
 | (12) |
 | (13) |
 | (14) |
|
3.2.2. Pareto Analysis
- Pareto analysis involves interpreting the influence of each parameter, as described by Equation 15.
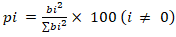 | (15) |
 | Figure 2. Pareto chart of carotenes of traditional oil (a) and solvent extracted oil (b); chlorophylls of traditional oil (c) and solvent extracted oil (d) |
3.2.3. Response Surface
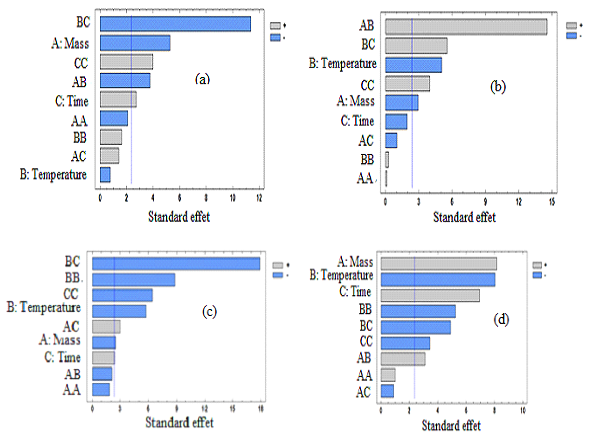
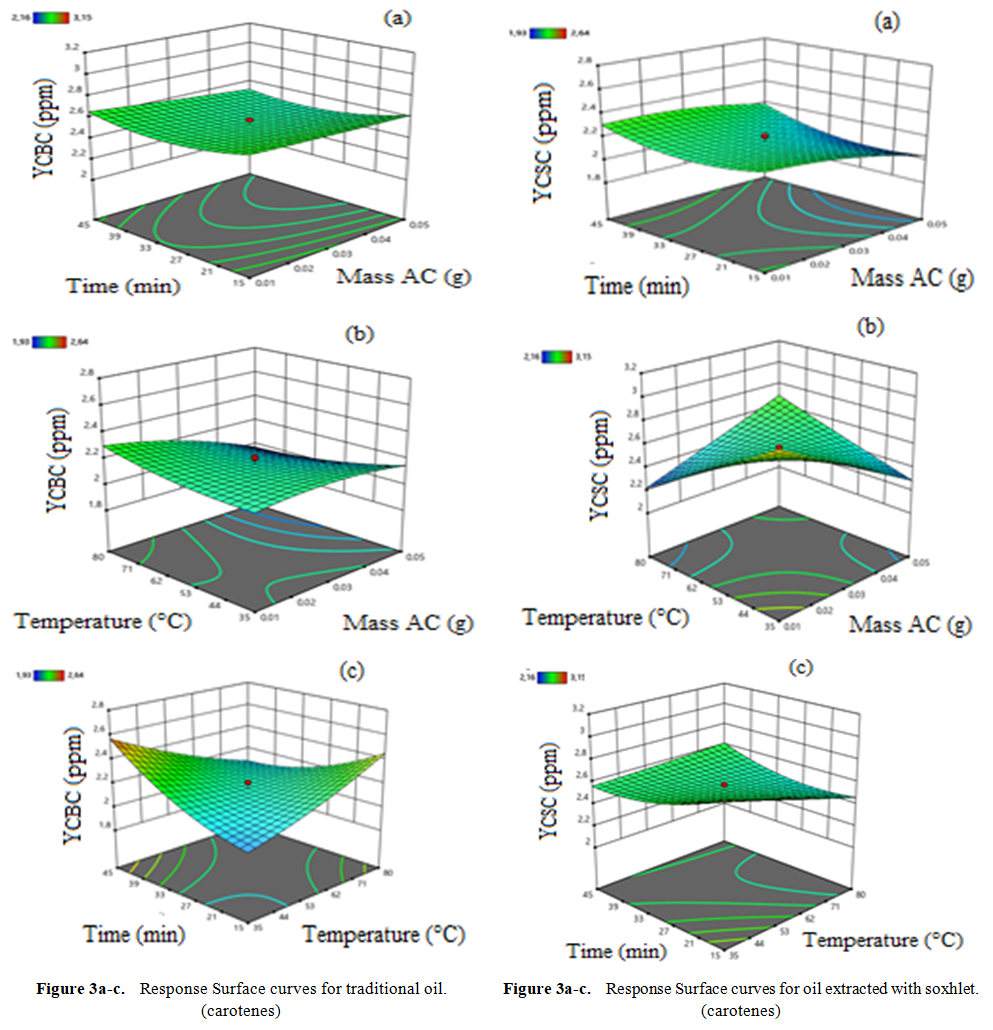
- Graphs are essential tools for interpreting results and drawing conclusions about factors influencing oil discoloration (raw oil and Soxhlet-based extract oil). Our experimental domain explores variations in three parameters mass of activated carbon, reaction temperature, and reaction time, which significantly influence our response surfaces. Response surfaces are three-dimensional (3D) graphs where the horizontal plane represents the variation domain of two factors, and the vertical axis depicts changes in the response surface (carotenes and chlorophylls) (Figure 3). From Figure 3a, interactions between temperature and mass detrimentally affect carotene discoloration. Increasing temperature decreases carotene content initially but may lead to oil denaturation beyond a threshold due to the presence of fatty acids inhibiting breakdown. Conversely, Figure 3b shows that increasing mass and temperature, as well as time and temperature, collectively favor reduced carotene concentrations in the solvent-extracted oil. This reduction is likely due to pigment adsorption on the activated carbon's specific surface area, characterized by macro pores. These findings align with prior studies on optimizing vegetable oil decolorization parameters [31], [32].It appears from figure (3a) that the interaction of temperature and mass disadvantages the discoloration of the carotene content. However, an increase in temperature leads to a decrease in carotene content but at a certain threshold this leads to oil denaturation. This can be explained by the dense presence of fatty acids present in the oil. However, an increase in temperature hinders the breakdown between the fatty acids. This corroborates with the work of [31]. A mass disadvantages the discoloration of carotene. In our work, mass has a negative influence. The more the mass increases, the blacker the oil becomes. Our results are in contradiction with those of [32] who carried out his work on the optimization of the parameters of decolorization of vegetable oils with bleaching earth. As for the percentage of the earth, the more the discoloration increases. The same phenomena are observed in figure (3b). Figures (3a) and (3b) respectively show that the cumulative effects of mass and temperature as well as time and temperature favor the decrease in the concentration of carotene content from 3.2 to 2.2 ppm and 3, 2 to 2.5 ppm in the oil extracted by the solvent. This reduction can result in the adsorption of pigments on the specific surface of our activated carbon which has macro pores. These results are similar to the work of [21] on the optimization of decolorization parameters of vegetable oils. The same phenomena are observed in figure (3c).
 | Figure 3. Response surface curve carotenes content |
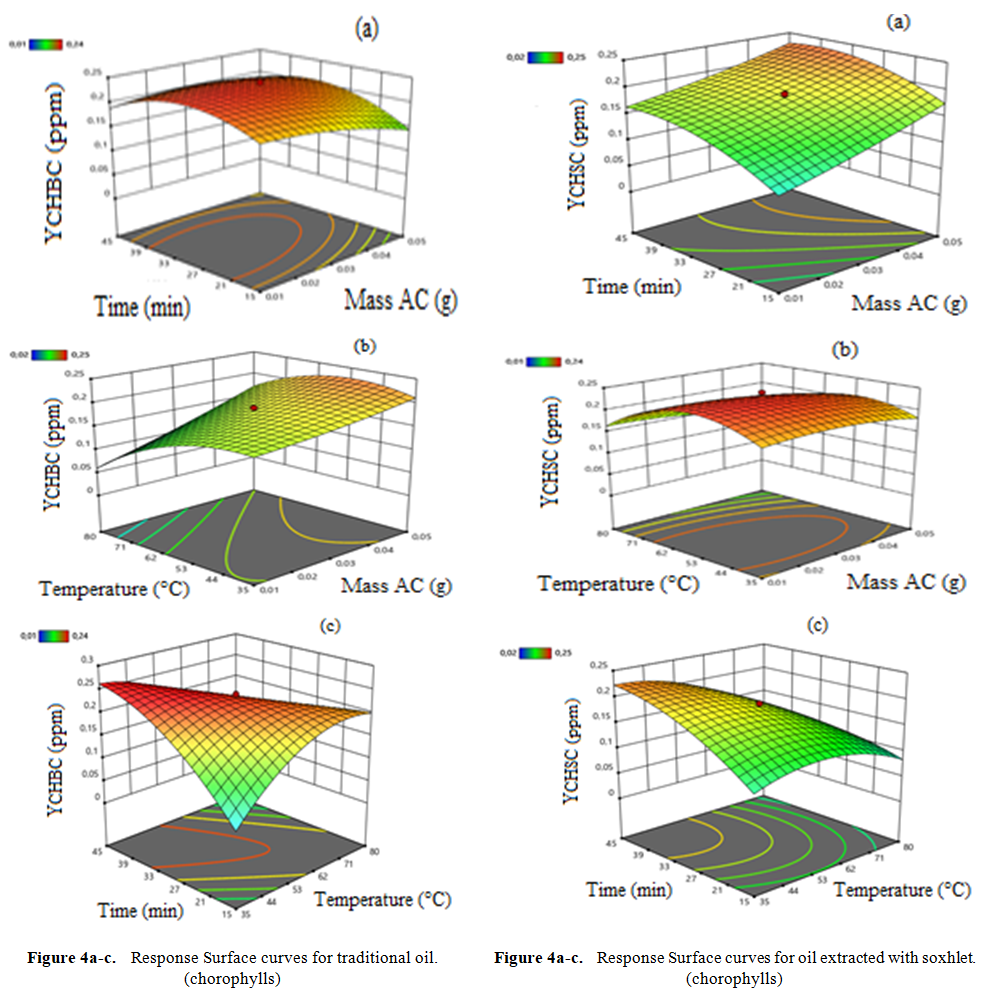 | Figure 4. Response Surface curve for chlorophylls content |
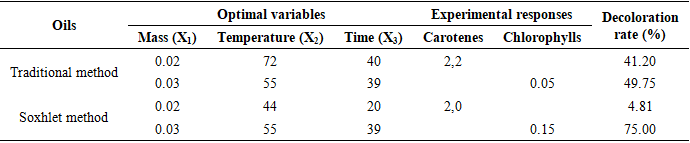
3.2.4. Optimum decolorization of Azadirachta indica A. Juss oil
- Table 5 summarizes the optimal conditions for oil decolorization, encompassing the combined optima of all variables and the contents of carotenes and chlorophylls. Optimization significantly improved the decolorization of Azadirachta indica A. Juss oil using our activated carbon from Phoenix dactylifera. In traditional oil, the decoloration rates for carotenes and chlorophylls were 41.20% and 49.75%, respectively (table 5). For Soxhlet-extracted oil, these rates were 4.81% for carotenes and 75.00% for chlorophylls. This indicates that chlorophyll reduction is more pronounced compared to carotenes for both extraction methods. Additionally, the low decoloration rate of carotenes in Soxhlet-extracted oil may be due to denaturation caused by extraction temperatures [11].
|
4. Conclusions
- The objective of this study was to decolorize Azadirachta indica A. Juss oil using activated carbon derived from Phoenix dactylifera. Thus, the characterization of AC prepared from Phoenix dactylifera seeds and activated with phosphoric acid allowed us to obtain an AC production yield of 77.01%, an iodine number of (427.95 ± 0.02) mg/g, a methylene blue number of (10.58 ± 0.01) mg/g, a specific surface area of (521.52 ± 0.02) m²/g, and a pHPZC of 5.5.The extraction of Azadirachta indica oils was carried out using both the traditional method and the Soxhlet method. The optimization of the discoloration of the obtained oils was carried out using a central composite design with the variable parameters being the mass of AC, the reaction time, and the experiment temperature, and with the response being the chlorophyll content and the carotene content. It appears that the mathematical models that explain the discolorization of Azadirachta indica oils by AC obtained from Phoenix dactylifera activated with phosphoric acid are second-degree mathematical models with interactions between the different parameters (time, temperature, and mass of AC). The most influential parameter, whether for determining the carotene or chlorophyll content, for both oil extracted using the traditional method or the Soxhlet method, is the mass of AC.Regardless of the extraction method of Azadirachta indica A. Juss oil, the optimal decolorization conditions are an AC mass of 0.02 g and 0.03 g for carotene and chlorophyll content, respectively, at a temperature of 55°C. Furthermore, the optimal decolorization temperature of Azadirachta indica A. Juss oil is 72°C and 44°C for carotene and chlorophyll content, respectively, for oil extracted using the traditional method and Soxhlet method, over a time of 40 and 20 minutes. Also, under optimal conditions, the decolorization rate are 40.20% and 4.81% for carotene content for oil extracted by the traditional method and Soxhlet method, respectively, and 49.75% and 75.00% for chlorophyll content. Optimal decolorization of Azadirachta indica oil is best for Soxhlet extraction method with minimal time (20 min) and minimum temperature (44°C).
ACKNOWLEDGEMENTS
- The authors thank the Department of Chemistry of the Faculty of Science of the University of Ngaoundere in Cameroon for provided specify the support given to our disposition in order to work in this research.
Conflick of Interest
- The authors declare that they have no conflict of interest.
Funding Declaration
- This work received no funding.