-
Paper Information
- Paper Submission
-
Journal Information
- About This Journal
- Editorial Board
- Current Issue
- Archive
- Author Guidelines
- Contact Us
Science and Technology
p-ISSN: 2163-2669 e-ISSN: 2163-2677
2024; 14(1): 1-3
doi:10.5923/j.scit.20241401.01
Received: Feb. 27, 2024; Accepted: Apr. 7, 2024; Published: Apr. 13, 2024

Correlations as Effect Sizes in Meta-Analysis
 Abstract
 Reference
 Full-Text PDF
 Full-text HTML
1Department of Statistics, Nasarawa State University, Keffi, Nigeria
2Department of Mathematics and Statistics, Federal University Wukari, Nigeria
Correspondence to: M. U. Adehi, Department of Statistics, Nasarawa State University, Keffi, Nigeria.
| Email: |  |
Copyright © 2024 The Author(s). Published by Scientific & Academic Publishing.
This work is licensed under the Creative Commons Attribution International License (CC BY).
http://creativecommons.org/licenses/by/4.0/

A number of interactions with postgraduate students over a span of 10 years from April 2013, and after teaching Meta-Analysis for about 5 years, has given adequate appreciation of the misconceptions among researchers, that Meta-Analysis is definitely Bio-Statistics in general. Bio-Statistics, being an application of Statistical methods in Biological environment, stands uniquely from Meta-Analysis. It is true, that many a times, Epidemiologic data is utilized in Meta-Analysis as a tool that reduces health risks emanating from treatment options that could mar expected positive outcomes. However, it is erroneous to conclude that all Meta-Analysis are carried out with data sets in Biology exclusively. Some literature consisting of a total of 377 studies were reviewed and summarized in this paper to support the claim that not all Meta-Analysis is carried out with data sets in Biology. Ten studies consisting of a total of 382 observations were analyzed to illustrate practical aspects of the methodology. In particular, among other effect sizes, correlations, involving the transformation into Fisher’s Z-score and back to correlations, have been of important consideration.
Keywords: Meta-Analysis, Correlations, Fisher’s Z-Scale
Cite this paper: M. U. Adehi, I. J. David, Correlations as Effect Sizes in Meta-Analysis, Science and Technology, Vol. 14 No. 1, 2024, pp. 1-3. doi: 10.5923/j.scit.20241401.01.
1. Introduction
- Meta-analysis according to (Borenstein, Hedges, Higgins, & Rothstein, 2009), is a statistical technique used to combine the results of multiple studies on a particular topic to derive a single conclusion. A lot of research goes on, on daily basis; In many of such instances, research has broadened views and brought about solutions to problems. In other instances, in fact, so many, research has become the reason for many controversies looming our society. Such controversies are research gaps that open opportunities and gateway for statisticians among other researchers/specialties to thrive.The meta-analyst in our opinion is the luckiest of the lot; he/she gets working to validate results of published/ unpublished work bordering around the controversies.The meta-analyst is only interested in published/ unpublished articles that address the same issues; Those articles that have parameters which address the same problem. It is therefore not ethical to include studies from articles that are different in terms of content of discussion.Selecting studies for the meta-analysis will require in depth literature review, while considering availability of effect sizes that effectively addresses the nature of the problem; Effect sizes could be difference in mean, risk ratio, odds ratio, correlation etc.The effect size for each study is used to calculate the within study variance and weights for fixed and random effects analysis involving a number of derived formulae (Borenstein, Hedges, Higgins, & Rothstein, 2009) that will enable the computation of a summary effect as well as heterogeneity.The quality of published/unpublished articles included in the analysis is essential to the power of the test results; Publication bias can be detected with a high I-squared statistic (heterogeneity) or mere observation of a funnel plot, or sensitivity analysis. Publication bias can be managed by removing those studies causing it, or conducting sub-group analysis.Data sets in Biology will refer to information on scientific study of life; Biostatistics on the other hand, refer to the use of statistical methods and techniques to improve the health of people and communities through tackling pressing research questions in Medicine, Biology and Public Health.Most meta-analysis are done with data sets in Biology, hence, there is the misconception that meta-analysis is indeed biostatistics. A good way to correct this misconception is in the use of correlations, a standardized form of covariances, as effect sizes in meta-analysis. Correlation studies generally enumerate the relationship between pairs of variables and generally useful in data analysis and concepts. Such data do not have to be data sets in Biology, they could be economic, socio economic, behavioral, political, educational, business related etc.
2. Methods
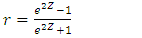
- According to (Borenstein, Hedges, Higgins, & Rothstein, 2009), when correlations are used for meta-analysis, the methods are as follows:For studies that report a correlation between two continuous variables, the effect size index could be the correlation coefficient.The sample correlation, r, is the estimate for the correlation parameter denoted by
 .The formula provided for variance of r is given by
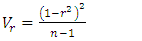 | (1) |
 can be transformed into the Fisher’s Z-scale to reduce dependence on r as in equation (1).Such transformation can then be converted back to correlations for summary effect and Confidence Intervals (CI).The transformation from sample correlation, r, to Fisher’s Z is
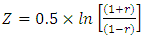 | (2) |
 is
is 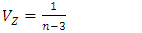 | (3) |
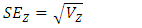 | (4) |
 | (5) |
3. Data Analysis and Results
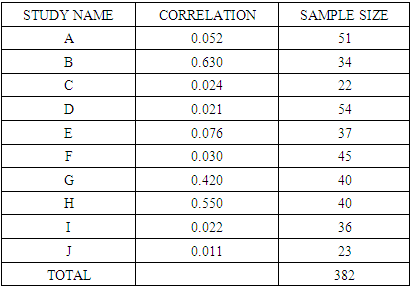
- Data was obtained in part from the study of (Sobejana, 2016), on the relationship between the use of e-learning on academic performance of students in basic English in selected higher education institutions in Davao Del Sur, Philippines. Sample size (382 in total) and other parts of the data were sourced electronically via google scholar search, and from some unpublished documents. Meta-analysis was carried out using Comprehensive Meta-analysis software, version 4; The independent variables comprising of indicators of e-learning: Provision of learning activities, Learner-Faculty Interaction, Learner-Software Interaction, Learner-Hardware Interaction, and Collaboration among learners, were treated as study names, while indicators were replicated in the literature search for electronically sourced data.In (Sobejana, 2016), only Learner-Faculty Interaction showed a strong relationship with academic performance; However, combining all the results of Table 1 in a single analysis (Meta-Analysis), the forest plot in Figure 1 based on ten studies of correlations as effect size, applying equations 1-5, and following a random-effects model, shows a mean effect size of 0.204 with 95% confidence interval of 0.032 to 0.365.
|
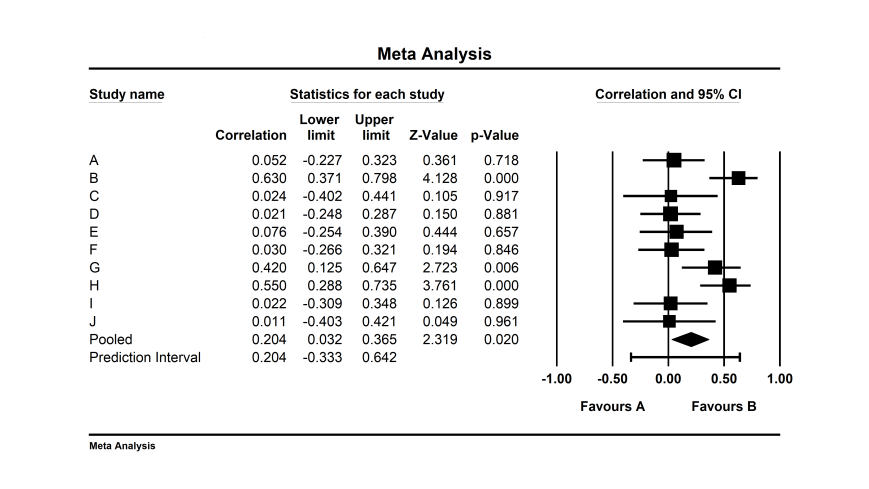 | Figure 1. Forest Plot Showing Mean Summary Effect of the Meta-Analysis |
 , using
  , we reject the null hypothesis and conclude that the mean effect size is not precisely zero. Then the mean summary effect, 0.204, can be interpreted to be a positively weak relationship between e-learning indicators in general and academic performance of students in basic English.The I-squared statistic is 63%, which tells us that some 63% of the variance in observed effects reflects variance in true effects rather than sampling error.Tau-squared, representing variance of true effect size is 0.05 in Fisher’s Z units, while Tau, representing standard deviation of true effect sizes is 0.223 in Fisher’s Z units.Our justification for using the random effects model is under the null hypothesis that the true effect size is the same in all ten studies. However, using the Q-statistic which is 24.6, and comparing it with
  degrees of freedom, and
  with
with  we rejected the null hypothesis and concluded that the effect sizes are different.
4. Discussion
- To buttress the fact that meta-analysis is not limited to data sets in Biology, some studies have been published as follows:According to (Cornelius-White, 2007), in a study involving classical, humanistic education and learner-centered models, posits positive teacher-student relationships as associated with optimal, holistic learning. 119 studies were included in the meta-analysis, which followed comprehensive search mechanisms, accuracy and bias control, with primary study validity assessment. 9 independent variables were coded, 18 were dependent while 39 variables were moderators. From the findings, correlations had wide variations and it was determined that correlation was the conservative and most appropriate primary statistic to represent the findings. The mean correlations,
 were above average compared with other educational innovations for cognitive and especially affective and behavioral outcomes.Another study by (Mor Barak, Travis, Pyun, & Xie, 2009) which used correlations as effect size, opined that the role of supervision did not impact positively on worker outcomes. Basically, the effects were only moderate ranging from r =0.3 to 0.4, as such, the recommendation for effective training for supervisors.(Higgins, Judge, & Ferris, 2003) used correlation in a meta-analysis to show how some influence tactics can affect work outcomes positively. Some of such tactics were Ingratiation, Self-promotion, Rationality, Assertiveness, Exchange, and Upward appeal. Where correlations were unavailable, the mean and standard deviations were available for computing the effect size. Also needed in each primary study included in the meta-analysis, were influence tactics already mentioned: Ingratiation, Self-promotion, Rationality, Assertiveness, Exchange, and Upward appeal. 31 studies were included in the analysis, they contained 37 independent samples that reported 98 correlations between individual influence tactics and work outcomes. The results showed that ingratiation and rationality had mean non-zero relationship with work outcomes, suggesting that their use by employers should result in a successful career outcome. As such, ingratiation and rationality both correlated much more strongly with performance assessment than with extrinsic success.The world of crime is not left out of meta-analysis as (Pratt & Cullen, 2005) carried out a meta-analysis using correlation, r, as effect size to assess predictors of crime, 200 studies were considered. Some of the strongest and most stable predictors of crime were racial heterogeneity, poverty, family disruption. The weakest predictors were policing, get tough policy effects. r was transformed using equation 2 to fisher’s Z scale for normality assumptions, and results showed that strong empirical theory support were theories for social disorganization and resource/ economic deprivation. Moderate theories were anomie/strain, social support/social altruism, and routine activity theory. Weak theories consisted of deterrence/rational choice and subcultural theories.
5. Conclusions
- The use of varying effect sizes in meta-analysis gives it a wide range of applications other than only data sets in Biology. Because randomized controlled trials are risky in the validity of drugs and vaccines in humans and living things in general, there is a dependence on meta-analysis to alleviate such risk in medicine, since meta-analysis thrives on already published work and research. It is however erroneous to conclude that meta-analysis is biostatistics as it could be deduced from some of the illustrations reviewed in this article.