Adeniran A. J.1, Edeh O. D. F.2, Ossia C. V.2
1Offshore Technology Institute, University of Port Harcourt, Nigeria
2Mechanical Engineering Department, University of Port Harcourt, Nigeria
Correspondence to: Ossia C. V., Mechanical Engineering Department, University of Port Harcourt, Nigeria.
| Email: |  |
Copyright © 2019 The Author(s). Published by Scientific & Academic Publishing.
This work is licensed under the Creative Commons Attribution International License (CC BY).
http://creativecommons.org/licenses/by/4.0/

Abstract
For corrosion protection of steel pipeline, the external coatings are usually single, double or triple layered. These external coatings are composed of an epoxy primer, an adhesive and a thick layer of polyethylene or polypropylene. Internal stresses in these applications result in the disbondment of these coatings after only few years in service. This finite element study evaluated the internal stresses generated during the application process for different coating grades and thicknesses, and compared these values with the measured adhesion strength. The results showed that the thickness and grade of the coating affect internal stresses at the interface, as well as, produce an edge effect at the end of the pipeline which affects these stress-values. The axis-symmetric simulation and modelling of a section of a pipe during coating application process gave the stress distributions as a function of coating thickness for fusion bonded epoxy (FBE) and polypropylene (PP) layers. Also, it was discovered that the higher the polypropylene (PP) coating thickness with respect to the coating thickness of fusion bonded epoxy (FBE), the higher the stress in a 3-layer system. It is concluded that FBE coatings are best utilized as a monolithic corrosion protection coating ahead of a 3-layer system because of the lower stress regime during the manufacturing process.
Keywords:
Fusion Bonded Epoxy (FBE), Polyproplene (PP), Finite Element (FE)
Cite this paper: Adeniran A. J., Edeh O. D. F., Ossia C. V., Evaluation of Internal Stresses Generated during Pipeline Coating Process, Science and Technology, Vol. 9 No. 1, 2019, pp. 1-6. doi: 10.5923/j.scit.20190901.01.
1. Introduction
In-service oil and gas steel pipelines are subjected to aggressive environmental parameters which corrode and compromise the integrity of those pipelines. These pipelines if not protected will lead to failure and serious facility, personnel and the environmental risks. Anti-corrosion coating protections, whether monolayer or multilayer, active or passive, must provide good mechanical strength, good aging and resistance to the corrosive environment [1]. Unfortunately, pipelines immersed in corrosive media, even with excellent external protection, still loose adhesion of the coating due to internal stresses generated during the coating application and as a result of continuous and cyclic operating pipeline temperature [2] [3] [4].In 1969, Corcoran [5], developed a test methodology to estimate the internal stresses in pipe works, and Perersa’s work suggests that increasing the coating thickness can increase the energy, given in equation (1), associated with internal shear stresses at the coating/substrate interface and make adhesion loss easier [6]. | (1) |
where: c is the Coating thickness,ɛ is the Stress associated with internal stress,E is the Coating elastic modulus,ν is the Coating poisson ratio.Since 3-layer representation of the real system and the reproduction of the real internal stress state are very difficult, Chang et al [7] analytical calculations for 3-layer pipe coating was adopted. With simple hypothesis, Chang et al [8] realised a finite element modelling study on both epoxy monolayer and 3-layer systems. In this occasion, physical properties were all considered as dependent on temperature and the model was based on linear thermoplastic laws.Computer-based modelling and simulation of various types of pipe coating as applied to a grade of steel was conducted and the performances in the offshore environment as a function of coating application conditions and thickness of coating layers were evaluated. Stresses generated in single layer and 3-layer systems applied on the same grade of steel for deployment in the offshore environment were evaluated. This evaluation helped to draw useful and valuable deductions that will enhance optimum service recommendations of offshore pipelines and boost reliability of the lines in service.Long term coating performance is essential to prevent deterioration of a pipeline, and errors in selection and application may lead to failure with enormous remedial cost [9]. A study of the different types of coating such as this, and their suitability of application on pipelines installed offshore of the coast of Nigeria will ensure long-term operation, minimized intervention and forestall expensive service disruption. Also since corrosion costs an estimated three to four percent of gross national product for direct and indirect costs in the developed countries [9] [10], (while figures for the developing countries although unavailable, but expected to be significantly high), selection of the most economical effective coating technique for mitigating the effects becomes a critical design decision in order to minimize such cost [14].As long as coating remains bonded to steel and cathodic protection is correctly applied, monitored and maintained, no corrosion risk exist [11].Until now, in the Gulf of Guinea (GoG), there remain many buried uncoated pipelines [12]. Often, the cost of complete cathodic protection of such pipelines is prohibitively high. In that case, protection would be applied only to the hot spots which could reduce the leak to 5 to 10% at a cost of 15% of full protection [13]. Although single layer coating will suffice where the installed pipeline in always in a static, laterally stable condition; multi-layer costing becomes imperative where external environment tends to easily wear out the external coating. Besides, additional coating does not only offer additional protection, but also provides more weight for lateral stability and insulation to maintain higher temperature of internal fluid at ambient temperature.After surveying studies on Fusion Bonded Epoxy (FBE), this work shall focus on performance evaluation, in terms of resistance to disbondment as a result of continuous and cyclic operating temperatures during the application processes of these various types of coating on grades of steel while being prepared for deep water services in the Gulf of Guinea (GoG). Four ways of coating evaluation are: (1) Long-term water immersion and soil stress test to evaluate the adhesion of coating system, (2) Current requirement test, (3) Measurement of coating conductance or leakage conductance, (4) Locating breaks and holidays with a pearson survey. In this study, the long term water immersion type was adopted.
2. Methodology
Two model coating systems were chosen for this purpose. The first coating was a single layer FBE coating (thickness = 0.025m) on both smooth and roughened steel surfaces. The second coating system was a 3-layer coating system comprising the FBE primer, an adhesive polypropylene layer, and polypropylene outer layer.After the designated immersion time, the specimens are removed from the immersion tank, rinsed with tap water and then wiped dry. After the specimens cool down to room temperature, the scratch test was conducted immediately. A commercially available scratch machine (Figure 1) was utilised for the scratch tests following the ASTM D7027-05 test standard [15]. The tangential and normal forces as well as scratch distance and instantaneous depth experienced by the stylus were recorded. A tungsten carbide spherical tip with a diameter, 2mm was used. The scratch tests were conducted under linearly progressive normal load from 1 to 95N. The scratch length was set at 100mm, and a scratch velocity of 100mm/s was employed.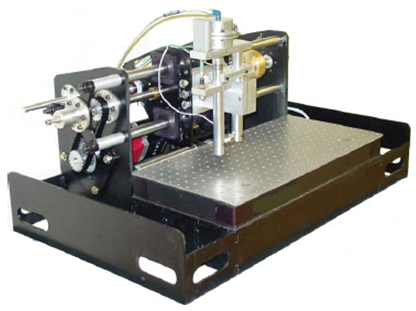 | Figure 1. SMS Scratcher IV |
Table 1. Pipe material parameters
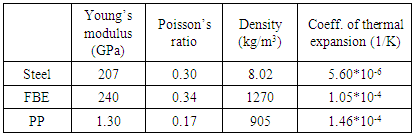 |
| |
|
Three methods were employed to detect the onset of coating delamination and to validate the findings from each other: Direct visual observation, sample rusting by oxidative liquid, and surface profile detection by Laser Confocal Scanning Microscopy (LCSM). The colour of the coating system can be directly observed by the naked eye since the interface light reflection condition is altered by the coating layer debonding. The first point of such a colour change is defined as the onset of coating debonding. Consequently, the samples are rusted using an oxidative liquid. With one open cutting on the scratch path, the scratched samples are immersed into the water with 5% vol chlorine bleach for 6 hours. The debonded interface is exposed to the oxidative liquid and the metal surface rust readily through capillary flow effects. The rusted portion can be easily observed to identify the onset coating de-lamination.Regarding the FBE material property degradation, differential scanning calorimeter (Figure 2) was used to conduct experiments for the FBE coatings with two curing conditions. Samples with and without water immersion exposure were analysed. | Figure 2. Differential Scanning Calorimeter (Model 821, Mettler Toledo, USA) |
The research design was obtained by subjecting the crude pipeline to active coating manufacturing operations prior to deployment to the offshore environment. The pipe section to be coated was held stationary and the heat transfer in the coat manufacturing process was simulated by using COMSOL Multiphysics application.Two materials with distinct thermal conductivities made up the structure: FBE layer on the top, and a steel layer on the bottom. An insulation material layer occupies the largest space in the structure, and a wooden batten between the aluminium and concrete layer. The top and bottom boundaries have heat flux conditions governed by equation (2).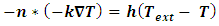 | (2) |
where: Text is the exterior temperature defined at 0°C for the top boundary and at 95°C for the bottom boundary. The ISO 10211:2007 standard specifies the values of the thermal resistance, R which is related to the heat transfer coefficient, h by equation (3). | (3) |
The simulation data were based on the typical service conditions expected in offshore Gulf of Guinea. This includes the crude oil pipeline operating temperature, mud line or sea bed temperature, and the basic value of thermal properties of various materials involved in the research. The system simulator, COMSOL was used in the analysis of the possibilities that could arise during pipeline coating processes prior to deployment in the Gulf of Guinea.The internet and various literatures provided easy access to data pertaining to thermal constants associated with different grades of steel, epoxies, and polyethylene and polypropylene.COMSOL Multiphysics® software was used in conjunction with the Microsoft excel to come up with graphics of temperature distribution (isothermal cartograph). Temperature gradient exists between the maximum operating temperature and the minimum installation temperature. Operating temperature during pipeline coating can be predicted using the heat transfer model presented in equations (4) and (5). The longitudinal strain is proportional to the magnitude of the temperature difference. In an unrestrained uniaxial condition, the longitudinal thermal stress is zero, but the thermal strain, ɛt is given as equation (4). | (4) |
where: αt is coefficient of thermal expansion (6.5*106 °C -1 for steel), and θ is value of temperature change T2-T1.In the restrained condition, the longitudinal strain was zero, but the compressive stress generated by the restrained expansion was given as equation (5). | (5) |
The negative sign reflects the fact that the stresses for a positive temperature increase under restrained conditions is compressive. Similarly, the stresses are tensile for a restrained pipe if a temperature decrease exists. When a two-dimensional element is heated but subjected to a restraint in the y-direction, the strain in the x-direction is increased due to the poisson ratio ν effect. This was illustrated in equation (6). If the element is heated and restrained in both the x- and y-directions, the principal stress becomes: | (6) |
where: E is the Young’s modulus of elasticity, σ is the thermal stress generated, α is the coefficient of thermal expansion, θ is the change in temperature and ν is the poisson ratio of the material.
3. Results and Discussion
The linear elastic model with all parameters constant shows interesting result trends. The thickness of Polypropylene (PP) and Fusion Bonded Epoxy (FBE) were varied, one at a time, in the 3-layer system; while the thickness of the fusion bonded epoxy was varied in the 1-layer system. The results of the 1-layer system are shown in Figures 3 to 9 and the results for the 3-layer system are in Appendix A (Figures A1 – A5).With same FBE and PP thickness (Figure A1), we observe the high stress fields are concentrated at the FBE-Steel interface and fades away towards the FBE-PP interface. The PP region recorded the lowest stress concentration in this occasion. For reduces PP thickness and same FBE thickness (Figure A2), the PP region still recorded the lowest stress, while the FBE-steel interface still maintained similar stress distribution. However, for reduced FBE thickness and same PP thickness (Figure A4), while FBE-steel interface still maintained similar higher stress distribution, there is much lower stress towards the pipe surface.Further reduction of PP thickness at constant FBE (Figure A3) resulted in the high stress distribution near the pipe surface than before. On the other hand, a further reduction in FBE thickness (Figure A5) favoured much lower stress distribution near the pipe surface and higher at the FBE-Steel interface.These suggest that reduced FBE thickness will favour lower stress distribution near the surface of the pipe but much higher stress concentration at the FBE-Steel interface.
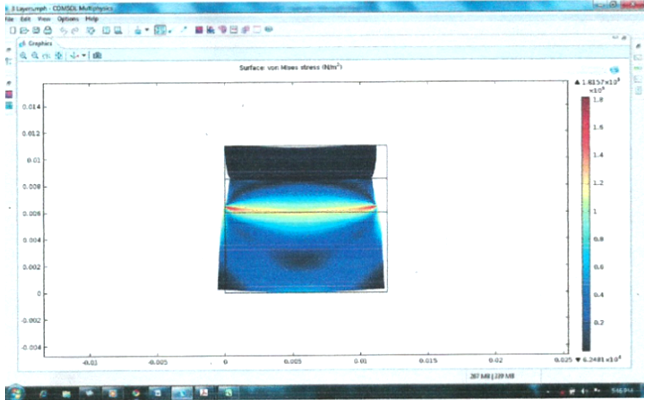
3.1. COMSOL Multiphysics Simulation Results for the 1-layer FBE Coated System
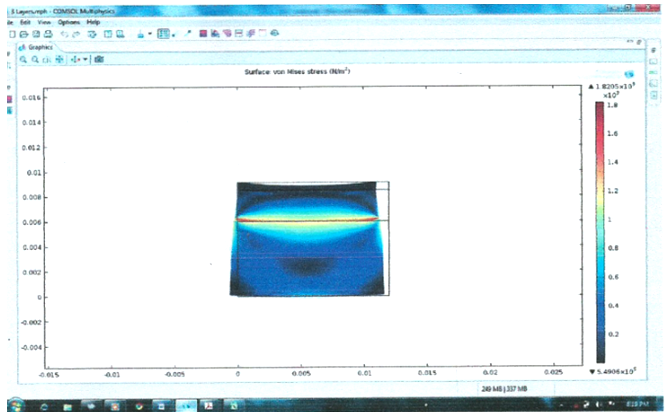
Authors observed from the isovalue cartograph (Figure 3) the high stress concentration at the FBE-Steel interface which gradually decayed or faded away towards the pipe surface. | Figure 3. Von mises Stress field isovalues cartograph for a 1-layer system |
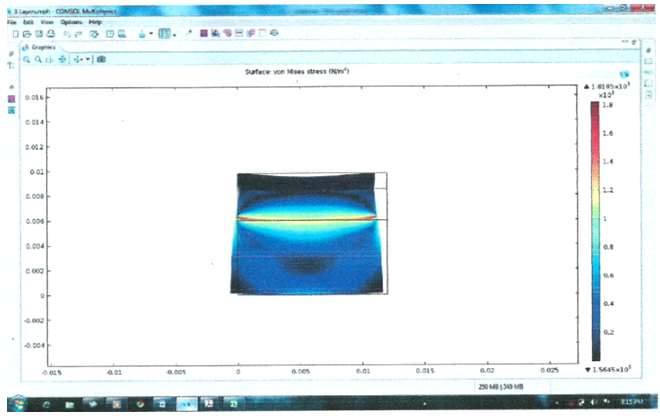
3.2. COMSOL Multiphysics Simulation Results for the 1-layer System with Reduced FBE Thickness
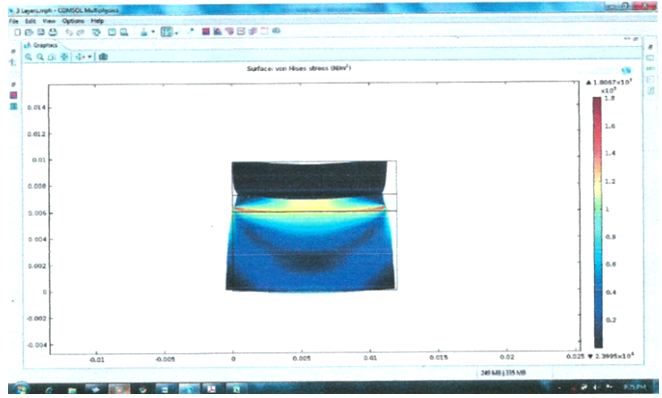
The stress field of Figure 4 reveal high stress distribution near the pipe surface and maintained much higher concentration of stress at the FBE-Steel interface.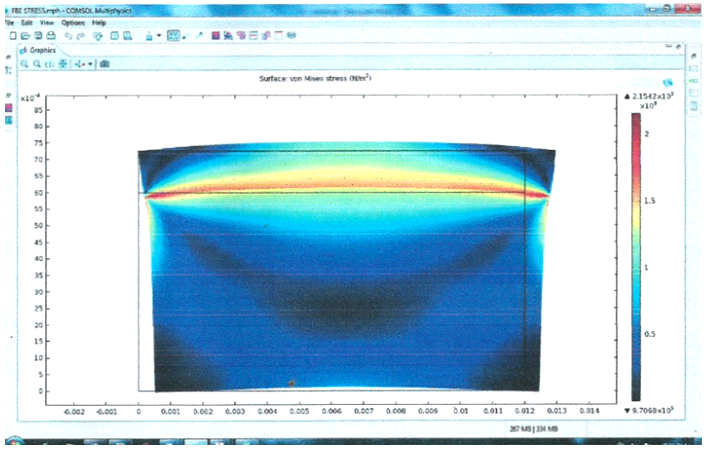 | Figure 4. Von mises Stress field isovalues cartograph for a 1-layer system with reduced FBE thickness |
3.3. COMSOL Multiphysics Simulation Results for the 1-layer System with Further Reduced FBE Thickness
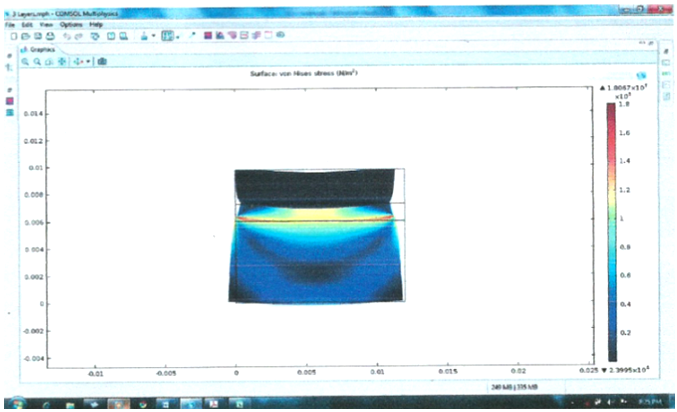
It was absolutely clear here that a further reduction in FBE thickness in a 1-layer system (Figure 5) will expose the pipe surface to the same high stress as recorded in the FBE-Steel interface. This suggests that for a 1-layer FBE coated system, increased FBE thickness will favour lower stress distribution towards the pipe surface but much higher stress concentration at the FBE-Steel interface.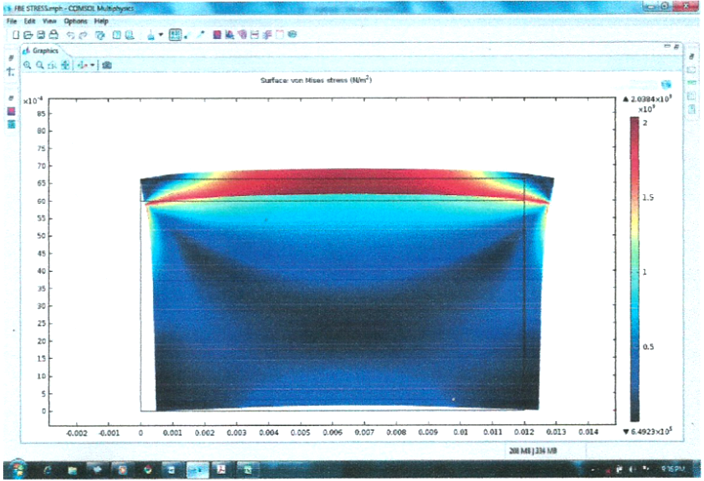 | Figure 5. Von mises Stress field isovalues cartograph for a 1-layer system with further reduced FBE thickness |
3.4. Stress Distribution during Curing of the Pipe-end Section
From the result shown in Figure 6, it can be said that the cooling modelling was consistent with industrial observations in terms of thermal exchange. The shrinkage value of polypropylene (PP) coating (12mm at each end of the pipe of a pipeline 2m long), which corresponds to 12mm by linear extrapolation for a 20m length pipeline, was also consistent with the order of magnitude around 10mm observed at the end of application on polypropylene (PP). Further analysis of the significant difference (p-Value = 0.678) between the two cases with the 3-layer having a higher standard deviation of 4.0 against 3.7 for the 1-layer.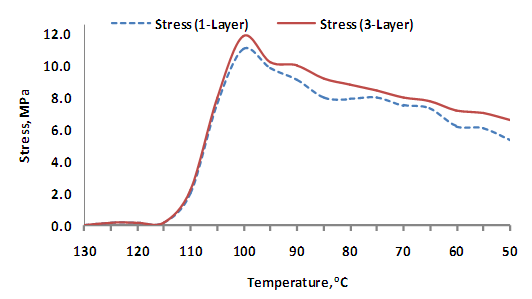 | Figure 6. Stress distribution during curing at the pipe-end section with PP coating |
3.5. Stress as a Function of FBE Thickness in a 1-layer System
Result shown in Figure 7 reveal a polynomial trend (y = -0.774x2 + 3.001x + 8.978) for increase of FBE thickness from 0.156mm to 2.5mm, with coefficient of determination, R2 = 0.954.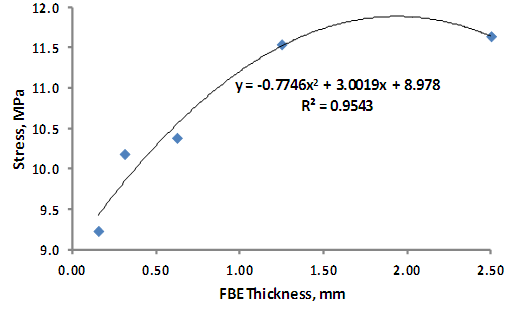 | Figure 7. Stress due to FBE thickness for a 1-layer system |
3.6. Stress Distribution for a 3-layer System
Stress distribution for constant FBE with varying PP, and that with constant PP and varying FBE (Figure 8). The results show that increase in the thickness of polypropylene increased the thermal stress on the system and a reduction of the thickness of Fusion Bonded Epoxy (FBE) also increased the thermal stress on the system in the case of constant polypropylene thickness. However, further analysis reveal a low significance (p-Value = 0.354) in the difference between the stresses generated at constant PP and varying FBE (Stdev = 3.26), and that at constant FBE and varying PP (Stdev = 0.076).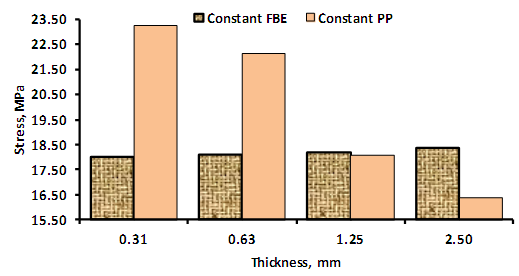 | Figure 8. Stress distribution for a 3-layer system |
3.7. Stress Evolution Along the Pipe at Epoxy/PP Interface and at Steel/Epoxy Interface
The results (Figure 9) show an extrapolated von mises stress evolution in the two interfaces of the 3-layer system. Though the FBE/Steel interface records a high stress level at the pipe-end section, this stress diminishes towards the centre of the pipe.Moreover, it should be noted that no dissipation is considered to take into account viscoelastic behaviour of polypropylene and fusion bonded epoxy. Hence, this model leads to a temperature field that should be confirmed experimentally to verify the accuracy of the computer simulation. That will enable us to determine the precision of the estimates.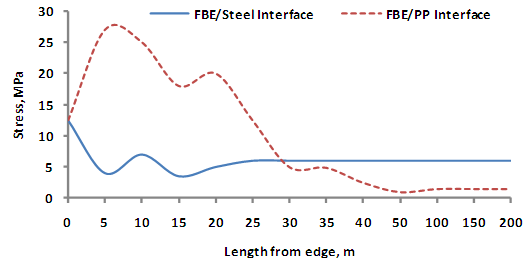 | Figure 9. Stress at the interfaces variation with length from pipe edge |
4. Conclusions
This study allowed the use finite element modelling to evaluate stresses generated during coating applications. The model used accounts for viscous dissipation and allowed authors to obtain realistic stress values, giving interesting perspectives for the study. Stresses are concentrated near the interface, in the adhesive layer at the edge of the pipe. This was coherent with the real life observations which indicate current failure in this layer at the pipe-ends. Coatings are generally disbanded or eliminated at several centimetres to the end of pipes to limit this stress concentration. Also, Epoxy/steel interface exhibited significant stresses, of several MPa, on the whole length of the pipe. This value was similar to the residual adhession value of epoxy primer after ageing which could explain the disbonding observed on 3-layer coating.This coupled modelling/equipment approach uutilized in this study can be continued to obtain more accurate results, and hence improve the understanding of stress generation during coating application and ageing.Furthermore, it was established that relatively low stress values were generated during the manufacturing process of the 1-layer FBE coating system compared to a 3-layer system of combination of FBE, adhesive layer and a polypropylene topcoat.
Appendix A
 | Figure A1. Von mises Stress field isovalues cartograph for a 3-layer system of same thickness of both FBE and PP |
 | Figure A2. Von mises Stress field isovalues cartograph for a reduced thickness of PP |
 | Figure A3. Von mises Stress field isovalues cartograph for a further reduced thickness of PP |
 | Figure A4. Von mises Stress field isovalues cartograph for a reduced thickness of FBE |
 | Figure A5. Von mises Stress field isovalues cartograph for a further reduced thickness of FBE |
References
| [1] | D. Melot, G. Paugam, M. Roche, “Disbondment of pipelines coatings and their consequences on corrosion risks”, 17th International Conference on pipelines protection, BHR Group, Edinburgh, 2007. |
| [2] | L. Belec, Y. Joliff, “Numerical study on the evaluation of thermal and mechanical stresses during the welding of coated pipelines”, Progress in Organic Coating, 111, October 2017, 336-342. |
| [3] | Y. Joliff,, L. Belec, E. Aragon, “Influence of the thickness of pipeline coating on internal stresses during the manufacturing process by finite element analysis”, Computational Materials Science, 68, February 2013, 342-349. |
| [4] | E. Legghe, Y. Joliff, L. Belec, E. Aragon, “Computational analysis of a three-layer pipeline coating: Internal stresses generated during the manufacturing process”, Computational Materials Science, 50 (4), February 2011, 1533-1542. |
| [5] | E.M. Corcoran, "Determining stresses in organic coatings using plate beam deflection," Journal of Paint Technology, 41, 1969, 635 - 640. |
| [6] | D.Y. Perera, “Progress in Organic Coatings”, 28, 1996, 21. |
| [7] | B.T. Chang, A.H. Jiang, H.J. Sue, S. Guo, “Disbondment mechanism of 3LPE pipeline coatings”, 17th International Conference on Pipeline Protection, 2007, 247–256. |
| [8] | B.T.A. Chang, H.J. Sue, H. Jiang, H, Browning, D.B. Wong, H. Pham, S. Guo, “Integrity of 3LPE Pipeline Coatings – Residual Stresses and Adhesion Degradation”, Proceedings of IPC2008, 7th International Pipeline Conference, Canada, September 2008. |
| [9] | M.A. Alrudayni, “Evaluation of External Coating Performance on Buried Pipelines in the Oil and Gas Industry”, FIU Electronic Theses and Dissertations. 2319, (2015). |
| [10] | L.T. Popoola, A.S. Grema, G.K. Latinwo, B. Gutti, A.S. Balogun, “Corrosion problems during oil and gas production and its mitigation”, International Journal of Industrial Chemistry 4:35, 2013. |
| [11] | M. Roche, D. Melot, G. Paugam, “Recent experience with pipeline coating failure”, 16th International Conference on Pipeline protection, BHR Group, Paphos, Cyprus, 2005. |
| [12] | H.S. Frazer, "Field joint coating of pipelines – effect of soluble salt contamination on 2-layer heat shrink sleeve performance", Anti-Corrosion Methods and Materials, 63 (2), 2016, 105-115. |
| [13] | M. Parker, E.G. Peattie, “Pipeline Corrosion and Cathodic Protection: A practical manual for corrosion engineers, technicians, and field personnel,” 3rd Ed, Houston, Texas, Gulf Professional Publishing, 1999. |
| [14] | K.G. Compton, “Selection of Protective Coatings For Metals”, Corrosion, 4(3), 1948, 112-122. |
| [15] | ASTM D7027-05, Standard Test Method for Evaluation of Scratch Resistance of Polymeric Coatings and Plastics Using an Instrumented Scratch Machine, ASTM International, West Conshohocken, PA, 2005, www.astm.org. |
| [16] | H.J. Sue, B.T.A. Chang, “External Pipeline Coating Integrity”, DOT PHMSA Advances Coatings R&D Contract # DTPH56-06-T-000022. |

 Abstract
 Reference
 Full-Text PDF
 Full-text HTML