-
Paper Information
- Paper Submission
-
Journal Information
- About This Journal
- Editorial Board
- Current Issue
- Archive
- Author Guidelines
- Contact Us
Science and Technology
p-ISSN: 2163-2669 e-ISSN: 2163-2677
2017; 7(2): 54-60
doi:10.5923/j.scit.20170702.03

Development of Alternative Simulator for the Sugar Manufacturing Process
 Abstract
 Reference
 Full-Text PDF
 Full-text HTML
Diego Christoforo Petrassi1, Felipe Nascimento Arroyo2, Diego Henrique de Almeida3, André Luis Christoforo2, Francisco Antonio Rocco Lahr4
1Production Engineering Department, UniSEB University Center (UniSEB), Abrahão Issa Halack Street, Ribeirão Preto, Brazil
2Centre for Innovation and Technology in Composites – CITeC, Department of Civil Engineering (DECiv), Federal University of São Carlos, São Carlos, Brazil
3Department of Engineering, Pitágoras College, Poços de Caldas, Brazil
4Department of Structural Engineering, University of São Paulo, São Carlos School of Engineering (EESC/USP), São Carlos, Brazil
Correspondence to: André Luis Christoforo, Centre for Innovation and Technology in Composites – CITeC, Department of Civil Engineering (DECiv), Federal University of São Carlos, São Carlos, Brazil.
| Email: |  |
Copyright © 2017 Scientific & Academic Publishing. All Rights Reserved.
This work is licensed under the Creative Commons Attribution International License (CC BY).
http://creativecommons.org/licenses/by/4.0/

This research has the proposal create a simulator to valuate and simulate the capacity of a sugar factory, supporting the strategic decision making process. The process of creating simulator starts when processes are mapped and all most important variables are defined. After that it was necessary to transmit measured data through the calculations for spreadsheet, which in this case was used Excel (because it is a simple language and a common program). In sequence, several tests were performed to check results obtained by simulation. The results refer to the simulator reliability, with comparison of SIMULSUGAR results with simulation conducted in sector. Creating a table was necessary to demonstrate the accounting comparison between SIMULSUGAR results with simulation performed in the sector.
Keywords: Capacity, Simulation, Sugar manufacturing
Cite this paper: Diego Christoforo Petrassi, Felipe Nascimento Arroyo, Diego Henrique de Almeida, André Luis Christoforo, Francisco Antonio Rocco Lahr, Development of Alternative Simulator for the Sugar Manufacturing Process, Science and Technology, Vol. 7 No. 2, 2017, pp. 54-60. doi: 10.5923/j.scit.20170702.03.
1. Introduction
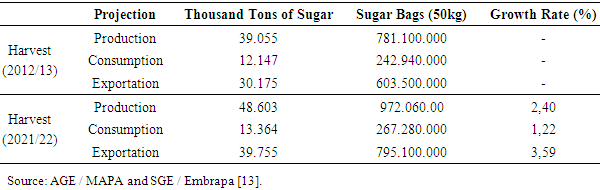
- Based on data, forecasts and market analyzes, sugar and alcohol industry plants practice the continuous search for improvements. This fact indicates that it is necessary and extremely important create indicators to control production and create technical parameters or standards. Standards created from process indicators should be considered as operational rules, thus optimizing production, reducing losses and improving industrial performance.With indicators creation for the processes, comes up the necessity to control them, so that programs, software’s or simulators meets as interesting alternatives. The advantage of using a simulator is that, with little information, there are complex and well-directed responses to productive processes.Employing simulation for planning and decisions in production of sugar with relation to its productive capacity are essential strategies for its development, related with the industrial power of growth [1].Objectifying identify possible process problems, its necessary to point out the critical points of productive system, responsible for inhibiting productive capacity and reducing industrial performance [1].It is understood that production capacity variations require attention. There are two types of variation, the smaller than productive capacity and the one that for some reason is larger than productive capacity. It is important understand them and especially identify them, because if the capacity is limited by any process or equipment, this process or equipment, in a possible expansion, should be resized. Already when this capacity of the process or equipment is greater than productive capacity, this process or equipment cannot be resized, since any action in this direction is unnecessary investment.In this sense, when it comes the sugar manufacture and encompassing all specifications, it is understood that sugar factory is nothing more than an extraction industry, considering the fact that sugar is produced naturally by sugar cane. Then, sugar factory only concentrates this product during process, following the proper specifications [6, 7, 8, 10, 11, 15, 16, 19, 22, 24 and 25].It is known that one of the major concerns in sugar production is how much sugar can be recovered and how much by-product is generated. These by-products are stored, and are reprocessed in order to extract as much sucrose as possible.In this way, the production line must be properly calibrated so you can receive the broth in order to concentrate it and extract the sugar. Following this, the intermediate equipment capacity, that receives the broth and has the function of storing, processing and sending it to continue the process, must be fully known. Knowing these capabilities is necessary so that there are no surprises during manufacturing time, knowing that the production is continuous.The constant changes in the market forces professionals to constantly change the process. Because they do not have quick and accurate knowledge of the effect on final products, these actions, incur the underutilization of equipment, and especially efficiency losses [6, 7, 8, 10, 11, 15, 16, 19, 22, 24 and 25].Finally, to make changes, it is necessary to foresee the processes and mainly equipment capacity. Thus, developing a tool that generates a strategic vision for making decisions regarding new goals and goals established for organization is the proposal of this work. Thus, software was developed to evaluate problems inherent to the production cycle, making use of a case study.The general objective of this work is develop a simulator that assists in planning and operational decisions related to the productive capacity of sugar and alcohol industry plants, specifically in sugar manufacturing process.THEORETICAL REVIEWSugar and alcohol industrySugar cane was introduced in Brazil along with Portuguese colonization in 16th century, more precisely in 1532, when Martin Afonso de Souza founded the town of São Vicente in São Paulo, creating the first sugar mill in Brazil, named São Jorge. In 1550, Brazil assumed the position of largest producer of sugar in the world. The first sugar mill was founded in the captaincy of Pernambuco, which belonged to Duarte Coelho, due to the ideal soil and climate capacity of region and driven by the disposal ease of sugar produced for Europe [4].The sugarcane sector came increasing, when crisis of 1929 made explicit problem that the sector faced. In this period, organs were established to regulate the sector and directed actions that should be taken, the DCSP - Defense Commission for Sugar Production and later SAI - Sugar and Alcohol Institute. Since then, sector has achieved great growth in domestic market, as well as in international market. Certain historic landmarks made possible the country obtain new markets to commercialize sugar cane products, such as Revolution in Cuba, making it open to new markets such as North American, since most exports would To Europe [4].It is known that around 1990, the 'Proálcool’, a measure taken to protect produced alcohol in the country, adopted a percentage of alcohol that should be added in gasoline, forcing production in the country. However, this percentage increase further, creating greater incentives for sector production and establishing fiscal incentives, causing invest even more in ethanol. Finally, market had a rise when alcohol vehicles appeared and recently was expanded with the emergence of flex-fuel vehicles, which run on both: ethanol and gasoline [1, 3, 5, 14 and 21].The sugar and alcohol industry is responsible for harvesting and processing about 32.7 million tons of sugarcane, and is intended to increase by 3.25% through the 2018/19 harvest, corresponding to a processing of 47.34 million tons. The estimated projection of ethanol production is around 58.8 billion liters and domestic consumption market is estimated in 50 billion liters, with 8.8 billion going to foreign market. The ethanol produced in Brazil is subject to expansion in the coming years, also due to the consumption growth by domestic market [13].Table 1 present sugar production projections, consumption and exports, comparing the harvest (2012/13) with estimate for 2021/22 harvest. These data indicate the expected growth for domestic and external sectors.
|
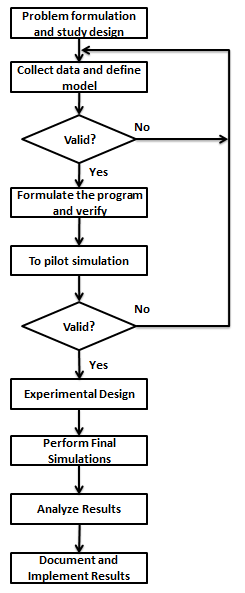 | Figure 1. Simulation steps Flowchart [12] |
2. Material and Methods
- SettingsIt is necessary know some concepts that are important for methodology part understanding. Are they:- Soluble solids: are all dissolved solids in solution of cane (broth). Among them are: sugars, organic sugars, amides, salts, gums, pectins, etc.;- Brix: represents the soluble solids percentage present in the solution. It is the most used parameter in sugar and alcohol industry, for process control;- Recovery: indicates the sucrose amount that has been converted into final product. Generally speaking, a high recovery from sugar factory indicates that it extracts much of the sucrose and loses fewer sugars in the by-products.Assembly simulatorSimulator construction is aimed to calculating the capacity of sugar manufacturing equipment. The initial work part, which is linked to modeling, encompasses the equipment capacity and layout of the same. It is important note that equipment capacity is linked to sugar production, which is accounted for daily.To better understand the studies carried out, is important to know a little about manufacture of sugar, products and by-products generated. Figure 2 illustrates sugar manufacturing process.
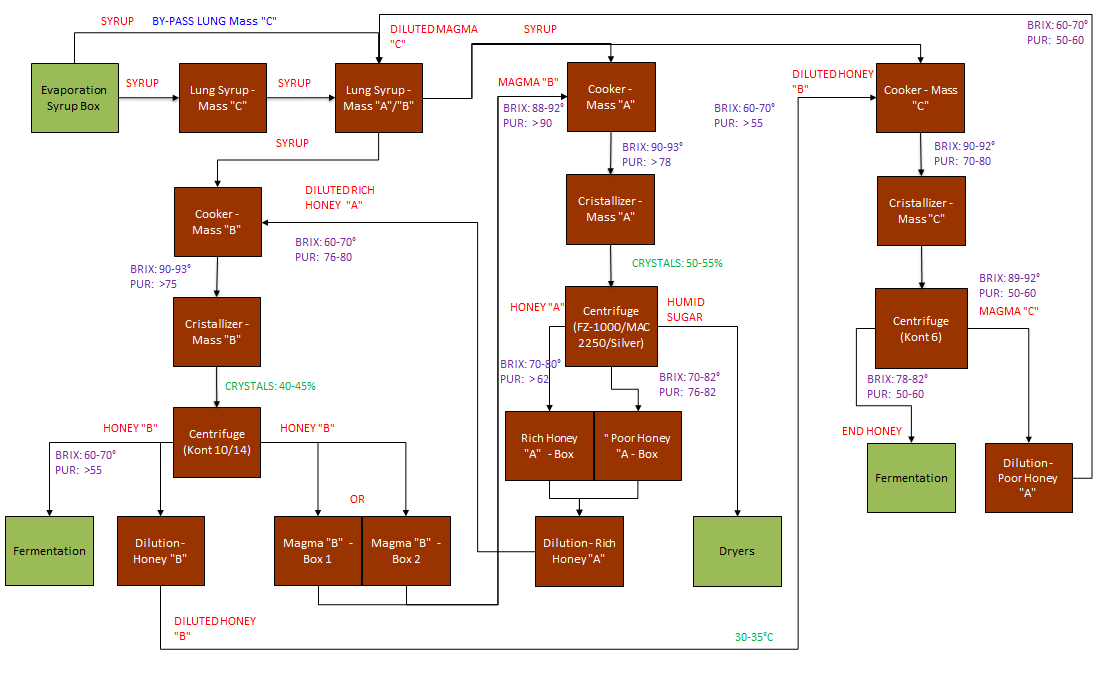 | Figure 2. Sugar manufacturing process |
|
 | (1) |
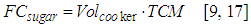
 indicates the amount of sugar when processing "A" mass, amount of magma when processed "B" and "C" mass. In this case, mass processed in centrifuges continues and discontinues. The
  refers to the mass cookers volume "A", "B" and "C". The TCM indicates the content of mass crystals, being 50% in mass "A", 45% in mass "B" and 45% in mass "C". [9, 17]
 | (2) |
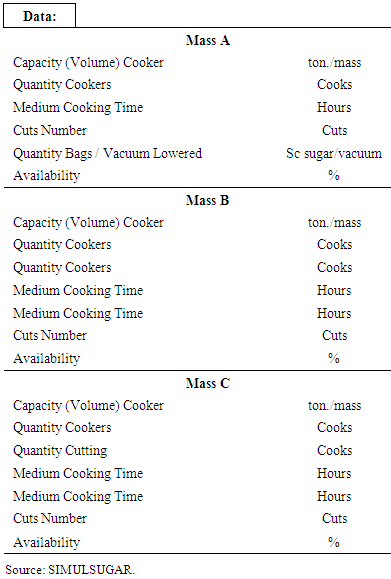
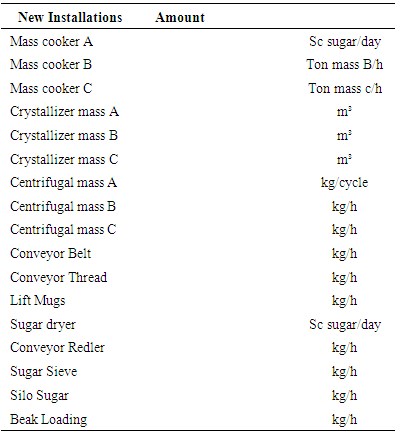
 indicates the honey amount that will be generated in three masses ("A", "B" and "C"). This fact is important as we have seen. Companies are looking for a good factory recovery, nay, and a good use of sugar in process. This fact indicates how much material is being processed or will be in processing. [9 and 17]It is also known that in addition iterations with equipment capacity, also allied with amount of existing equipment in order to identify the actual capacity of plant and/or equipment.Therefore, the part concerning new installations should be filled in. In this case, indicated places are supplied with data referring to processes and equipment. Table 3 shows the part referring to new installations.
|
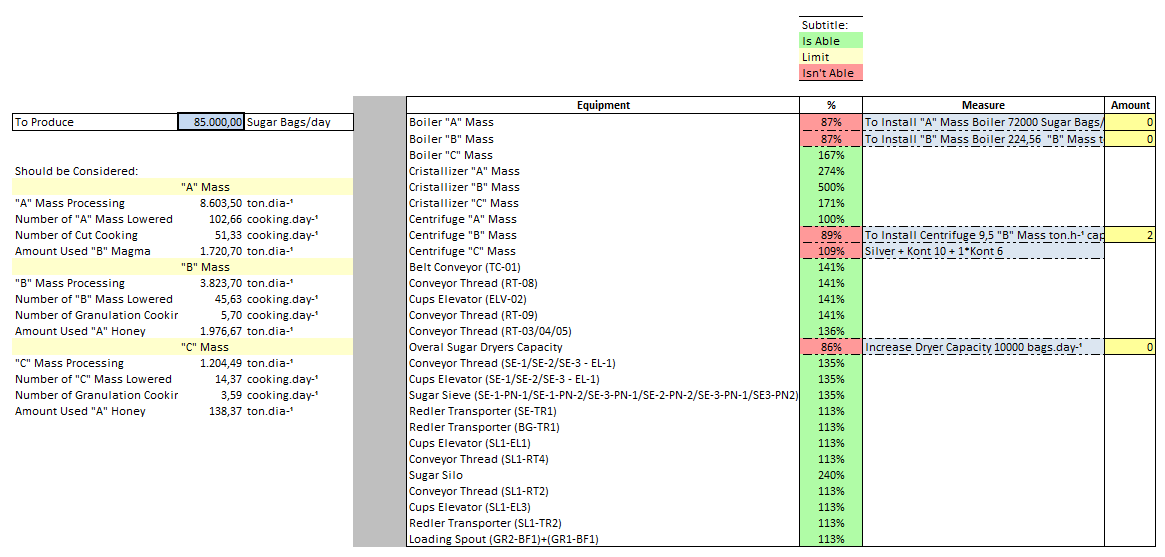 | Figure 3. SIMULSUGAR Interface |
3. Results and Discussion
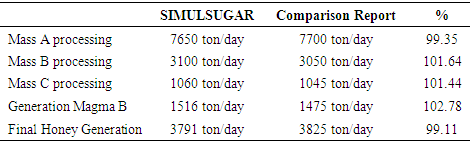
- Evaluating SIMULSUGAR's efficiency and confidence, a comparison was made with mass and energy balance of the case study carried out. It is important note that the objective of simulator is to evaluate productive capacity and assist in decision-making process. Ergo, balance used as comparative only evaluates how much material will be generated and will be in process.The existing equipment and tanks in process have capabilities stipulated in their respective projects. To evaluate these capacities, design capacity product of each equipment was found by availability of equipment time, demonstrating the actual capacity of this equipment’s. Subsequently, these capacities were compared with masses capacity calculated, finding the equipment capacity.Comparisons made correspond to capacity calculated, in other words, the technical power of SIMULSUGAR was evaluated. Table 4 shows some comparison data.
|
4. Conclusions
- SIMULSUGAR besides simple interface has the advantage of using Excel, which is a common and simple programming tool.Analyzing parameters that were used for comparison, it was observed that ratio between SIMULSUGAR and Comparison Report is small, even being disregarded. Parameters evaluated in comparison were found in surveys carried out and are the process indicators that should be taken into account, since such points are essential to identify problems of productive capacity.SIMULSUGAR presents an interesting feature, despite need to supply it with process information, the difference is realize that it does not require so much data to perform simulations. It is necessary supply the program with data of equipment in process and then it becomes simple. In this case, only put the desired sugar production value (in 50 kg sugar bags) and it will bring the main information of line production. It is also shown if the equipment restricts production in specific cases.SIMULSUGAR was able to reproduce a real production situation of a sugar-alcohol plant located in vicinity of Guariba-SP city.In this sense it is possible perceive the power of SIMULSUGAR, which becomes a powerful tool to aid decision-making process with respect to productive capacity.