-
Paper Information
- Paper Submission
-
Journal Information
- About This Journal
- Editorial Board
- Current Issue
- Archive
- Author Guidelines
- Contact Us
Science and Technology
p-ISSN: 2163-2669 e-ISSN: 2163-2677
2015; 5(2): 33-38
doi:10.5923/j.scit.20150502.03
Fertility Situation in Bangladesh: Application of Revised Bongaarts Model
 Abstract
 Reference
 Full-Text PDF
 Full-text HTML
Md. Rashedul Islam1, Md. Nurul Islam1, Md. Monsur Rahman1, Md. Golam Hossain1, Md. Rafiqul Islam2
1Department of Statistics, University of Rajshahi, Rajshahi, Bangladesh
2Department of Population Science and Human Resource Development, University of Rajshahi, Rajshahi, Bangladesh
Correspondence to: Md. Rashedul Islam, Department of Statistics, University of Rajshahi, Rajshahi, Bangladesh.
| Email: |  |
Copyright © 2015 Scientific & Academic Publishing. All Rights Reserved.
In this paper we used Revised Bongaarts Model (RBM) for estimating approximately correct value of total fertility rate (TFR) for data obtained from 1975-2011, nationwide demographic surveys. The contribution of each of the proximate variables has been obtained through the decomposition of TFR for the period 1975-2011 at four points of time. Our analyses clearly indicate that contraceptive practice is playing the key role in fertility change in Bangladesh. The findings of the study provide a basis for drawing out some policy adoption and prescribe some recommendations for further decrease in TFR of Bangladesh.
Keywords: Original Bongaarts Model (OBM), Revised Bongaarts Model (RBM), Fertility Situation, Miscarriage & Stillbirth, Contraception, Fetal Wastage
Cite this paper: Md. Rashedul Islam, Md. Nurul Islam, Md. Monsur Rahman, Md. Golam Hossain, Md. Rafiqul Islam, Fertility Situation in Bangladesh: Application of Revised Bongaarts Model, Science and Technology, Vol. 5 No. 2, 2015, pp. 33-38. doi: 10.5923/j.scit.20150502.03.
Article Outline
1. Introduction
- Bangladesh is the most densely and is the 8th most populated country in the world. According to the results of the 2011 Population and Housing Census (PHC), the population of the country stood at about 14, 98, 00, 000 with a population density of 1,015 persons per square kilometer, which is the highest population density in the world (BBS, 2011). During the past century, the population of Bangladesh has increased exponentially. Between 2001 and 2011 censuses, about 19.8 million people were added to the population, which represents a 15% increase and a 1.37% annual growth rate. Bangladesh has undergone a remarkable demographic change over the last 45 years. In 1971-1975, women in Bangladesh were having on average 6.3 children. The total fertility rate (TFR) declined to 5.1 children fifteen years later and to 4.2 children in 1989-1991. The TFR, plateau at around 3.3 per woman for most of the 1990s when the three earlier Bangladesh Demographic and Health Survey (BDHS) took place (BDHS, 1993/94, 1996/97, 1999/2000). The fertility rate has declined slightly to 3 children per woman (BDHS, 2004). Comparison of the TFR, with other Asian countries that have implemented a Demographic and Health Survey (DHS), indicates that, with a TFR of 3, Bangladesh is in the mid-range among the countries-below Nepal 4.1 in 2001, Cambodia 3.8 in 2000, and the Philippines 3.5 in 2003, but higher than India 2.8 in 1998-1999, Indonesia 2.6 in 2002-2003, and Vietnam 1.9 in 2002 (BDHS, 2007; Alene & Worku, 2008; Gurmu & Mace, 2008; Mekonnen & Worku, 2011). The level of fertility in a society is directly influenced by a set of variables called intermediate variables or proximate determinants. The primary character of an intermediate fertility variable is its direct influence on fertility. Davis and Blake (1956) produced the first systematic classification of the proximate determinants of fertility through which economic, social and other factors must operate to control fertility. Bongaarts (Bongaarts, 1978 and Mosley, 1978) revised the original classification and provide a simple analytical method accounting framework, which permits a quantitative assessment of the contribution of different proximate determinants to give fertility levels (Cain & Weininger, 1973; Heer & David, 1966; Defranzo, 1976; Bongaarts & Potter, 1983; Ijaiya et al., 2009). Bongaarts (1982) demonstrated that most of the variation in fertility was due to four intermediate variables which were marriage, contraception, induced abortion and lactational infecundability. If a proximate determinant such as contraceptive use changes, then fertility necessarily changes assuming the other proximate determinants remains constant (Kohli, 1977; Saleem & Pasha, 2008). As a result, fertility differences among population and changes in fertility over time can always be traced to variations in one or more of the proximate determinants (Saleem and Pasha, 2008; Jayaraman et al., 2008).In Bangladesh, Islam et al. (1996) and some other researchers (Kabir & Rob, 1990; Islam & Islam, 1993; Abedin & Islam, 1994) showed contraception was the most important fertility inhibiting factor from 1971 to 2007, followed by lactational infecundability, marriage and induced abortion. To improve our clear understanding of the fertility change (Islam, 1996; Jayaraman et al., 2008; Mekonnen and Worku, 2011), we critically examine the effect of major proximate determinants: marriage, contraception, lactational infecundability on fertility and their changing effects. The fertility inhibiting effects of these proximate determinants have significant implications on reproductive health and future population growth (Spoorenberg, 2009). This study attempts to identify the four intermediate variables namely proportion married among females, contraceptive use effectiveness, fetal wastage (including, induced abortion) and duration of lactational infecundability and investigates their impacts on change in the level of fertility. During this period decomposing Original Bongaarts Model (OBM) (Bongaarts, 1983) and RBM (Islam et al., 2014) assesses the individual contribution made by each of the four intermediate variables to change the fertility level. The study also examines how well these determinants predict fertility level in Bangladesh. This has been done by comparing observed total fertility rate as estimated by the model.
2. Sources of Data
- Data have been derived from Bangladesh Fertility Surveys 1975, 1989 and Bangladesh Demographic and Health Surveys 1993-94, 1996-97, 1999-2000, 2004, 2007 and 2011. All these surveys are nationally representative and the data have provided by these surveys are of good quality.
3. Methodology
3.1. The Original Bongaarts Model
- Bongaarts model of estimating the effect of four proximate determinants assumes that the natural reproductive capacity that is total fecundity rates (TF) is nearly the same for all women, but their actual reproductive performance is modified by four major proximate determinants. In his model, Bongaarts (1978) expressed TFR is the product of four indices measuring the fertility inhibiting effect of these four indices and the TF is the average number of live births expected among women who during their entire reproductive period, remain married, do not use contraception, do not have any induced abortion and do not breastfeed their children (Bongaarts, 1982). According to Bongaarts model, the TFR can be written as
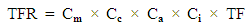 | (1) |
3.2. Revised Bongaarts Model (RBM)
- In original Bongaarts model, it is replaced only the index “all fetal wastage” (combination of miscarriage, abortion and stillbirth) instead of the index “induced abortion” which was one of the proximate determinants of fertility. Other indices have remained same as proposed by Bongaarts original model. Revised Bongaarts model (Islam et al., 2014) is
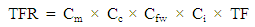 | (2) |
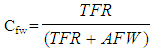 | (3) |
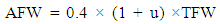 | (4) |
3.3. Total Fertility Inhibiting Effect Accounted for Proximate Determinants
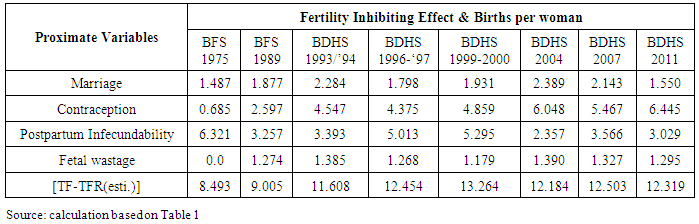
- The difference between the TF, taken as 15.3 in 2011 BDHS and the estimated TFR is attributed the result of the inhibitory effect of each variable. The total inhibiting effect is prorated by the proportion of the logarithm of each index to the sum of logarithm of all indices (Wang, 1987).
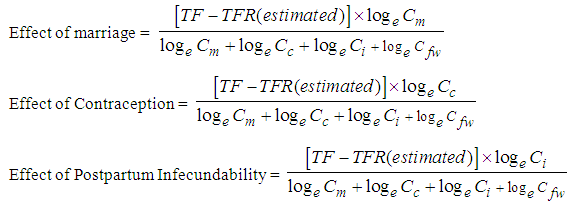
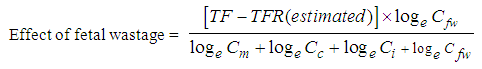
 | (5) |
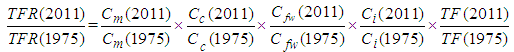
3.4. Decomposition of the Changes in Fertility
- Revised Bongaarts model (RBM) given by the equation (2) of 3.2 can easily be turned to a decomposition equation that allows the quantification of the contribution made by each of the four intermediate fertility variables to an observed change in fertility between two time points t1 and t2 the basic equation is as follows
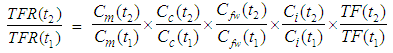 | (6) |
 | (7) |
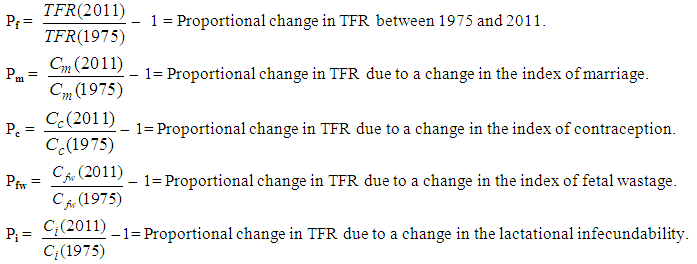
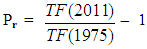 = Proportional change in TFR due to a change in the remaining proximate determinants: natural fecundability, spontaneous intrauterine mortality and permanent sterility.Equation (1) can be rearranged as
 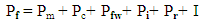 | (8) |
4. Results and Discussion
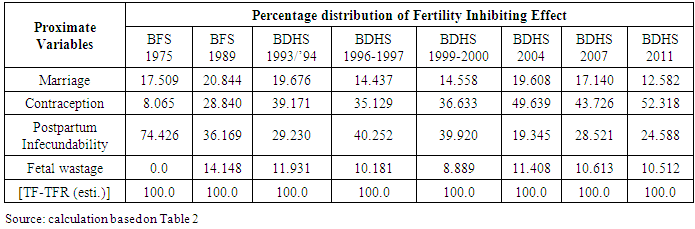
- On the basis of OBM given in equation (1) and RBM in equation (2), the estimated values of the measures and indices for different time points are presented in Table 1. The complement of the indices represents the proportionate reduction in fertility attributed to the fertility determinant. The lower the estimated value of the indices, the larger the fertility reduction effect. Thus, we have found the value of Cm in 1975 was 0.859, indicating that the proportion of married women reduces fertility by 14.1%, while the value of Cm in 1989 was 0.785, in 1996-1997 was 0.781, in 19999-2000 was 0.776, in 2004 was 0.731, in 2007 was 0.7474 and in 2011 was 0.8142 indicating that the proportion of women married were reduces fertility by 21.5%, 21.9%, 22.34%, 26.9%, 25.26% and 18.58% respectively. The value of Cc in 1975 was 0.932 indicating that the index of contraception reduces fertility by 6.8%, while the value of Cc in 1989 was 0.718, in 1996-1997 was 0.548, in 1999-2000 was 0.5294, in 2004 was 0.4537, in 2007 was 0.4757 and in 2011 was 0.425 indicating that the index of contraception reduces fertility were by 28.20%, 45.2%, 47.06%, 54.61%, 52.43% and 57.5% respectively.
|
|
|
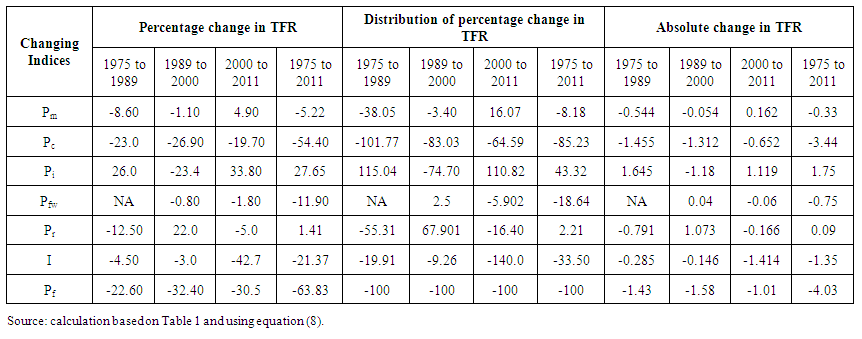 | Table 4. Decomposition of changes in TFR in Bangladesh: 1975 to 2011 |
5. Conclusions
- Revised Bongaarts model (RBM) indicates that between 1989 and 1999-2000, the amount of decrement of TFR was about 34% and it was about 36% between 1989 and 2004, the amount of decrement of TFR was only 3% between 2000 and 2004; the amount of decrement of TFR was 42% between 1989 and 2007, the amount of decrement of TFR was 10% between 2004 and 2007; the amount of decrement of TFR was 4.3% between 2004 and 2011; but the amount of increment of TFR was 6.6% between 2007 and 2011; the amount of decrement of TFR was 38.4% between 1989 and 2011. These were primarily caused by an increase in the use and effectiveness of the contraceptive methods. Thus to achieve the replacement level of fertility in Bangladesh the policy implications can be drawn as follows:Ø Awareness should be made-up to increase the use of modern contraceptive methods, which have better use-effectiveness.Ø Make certain available information regarding bad effect of teenage pregnancy through different electronic and print media.Ø Provide information among couples, low costing and greater benefit for the mother and the child for a long term exclusive breastfeeding.