-
Paper Information
- Paper Submission
-
Journal Information
- About This Journal
- Editorial Board
- Current Issue
- Archive
- Author Guidelines
- Contact Us
Science and Technology
p-ISSN: 2163-2669 e-ISSN: 2163-2677
2014; 4(3): 42-49
doi:10.5923/j.scit.20140403.02
Assessment of Groundwater Quality Using Multivariate Statistical Techniques in Terengganu
 Abstract
 Reference
 Full-Text PDF
 Full-text HTML
Usman Nasiru Usman, Mohd Ekhwan Toriman, Hafizan Juahir, Musa Garba Abdullahi, Ali Auwalu Rabiu, Hamza Isiyaka
East Coast Environmental Research Institute, University Sultan Zainal Abidin, Malaysia
Correspondence to: Usman Nasiru Usman, East Coast Environmental Research Institute, University Sultan Zainal Abidin, Malaysia.
| Email: |  |
Copyright © 2014 Scientific & Academic Publishing. All Rights Reserved.
Despite the importance of groundwater in Terengganu, Malaysia, quality assessment has received little attention, and effort to use hydrochemistry data to solve particular problems are even fewer or non-existent. This paper, reports results from large hydrochemistry data analysed using multivariate statistical techniques such as Cluster Analysis (CA), Discriminant Analysis (DA) and Principal Component Analysis (PCA) with the objectives of determining the spatial variability of groundwater and to identify the sources of pollution that presently affects the groundwater. The water quality data was monitored at ten different wells, over the period of six years (2006-2011) using 24 water quality parameters. The CA allowed the formation of three clusters between the sampling wells reflecting differences on water quality at different locations. DA as a data reduction techniques was used to evaluate spatial variability in water quality, as it uses only 3 parameters (Ca+, NO2, and PH) affording 73.33% correct assignation to discriminate between the clusters using forward stepwise mode from the original 24 parameters, while backward stepwise mode yielded 83.33% correct assignation to discriminate nine parameters (Ca+, Mg2+, Fe2+, SO4-, Cl-, AS, Mn, NO2, and conductivity). PCA was used to examine the root of each water quality parameter due to nature and anthropogenic activities based on the three cluster regions. It identified eight PC’s, responsible for 76.45% of the total variance in the data set. The main factors obtained indicate that parameters influencing groundwater quality of the clusters are mainly related to natural (dissolution of soil and rocks), pointsource (municipal wastewater and industries) and non-point source pollution (agriculture) in the region. The results of this study clearly demonstrate the usefulness of multivariate statistical techniques in Geochemistry.
Keywords: Multivariate statistical techniques, Cluster analysis, Discriminate analysis, Principal component analysis
Cite this paper: Usman Nasiru Usman, Mohd Ekhwan Toriman, Hafizan Juahir, Musa Garba Abdullahi, Ali Auwalu Rabiu, Hamza Isiyaka, Assessment of Groundwater Quality Using Multivariate Statistical Techniques in Terengganu, Science and Technology, Vol. 4 No. 3, 2014, pp. 42-49. doi: 10.5923/j.scit.20140403.02.
Article Outline
1. Introduction
- Without water life could not be possible on the earth for all living organisms, plants, lower animals and human being. It is next to the air in importance for human existence. Groundwater is a vital renewable resource that has been taken for granted and giving little protection. Despite the enormous important of these resources, the importance of water to life on earth, particularly human being, becomes clearer when one consider its role in various aspect of human endeavour; they include domestic, industrial, agricultural, laboratoryand recreational uses. Groundwater is considered a limited resources in most locations: increasing evidence on groundwater contamination in recent years, coupled with concern about human health and ecological effects of contaminants such as nitrate, pesticides has heightened pressure on public agencies to better groundwater(National Research Council, 2000).However, contaminated water can caused diseases, especially in areas where people throng. In 1981, WHO estimated that 80% of all sickness and disease is caused by polluted water and estimated that in developing countries three out of five people have no access to safe drinking water and only one out of four has sanitary facilities.Global efforts to improve access and quality of drinking water have been hindered by rapid urbanisation. According to the data presented at world water in Stockholm, the percentage of people in urban areas with access is declining. According to Anders Berntell, Executive Director of Stockholm International Water Institutes (SIWI) “bad water kills more people than HIV, Malaria and War together, affecting the lives of families and economic development of many countries of the world ” He said at the world water week conference being held in Swedish capital September, 2010.Water quality is mainly influence by anthropogenic effects; unplanned disposal of waste water generated from municipal, industrial and agricultural sources with little or no treatment prior to discharge is a common practice in many developing countries including Malaysia (Juahir, 2009) and this lead to the subsequent leaching of the pollutant into the ground and cause significant degradation of the groundwater. However, due to low hydraulic gradient of the area, as the area is flat, the potential of sea water intrusion threat is likely to be higher particularly during low recharge (drier month), (Shamsuddeen et al, 2014).Different multivariate statistical techniques such as Cluster Analysis (CA), Discriminant Analysis (DA), and Principal Component Analysis (PCA) were employed in this research work. These techniques can be used to obtained relationship between parameters and sampling site, to identify the factors and sources influencing groundwater quality and to suggest useful tools for both management of water resources and monitoring of groundwater quality (Nosrati, 2011). CA was employed to examine the spatial groupings of the sampling wells. It is a common method to classify variables into cluster (Massartand Kaufmann, 1983). CA and PCA are commonly supported by DA as a confirmation for CA and PCA and are usually referred to as pattern recognition techniques (Adams, 1998). The application of different pattern recognition techniques to reduce the complexity of large data set has proven to give a better interpretation and understanding of water quality data (Brown et al, 1980).Therefore the main objectives of this research work are to determine the spatial variability of groundwater and to identify the root of the pollution that presently affects the groundwater.
2. Materials and Methods
2.1. Study Area
- Terengganu is situated in the North-Eastern Peninsular of Malaysia and it is bordered to the North-West by Kelantan and to the South-West by Pahang and to the East by South China Sea; with a total area of land of 13035km2 and the maximum elevation of the state is 1507m.Terengganu has a population of 1,015,776 people as of 2006, Malay make up 94.7% of the population and Chinese 2.6% while Indians 0.2%. Other ethnic group raises the remainder 2.4%. The state population was only 48.7% urban; the majority lived in the rural areas of the state.The study area has a strong tropical monsoon climate, relatively uniform temperature within 21℃ and 32℃ range, January till April; the weather is dry and warm with humidity in the lowland consistently high between 82%-86% annually. The annual average rainfall is 2,032mm-2540mm with the most it, falling between Novembers till January. The geological system of the area ranges from the Cambrian to the quaternary (570 million years to 10,000 years ago). Almost half of the peninsular Malaysia notably in the main range is occupied by granitites. These granitic emplacements coincide with the culmination of the late Triassic orogenic event during which older strata were folded and deformed.
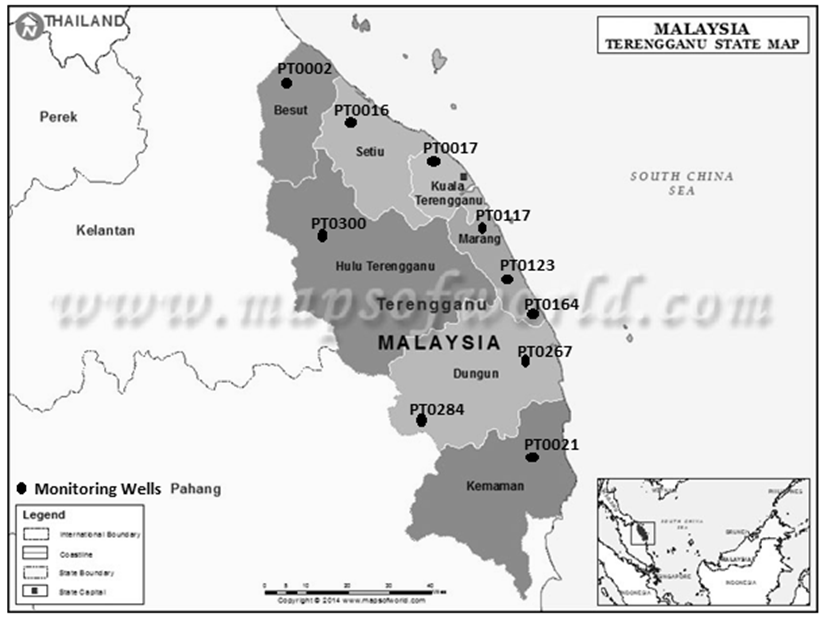 | Figure 1. Map of the study area showing the monitoring wells |
2.2. Data Collection and Treatment
- Secondary data were used in this research work. The water quality data in this study were obtained from ten monitoring wells by the department of mineral and geosciences, Terengganu. Each of the ten monitoring wells were observed and identified based on the availability of recorded data from the period of 2006-2011. The ten wells are: PT002, PT017, PT021, PT116, PT117, PT123, PT164, PT267, PT284, and PT300. Even though there are 50 water quality parameters but only 24 consistently sampled parameters were selected and a total of 60 samples and 1440 observation were used for the analysis.The water quality data obtained from the department of mineral and geosciences is in note pad format, it was then later converted into Microsoft Excel 2007 for all groundwater quality parameters. The monitoring wells were also sorted out (A-Z) in the normalised data set, while non-numerical variables were also transformed into numerical variables for convenient analysis. All the statistical analyses were performed using Microsoft excel 2007 and XLSTAT 2014 versions.
2.3. Analytical Methods
- Environmetric method is deemed to be the best approach to avoid misinterpretation of large complex environmental monitoring data (Simeonov et al, 2002). The most common environmetric methods used to determine the spatial variability and to identify the pollution sources are Cluster Analysis (CA), Discriminant Analysis (DA), and Principal Component Analysis (PCA).
2.3.1. Cluster analysis
- This is a group of multivariate techniques which primarily classify (Massart and Kaufmann, 1983) variables or cases (observation or samples) into cluster with high homogeneity level within the class and high heterogeneity level between classes. The spatial variability of groundwater was determine by CA. CA was first performed to group all sample site in order to classify them into cluster to minimized their number. We use CA to link sample site in the configuration of a tree with different branches (Dendogram) which provide visual summary of the clustering process, presenting a picture of the group and their proximity. Branches that have linkage closer to each other indicate a stronger relationship between sample/variables or cluster of sampling site/variable.In this present study, CA was applied for the grouping of ten different wells using ward’s linkage method (Ward 1963). A classification scheme using Euclidean distance (straight line distance between two point in C-dimensional space define by C variable) for similarity measurement together with Ward method for linkage produces the most distinctive groups where each member within groups is more similar to its fellow member than to any member outside the group (Guler et al, 2002).
2.3.2. Discriminant Analysis
- The main objective of DA is to discriminate between two or more groups in term of the discriminating variables. It was performed on the data set based on three different modes, i.e. Standard mode, forward stepwise and backward stepwise modes to construct the best discriminant functions (DFs) to confirm the three clusters determined by means of CA and to evaluate spatial variation in portable water quality in Terengganu, Malaysia. In forward stepwise mode, variables are included step-by-step beginning with the more significant until no changes are obtained, whereas, in backward stepwise mode, variables are removed step-by-step beginning with less significant until significant changes are obtained. The membership of a well ina cluster1, 2 and 3 was the dependent variables whereas all the measured parameters constituted the independent variables.
2.3.3. Principal Component Analysis
- PCA analysis was used as a method of factor extraction, for this study it requires a preceding estimate of the amount of variation in each groundwater quality parameter explained by the factors. Eigenvalues are the amount of variance explained by each factor; each parameter had a variance of 1 with a total variance of 24 for the entire data set. Factor with eigenvalue >1 explained more total variation in the data than individual groundwater quality parameters, and factor with eigenvalue <1 explain less total variation than individual variable, Therefore only factor with eigenvalue >1 were retained for the interpretation, retained factors were subjected to varimax rotation (Kaiser; 1960 and Vega et al; 1998).Varimax rotation is an orthogonal rotation method that minimized the number of variables that have high loading on each factor. The VF coefficient having correlation greater than 0.75 are considered as strong and indicate high proportion of its variance explained by the factor, between 0.50 and 0.75 is considered as moderate loading while 0.30-0.50 as weak significant factor loading, indicating much of that attribute’s variance remains unexplained and it is less important (Reghunath, et al 2002).
3. Results and Discussion
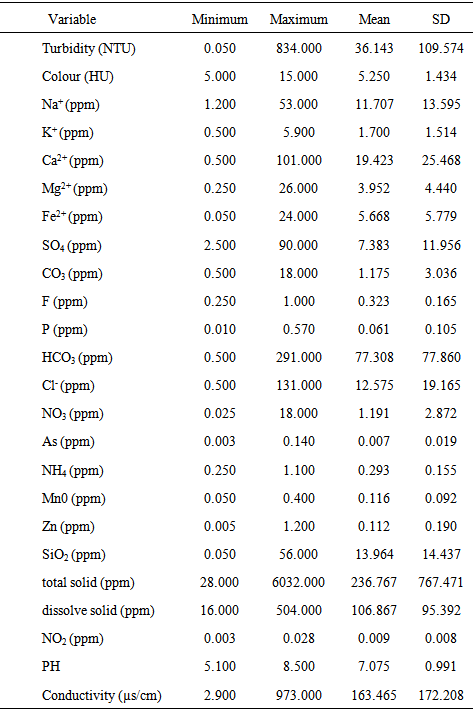
3.1. Descriptive Statistics
- Basic statistics were carried out in order to give initial information about the water quality data. The table below shows the details of descriptive statistics on the water quality variables measured in six years.
|
3.2. Cluster Analysis
- CA was carried out on the water quality data set to evaluate the spatial variability among the monitoring wells.This analysis resulted in the grouping of monitoring wells into three groups as shown in figure 2.
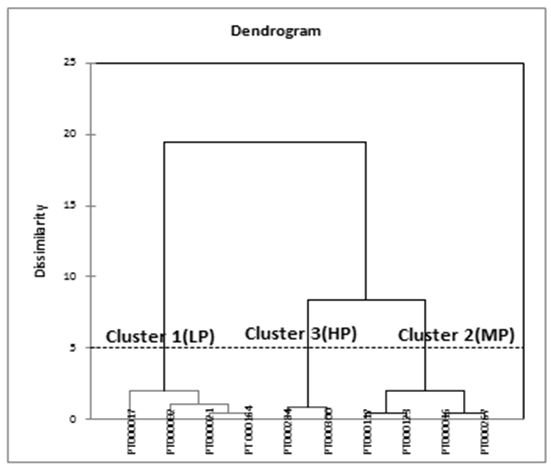 | Figure 2. A Dendogram showing the three regions of the cluster |
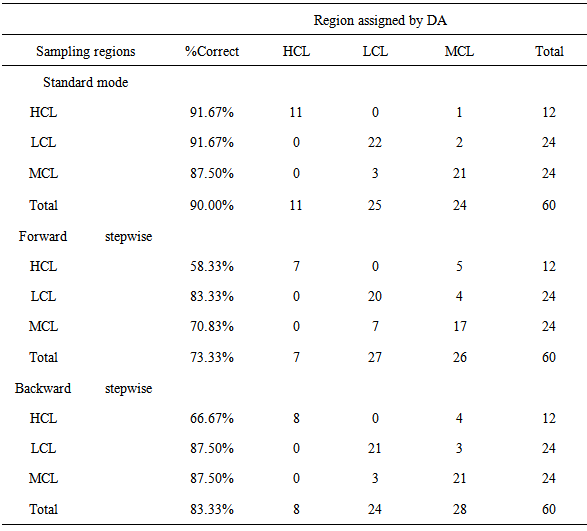
3.3. Discriminant Analysis
- In order to determine the spatial variation of groundwater quality among different wells, DA was employed and it was performed using original data of 24 parameters after classification into three major clusters obtained from the CA. Cluster groups (LP, MP and HP) were run as dependent variables, while water quality parameters were treated as independent variables. DA was carried out via standard mode, forward stepwise and backward stepwise modes, the accuracy of spatial classification using standard, forward stepwise, backward stepwise modes discriminate functions were 90.00%,73.33% and 83.33% respectively.Three parameters were found to be the most significant variable that best discriminate the clusters (Ca+, NO2_ and PH), which means that these three parameters account for the most expected spatial variation in the groundwater quality. Backward stepwise mode on the other hand resulted several parameters (Ca+, Mg2+, Fe2+, SO4_, Cl_, As, Mn, NO2 and Conductivity) to discriminate the three clusters. Forward stepwise mode DA was proven to be a useful tool in recognising the discriminant parameters in spatial variation of portable water quality; this is because in forward stepwise mode, variables are included step by step beginning with the more significant variables until no changes are obtained. The spatial DA suggest that calcium, nitrite, and PH were the most significant parameters for discriminating among the cluster yielded by CA, accounted for most of the expected spatial variation in portable water quality. Thus, DA is a method that can determine the classification into predetermined group.
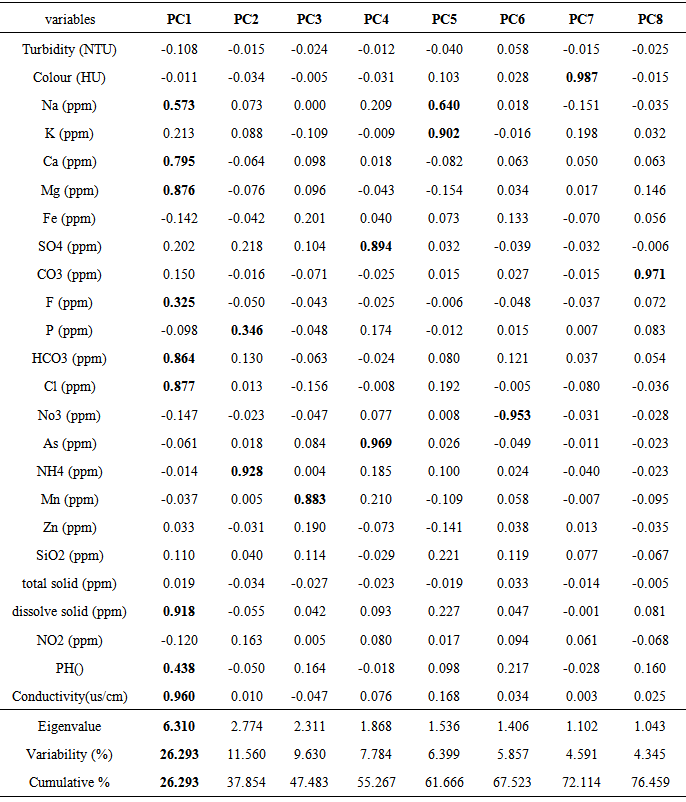
3.4. Principal Component Analysis
- PCA is performed on the normalized data set (24 parameters) to identify the major variables affecting groundwater quality. Factor with eigenvalue of 1.0 or greater are considered significant and factor with highest Eigenvalues are the most significant (Kim and Mueller, 1987) and are retained in order to understand the underlying data structure (Jackson, 1991) which has expressed that the selected PCs are able to carry more information than a single original variables.Eight major PCs were extracted which accounted 76.45% variance of the original data structure. The result of the PCs is given in the table 3.
|
|
4. Conclusions
- The study has examined water quality of groundwater in Terengganu, Malaysia. The groundwater is classified as HP, MP, and LP which was analysed using multivariate statistical techniques to determine the spatial variability of groundwater and to identify major variables affecting the water quality of groundwater.CA resulted in three main cluster of sampling site with different characteristics. Continuously, DA determined only three parameters i.e. Ca+, NO2_ and PH affording 73.33% correct assignation to discriminate between the clusters using forward stepwise mode from the original 24 parameters. Therefore, forward stepwise mode was proven to be useful in recognising the discriminate parameters in spatial variation of portable water quality as it begins with more significant variables than backward stepwise mode.PCA was used to examine the root of each water quality parameter due to nature and anthropogenic activities based on three cluster regions. Eight varimax factors (VFs) accounted for 76.45% of the total variance in the data set were found. The largest source of variation (26.29%) appears to be from water quality parameters associated natural process (dissolution of rocks), point source pollution (industrial and municipal waste water) and non-point source pollution (mostly from agricultural activities). It is noteworthy that PCA confirm exactly the result of CA and determine the pollution source.Therefore, the result of this study clearly demonstrates the usefulness of multivariate statistical analysis in geochemistry. Additionally this result may be used to reduce the number of samples analysed both in space and time without much loss of information. This will assist the decision makers to identify priorities to improve water quality that has deteriorated due to pollution from various anthropogenic activities.
ACKNOWLEDGEMENTS
- Authors are thankful to the Department of Mineral and Geoscience Terengganu for providing the hydrochemical data of groundwater. They are also thankful to the post graduate school, Universiti Sultan ZainalAbidin for supplying vehicle for site visit and data collection.