-
Paper Information
- Next Paper
- Previous Paper
- Paper Submission
-
Journal Information
- About This Journal
- Editorial Board
- Current Issue
- Archive
- Author Guidelines
- Contact Us
Science and Technology
p-ISSN: 2163-2669 e-ISSN: 2163-2677
2013; 3(4): 127-135
doi:10.5923/j.scit.20130304.06
Construction and Interpretation of Structural Map Using Seismic Reflection Times in Location of Prospective Hydrocarbon Trap
 Abstract
 Reference
 Full-Text PDF
 Full-text HTML
Osuoji O. U., Alile O. M., Airen J. O., Ikonmwen M. O., Isichei B.
Department of Physics, University of Benin, Benin City, Nigeria
Correspondence to: Alile O. M., Department of Physics, University of Benin, Benin City, Nigeria.
| Email: |  |
Copyright © 2012 Scientific & Academic Publishing. All Rights Reserved.
Geophysicalinvestigation of the subsurface structure at Mapi, Niger Delta area was carried out by the construction and interpretation of structural maps using Seismic reflection times. Surfer 8.0 software was used for the structural interpretation to prepare the contour map from seismic reflection times, with a view to identify surface location of prospective geologic traps containing hydrocarbon. The acquired seismic reflection time data from Mapi field was computed into the surfer 8 software and the structural map was generated, showing all the contours. The map showed that the geological formation mapped is upfolded, downfolded, dipped gently and tipped steeply in different areas. This indicates that the topography of the sedimentary bed is not of a particular type. Two anticlines were seen in two areas of the map (high contour closed) labeled A and B in red. These anticline structures are prospective traps to be test drilled. The study showed that anticline B is more prospective than anticline A because B is larger in size and deeper than A. The surface location of tops of the anticline A and B are indicated by red dots, the position coordinates are respectively A (424272, 205337) and B (427257, 203995). Also the study revealed a steeply dipping potion of the sedimentary bed shown by closely spaced group of contours decreasing toward the northern part of the map, this is also a target. This steeply dipping feature suggests an indication of position of tilted and faulted part of the formation. To minimize drilling risk, exploratory well could be located on anticline B first, to test the predicted stratigraphy of oil and gas accumulation.
Keywords: Structural Maps, Surfer 8.0 Software, Anticlines, Sedimentary Bed, Mapi Field
Cite this paper: Osuoji O. U., Alile O. M., Airen J. O., Ikonmwen M. O., Isichei B., Construction and Interpretation of Structural Map Using Seismic Reflection Times in Location of Prospective Hydrocarbon Trap, Science and Technology, Vol. 3 No. 4, 2013, pp. 127-135. doi: 10.5923/j.scit.20130304.06.
Article Outline
1. Introduction
- Seismic interpretation is the scientific analysis of seismic data, which lead to appropriate inference of the geology structures at depths within the earth structures. The interpretation process in this work is divided into three interrelated categories: Structural, Stratigraphic and lithologic analysis[1].The structural seismic interpretation is directed towards the development of structural maps of the subsurface from the observed 3-dimensional arrival times of the seismic waves. On the other hand, the seismic sequence stratigraphic interpretation relates the processed reflection patterns to a model of cyclic episode of depositions which are applied to accurately provide lithologic interpretation in relation to fluid pores, porosity, density, and flow directions.In order to effectively interpret the 3D seismic data, some essential procedures need to be followed such as base map studies, study of the initial processed data, fault mapping, heave calculation, depth contour from which the reservoir and fluid contact can be identified from a reliable geologic session[1].[2], carried out an integrated structural, seismic facies and stratigraphic study conducted in the Fabi field, onshore western Niger Delta, and targeted at improving the present understanding of the structural development, sequence stratigraphic history, paleo-depositionalenvironments and hydrocarbon reservoir potential of the field. 3-D seismic section, check shot data, five wireline logs and core data were analyzed and utilized in the study to ensure the construction and interpretation of structural map where the use of seismic reflection times was engaged in the location of prospective hydrocarbon trap.
1.1. Location of Study Area
- The study area is situated within the Niger Delta Basin, which is located in continental margin of Gulf of Guinea in equatorial West Africa , between latitude 3° N and 6° N and longitude 5° E and 8° E .Geographically, Niger Delta is located at some part of Western Nigeria and Eastern Nigeria. It is a fan-shaped piece of land, which covers part of Port-Harcourt province of River State in the Eastern Nigeria and Southern of the Delta province in the Western Nigeria. These are interconnecting channels, which open the area to the Atlantic by several mouths. These discharge large tones of water and sediments into the sea.
1.2. Geology of Study Area
- The Niger Delta, where oil and gas are predominantly trapped in sandstones and unconsolidated sands in the Agbada formation, ranked among the world’s major hydrocarbon provinces[3]. The study area falls within the Niger Delta of Nigeria. Niger delta is made up of quaternary rocks. The oldest sediments in the delta areas of Nigeria are of Albion age. The main rocks are shale, sandstone and limestone. These rocks are overlain conformably by cenomanian and younger upper cretaceous sediments. These deposits are believed to have been laid down during a predominantly marine depositional cycle in three stages. The first stage consists of a phase of folding, faulting and uplift occurring in santonian time as observed mainly in the areas of Abakaliki Anticlinorium.The second stage of deposition took place during the companion to Maestrichtian, when the formation of the proto Niger Delta took place. The second depositional cycle ended with major Paleocene marine transgression which terminated the advance of proto delta, thus separating it stratigraphically from the modern Delta. The modern Niger Delta was formed during the third cycle of deposition. It began in the Eocene and continues into present time.The Niger front is generally composed of shale and clays. In the Niger Delta there is high pressure shale that has led to the diapiric structure. Shale generally does not compact when loading neither do they compact following the loading of the Delta. This high pressure shale have been contracted to make diapiric flowage to compensate for the pressure. The enormous mass of the Akata formation underlying the fluviatile deposit is under compacted and over pressured. Loading of this clay or shale substratum by the overburden has created an instability which is accommodated by diapiric flowage,[4]. Subsurface Analysis of Fluvial Sandstone Bodies using well logs and 3D seismic dataset has been done[5]. The fluvial sandstone reservoirs of interest within the study area of these formations were examined by using 3D seismic and well log data. Interpreted 3-D seismic reflection data (seismic section) and well logs to study the structural configuration of “Sam’s Field” onshore Niger Delta has been carried out[6]. Favorable trapping systems that could be diagnostic of possible hydrocarbon accumulation were located in the field.The proliferation of 3-D Seismic technology is one of the most exciting developments in the earth sciences over the past century. According to[7], 3-D reflection data provide interpreters with the ability to map structures and stratigraphic features in 3-D detail to a resolution of a few tens of meters over thousands of square kilometers. It is a geological “Hubble”, whose resolving power has already yielded some fascinating (and surprising) insights and will continue to provide a major stimulus for research into geological processes and products for many decades to come. [8], outlined that the use of 3-D seismic interpretation and visualization in today’s industry, has become pervasive in exploration and development. All modern 3-D interpretation systems and many well path planning systems use 3-D visualization as the base display for the interaction required to conduct the work at hand.
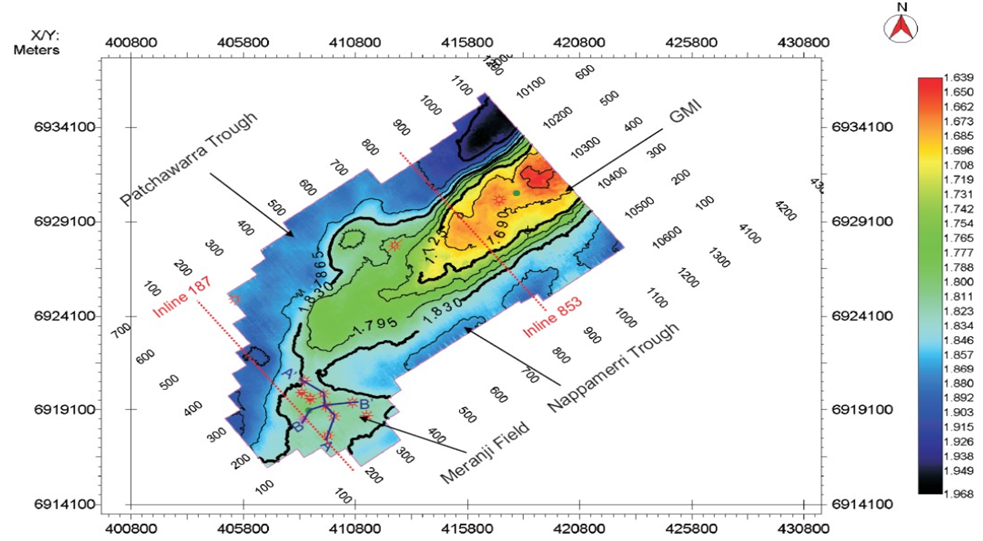 | Figure 1. Time-structure map showing the major structural elements of the study area |
2. Methodology
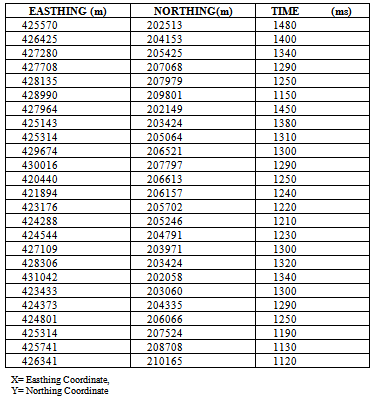
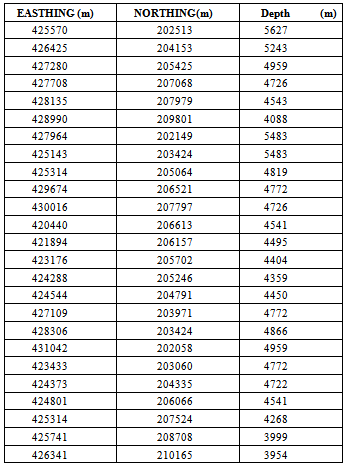
- With the Data acquired, showing the Seismic reflection times was converted from a Time Data to a Depth Data using Time to Depth conversion chat. The corresponding depths computed on the Surfer 8.0 software and the contiur map produced. Seismic map present the shape and form of geological formation top or bottom. It makes visible the area where geologic traps might be located and the high area of the traps, where and gas might be accumulated. Structural interpretation is done by constructing contour map of the horizons of interest.Arrival times or depths at the shot points are the data used for constructing contour map. The techniques for obtaining data for seismic contouring is by marking horizon of interest on selected seismic sections with color pencil at each shot point or convenient point on the horizon (the point should be directly below the shot number). Time the reflection by reading the timing lines. Conversion of the reflection time to depth was carried out. The reflections time or depths by the x-y coordinate of the shot points on the base map (location map) was tabulated. Engaging surfer 8.0 in the computer contouring, the x, y, z data are entered into the program for automatic contouring.
2.1. Contour Map Interpretation
2.1.1. Interpretation by Inspection
- The techniques used to determine the shape of the subsurface – configuration by inspection of a constructed contour map is:1. High contour closed, going completely round some area on a map indicate up-folded subsurface. The top of the feature is seen by a ring contour with no other contour inside it. Oil and gas may be collected in the high area, and a well may be located in the high area enclosed.2. Two or more separated sets closed contours on map shows alternate high and low area (up-fold and down-fold subsurface).Oil and gas may be collected in the high area.3. Group of contours decreasing or increasing toward certain direction shows dipping bed: closed spacing of the contours indicate steep slope which show prospective part of the formation. Oil and gas may be collected in the up-dip.
2.1.2. Interpretation by Section Drawing
- Section shows a visual form of the subsurface topography along a horizontal profile drawn on map. The following steps are used in drawing section from contour map manually: 1. Draw a section line (that is a straight line joining points between which the section is to be drawn.2. Choose a vertical scale. The scale examines the contours along the section line for the lowest and highest contours and draw up the numbered scale on plain paper or square paper equal to the length of the line drawn.3. Lay the straight edge of piece of paper on the section line and mark all points at which it is crossed by contour lines, writing down the depth or time of each. Where the same contour crossed two or more times, it shows rise and fall respectively.4. Transfer the paper to the bottom of the scale of depths or times and at each point draw a vertical line to the corresponding depth or time scale. 5. Join up the point with smooth line.The high part of the subsurface as indicated by the section drawn may be prospective for oil and gas.
3. Data Presentation
3.1. Location Map Description
- The location map show in plan area where seismic data was acquired. A total of 25 shot points, shown in dots were located on the base map.
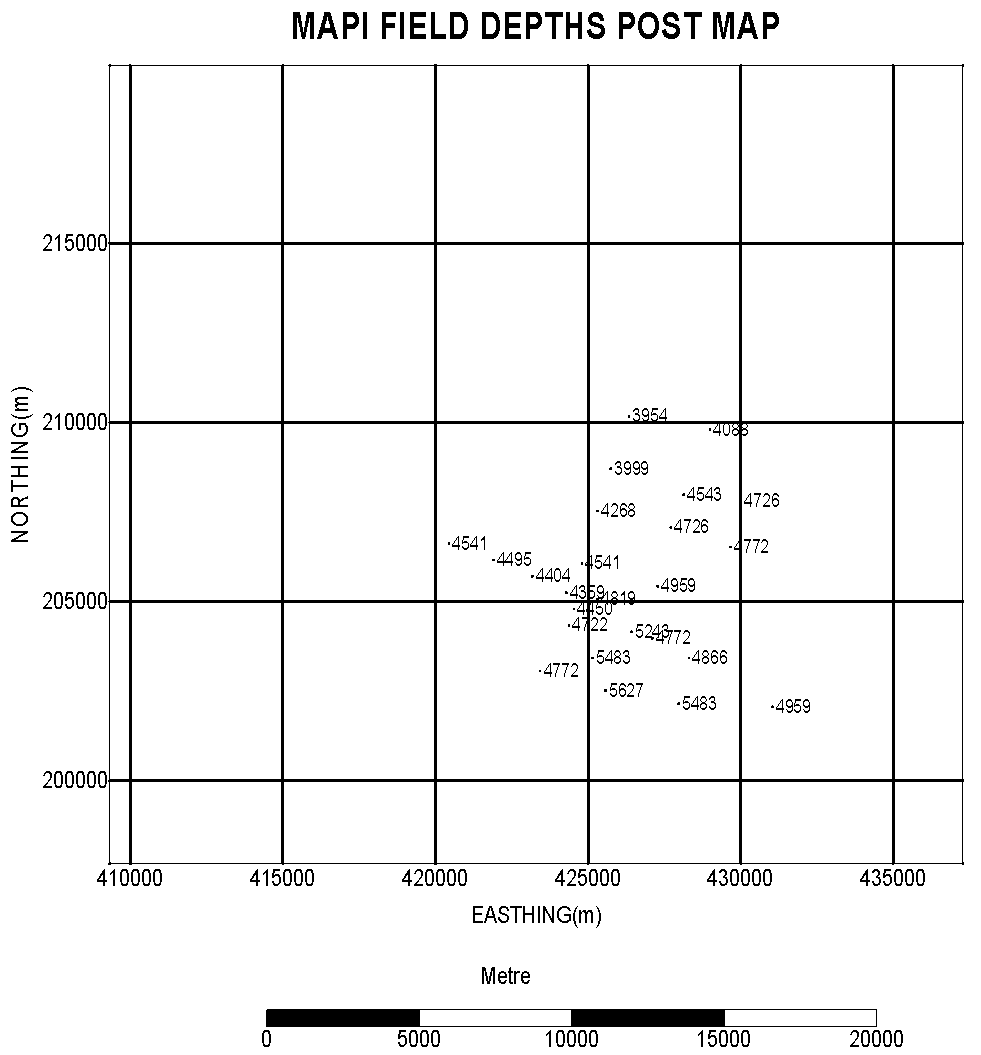
3.2. Seismic Time Post Map
- The seismic time data were posted in the base map using Surfer 8.0 program running on a PC.
|
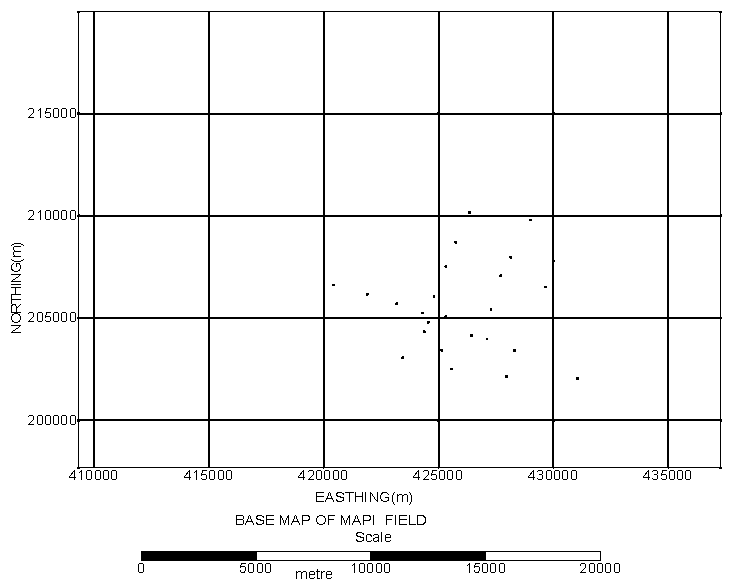 | Figure 2. Base Map of Mapi Field |
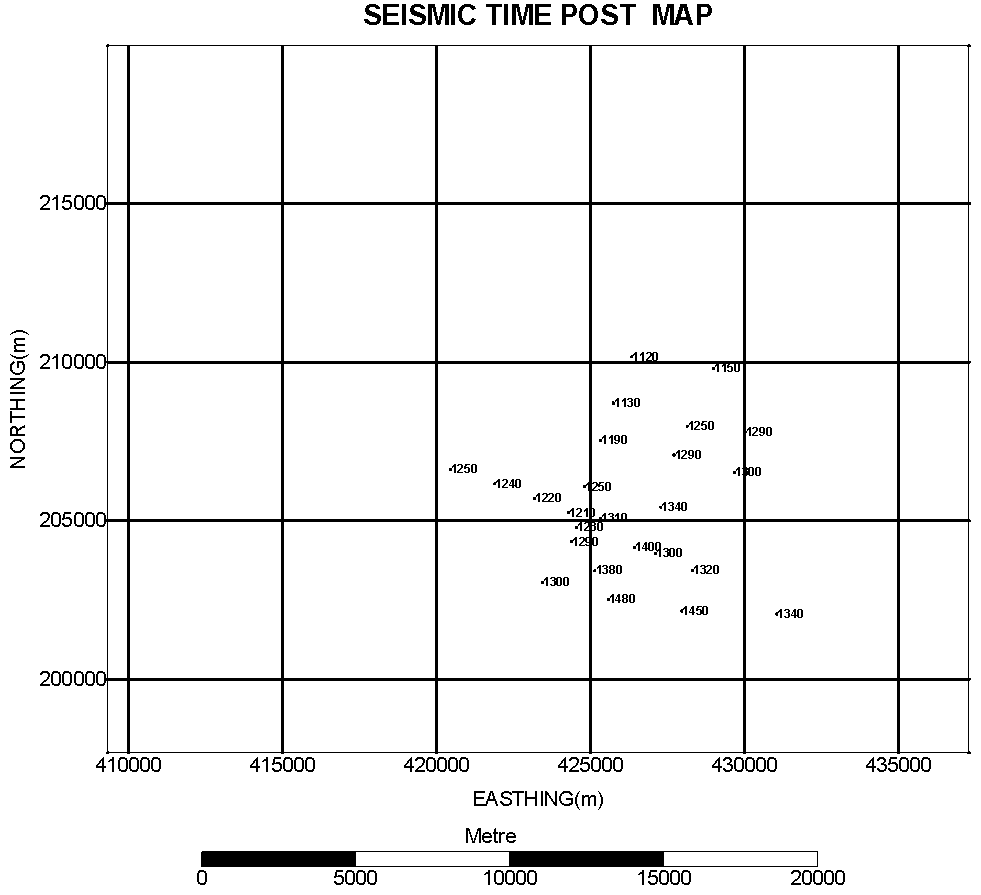 | Figure 3. Seismic Time Post Map |
3.3. Seismic Time to Depth Conversion
4. Results
4.1. Structural Map Construction and Interpretation
- Depth data in fig 4 were input into surfer 8.0 program running on a PC to produce contour map shown in fig 5.
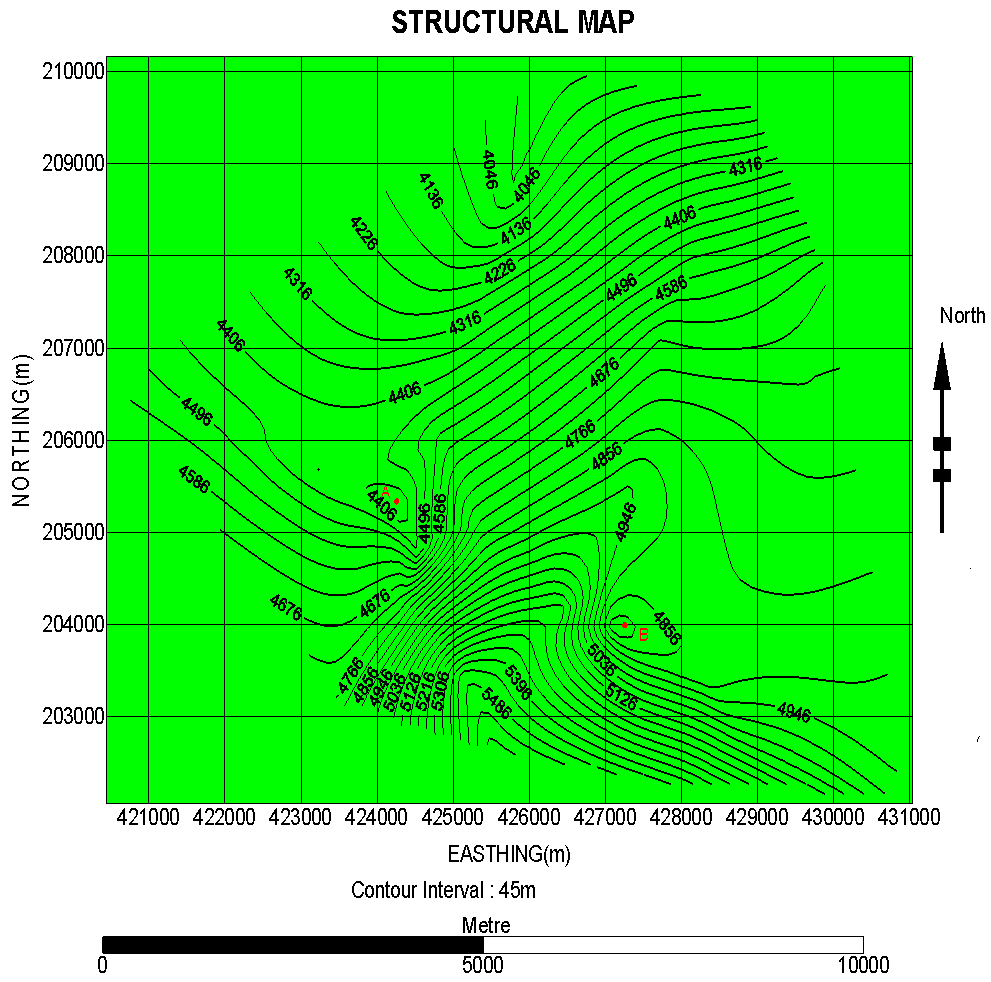 | Figure 5. Structural Contour Map |
5. Conclusions
- The result of the structural map construction and interpretation of seismic times recorded at Mapi Field of Niger Delta area of Nigeria reveals; the presence of anticlines and dipping parts of the sedimentary bed mapped. Two prospective anticlines designated as anticline A and B could be test drilled for hydrocarbon accumulation. The position coordinates of the proposed exploratory drilling locations were respectively A (424272, 205337) and B (427257, 203995).Dipping parts of the bed probably indicate positions of tilted and faulted part of the formation, tilted lithofacies or unconformity surface. These portions are not seen to be dipping enough for oil and gas accumulation. However, further study in the area is encouraged.
References
| [1] | Dobrin M.B. (1960): “Introduction to Geophysical prospecting”. Norwich, Great Britain. |
| [2] | Olowoyo O. Kehinde, (2010), Structural and Seismic Facies Interpretation of Fabi Field Onshore Niger Delta, Nigeria. Dissertation.com, Boca Raton Florida, USA. pp. 2-3. |
| [3] | Aizebeokhai, A.P and Olayinka, I., (2011), Structural and Stratigraphic Mapping of Emi Field Offshore Niger Delta. Journal of Geology and Mining Research vol. 3(2), pp. 25-38. |
| [4] | Asokhia, M.B (1995): “Engineering Geology,”Samtos Services, Ilupeju, Lagos. |
| [5] | Alqahtani, F. A., Johnson, H.D., Jackson, C. A-L., Som, M.R., Ghosh, D. P., and Sulaiman, W. K., (2009): , Fluvial Reservoir Analogues in the Malay Basin: Analysis of Shallow 3D Seismic Data of Pleistocene Rivers on the Sunda Shelf, Southeast Asia. Sediment Body Analogue and Heterogeneity Conference, London, UK. pp 22-23. |
| [6] | Olotu O. Samson and Olowookere M.T, (2009), Structural Interpretation of Seismic Reflection Data from Sam’s Field Onshore Niger Delta. Department of Applied Geophysics, Federal University of Technology Akure.http://hdl.handle.net/123456789/2352 |
| [7] | Cartwright Joe and Huuse Mads, (2005), 3D Seismic Technology: the geological “Hubble”. 3Dlab, School of Earth, Ocean and Planetary Sciences, Cardiff University, Cardiff, Wales, UK.vol 17, pp.1-20. |
| [8] | Dorn A. Geoffrey, (2011), Advances in True Volume Interpretation of Structure and Stratigraphy in 3-D Volumes. General Partner, Terra Spark Geosciences LLC. |
| [9] | Osemeikhian J.E.A and Asokhia M.B, (1995), Applied Geophysic,. Samtos Services Ltd Ilupeju, Lagos. pp. 3-17, 30 |
| [10] | Bacon M., Simm .R and Redshaw .T., (2009), 3-D interpretation. Cambridge University Press, Pitt Building, Trumpington Street, Cambridge, United Kingdom. pp. 1-11. |
| [11] | Telford W. M, Geldart L.P, Sheriff R.E, (1990), Applied Geophysics, Second Edition, Cambridge University Press. pp.136-145. |