Olaniyan I. O.1, Okedayo T. G.1, Olorunaiye E. S.2
1Faculty of Science, Ondo State University of Science and Technology, Okitipupa, Nigeria
2Department of Agricultural Engineering, Kaduna Polytechnic, Nigeria
Correspondence to: Olaniyan I. O., Faculty of Science, Ondo State University of Science and Technology, Okitipupa, Nigeria.
| Email: |  |
Copyright © 2012 Scientific & Academic Publishing. All Rights Reserved.
Abstract
A geophysical investigation of Nariya Village in Kaduna, is presented. Vertical electrical sounding (VES) method was employed in investigating the subsurface, and the result was used to infer the hydrogeologic conditions of the area as well as its potential for irrigated farming. From field investigation and interpretation of data, VES points 1, 6 and 3 in order of preference are suggested as best locations for productive wells. Geophysical results indicate considerable quantity of groundwater which when exploited will sustain irrigation farming. The geoelectric sections obtained for each VES point from interpretation was used to prepare the geoelectric cross-section or profile, which shows probable lateral relationship and continuity in rock units of the study area. The trend surface equation of the water table was developed, and it gave a 0.975 correlation coefficient with the actual water table surface obtained from interpretation of data.
Keywords:
Hydrogeophysics, Groundwater, Irrigation, Trend Analysis, Piezometric Surface
Cite this paper: Olaniyan I. O., Okedayo T. G., Olorunaiye E. S., Geophysical Appraisal and Trend Surface Analysis of Groundwater Potential for Irrigation at Nariya Area, Kaduna, Nigeria, Science and Technology, Vol. 3 No. 3, 2013, pp. 93-98. doi: 10.5923/j.scit.20130303.04.
1. Introduction
The area covered by this study is bounded by latitudes 10o 29’ N and 10o 30’ N and longitudes 7° 20’ E and 7o 22’ E. The 242-hectare land area studied is located at Nariya Village in Tudun Wada area of Kaduna where the Kaduna Polytechnic Demonstration Farm is situated. The area is bounded to the north by the Nariya Village settlement, and to the south by the River Kaduna that runs almost parallel to the farm.Dry season farming is all about irrigation. Irrigation activities on the farm is a continuous practice which usually climax especially in the dry season period between November and March. The source of irrigation water, of course, is River Kaduna. Omolokun & Esu[1], while studying the effect of liquid waste discharges from some factories along the course of River Kaduna, revealed that there is an increasing concentration of chemical pollutants in the river flow which attains toxic levels in the dry season when the water of the river is most needed for irrigation. There are over 250 points where wastewater is discharged into the river upstream. In a similar study, Fyada[2] also asserted that the water of river Kaduna is injurious to man, animals and irrigated crops, and may not be used as irrigation water unless it undergoes some purification especially during the dry season.Although the farm was hitherto maintained as a demonstration farm for training of students and as a model for farmers in the locality, the growing need to commercialize the farm, sustain irrigation practice and cultivate healthy crops translate to a corresponding need for alternative, unpolluted source of irrigation water. The development of surface water on a large scale has suffered tremendous set back in Africa. Wright[3] observed that in most parts of Africa, economic and environmental factors are constantly combining against the use of dams, while small surface storage schemes are very vulnerable to drought and pollution, and these need be compared carefully with the groundwater option for cost effectiveness. Groundwater has several advantages over surface water in that it is not exposed to contaminants that are dumped into the latter. It is filtered naturally and bacteria do not usually thrive deep down in the groundwater environment. The temperature is constant and the chemistry is less subject to changes than that of surface water.This study, therefore, attempts to investigate groundwater occurrence in the farm area with a view to ascertaining its potential for possible utilization as an alternative source of irrigation water.
2. Geomorphology, Geology and Hydrogeology
The climate of Kaduna is the tropical type, which has distinctive wet and dry seasons. Annual rainfall, ranging between 1000 to 1500mm, occurs between early April and early October. Maximum temperatures, on the other hand, vary between 38℃ in March/April and 24℃ in other months, but becomes far less in peak rainy periods (July/August) and in harmattan months (November - February). The Guinea Savannah type of vegetation in the area consists of broad-leaved savannah woodland which may attain heights of about 10 to 15 metres when fully developed, and may be dense enough to suppress the growth of grasses[4]. The relief of the area is characterized by an undulating plain, gentle slopes, and consists of peneplains with eroded flat tops, often capped by layers of indurated laterites. The southern boundary of the farm adjacent to the river exhibits swampy conditions during the rainy season, while the upper parts drain freely. The drainage pattern is dendritic while stream flow fluctuates seasonally.The typical rock types underlying the entire land area of Kaduna State consist of the Precambrian migmatite-gneiss complex, metasediments/ metavolcanics (mostly schists, quartzites, amphibolites and Banded Iron formations), Pan-African granitoids and calc-alkaline granites, and volcanics of Jurassic age towards the south-eastern border of the State[5]. Most of the areas underlain by the Basement Complex rocks in northern Nigeria consist of a thin discontinuous mantle of weathered rock overlying them. The average thickness of the mantle is about 15m, although depths of about 60m may be encountered. The unweathered bedrock is characterized by rapid grain-size variations from micro to pegmatitic regions but normal sizes are dominant[6].The water-bearing units (aquifers) in Basement rocks occur within the weathered residual overburden (the regolith) and the fractured bedrock. Viable aquifers wholly within the fractured bedrock are of rare occurrence because of the typically low storativitv of fracture systems, generally less than 1%[7, 8]. For a Basement aquifer to produce effectively, the development of the bedrock component requires interactions with storage available in overlying or adjacent saturated regolith, or other suitable formations such as alluvium.However, areas with a thick regolith should be targeted for groundwater exploitation within the crystalline Basement complex terrains. It has become a common groundwater exploration strategy in crystalline Basement terrains to site water supply boreholes where the regolith is thickest, with the expectation that the saturated thickness is greatest under such circumstances and the frequency of bedrock fissures also greatest[9, 10].In a survey of 69 boreholes drilled in the Basement complex rocks of Kaduna State, Adefila[11] reported that 16 were unproductive, representing 30% failures, while the so-called successes were not encouraging due to low yield. This high rate of unproductive and so, unpromising boreholes have been attributed to the fact that the boreholes were drilled at locations pre-determined by their owners, instead of on the basis of a good hydrogeological /geophysical investigation of the areas concerned. Most dug wells in the rural areas were located by ‘common sense’ or trial and error rather than by scientific methods due to restricted availability of equipment and operators. This situation therefore makes this type of investigation a prima facie for precise location of productive boreholes prior to drilling.
3. Geophysical Investigation
Many geophysical methods find application in locating and defining subsurface water resources. Generally, the most widely used of all applicable geophysical methods in hydrogeology are the electrical techniques as they are the most reliable indirect tool in groundwater exploration. In order to determine the thickness of layers, nature of overburden, depth to Basement rock and depth to water table, electrical resistivity survey was carried out in the study area using ABEM Terrameter model SAS 300C with its appurtenances. Vertical electrical sounding (VES) was carried out at six stations numbered VES 1 to 6 using the Schlumberger array[12]. The maximum array length in the survey is 200 m.
4. Interpretation and Discussion of Results
The VES data obtained are presented as sounding curve plots of apparent resistivity versus electrode spacing on a bi-log scale (Figure 1). The data were interpreted using the automatic computer processing and interpretation programme developed by Zohdy[12]. Using the interpreted true resistivity values obtained, the lithology was delineated for the thicknesses of layers, probable nature of rocks in succession, depth to Basement and inferred water table position. 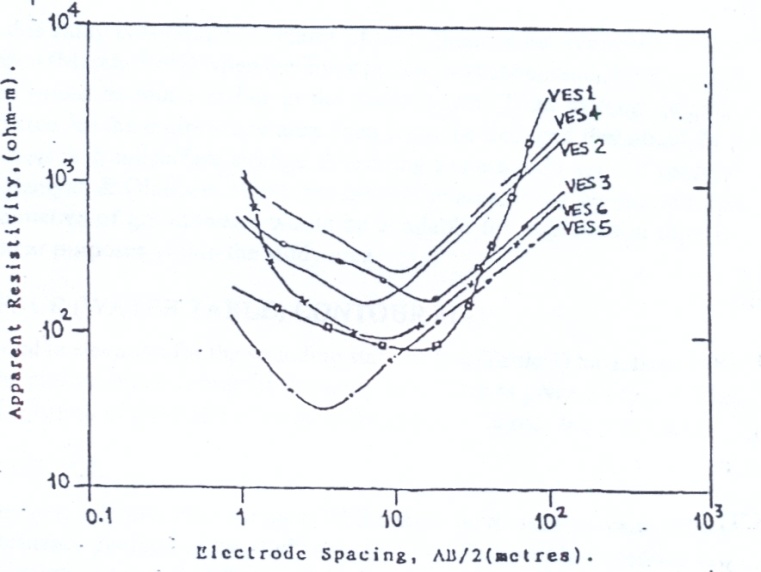 | Figure 1. Vertical Electrical Sounding Curves of the Area |
Four-layer geoelectric (lithologic) succession was identified across the entire study area, but with varying thicknesses. They consist of an uppermost lateritic layer with resistivity range of 151Ωm to 4,800Ωm and thicknesses ranging between 0.3m and 2.6 m. The second layer is a low resistivity layer which was interpreted as clay above water table. This layer is found to be thickest at VES points 1 and 5 with thicknesses of 4.7m and 3.5m respectively. From field experience, it is usually a problem horizon to borehole drillers especially when it is saturated. The next layer is interpreted to be either a sandy alluvium or sandy clay layer. This layer marks the beginning of the aquiferous unit of the substrata in the area. Its resistivity value ranges between 137Ωm and 510Ωm, and its thickness ranges from 2m to 15m.The fourth layer is identified to be the saprock, otherwise known as the weathered or fractured bedrock. From the interpreted true resistivity values, this layer will consist of rock fragments that grade from larger sizes at the bottom to smaller and finer sizes upwards. This layer is the main target when screening a drilled well because of its potential for good permeability and storativity. The lowermost layer, of course, is the Basement rock. Whenever the Basement rock is well fractured it provides additional storage of groundwater as evidenced in VES 1, 3 and 5. However, it is rare to obtain viable aquifers with good storativity within the fractured rock alone. Such aquifers require interaction with alluvium, regolith and/or saprock storage. From this study, VES 1 has the greatest regolith thickness while VES 2 has the smallest. On the basis of this and other geophysical and geological considerations, it may be appropriate to recommend that borehole for productive well could be located at VES point 1, as the best site, followed by VES point 6 and then VES point 3 in order of preference.The area covered by this study is about 242 hectares of land. Since water level was almost at its minimum in dry season (March) when the investigation was conducted, it is expected that depth to water table would be much higher in the rainy season. If an average regolith thickness of 10m is assumed for the entire study area, then it can be deduced that about 24.2 million cubic metres of water is in subsurface storage. Assuming a commonly applied value of 10% for specific yield[4] throughout the area, it can be inferred that about 2.42 million cubic metres of groundwater would be available for exploitation through wells for irrigation and other purposes within the study area. This is sufficient enough for a demonstration farm.The interpreted water table elevation[12] for the sounding stations (see Table 1) has been used to prepare the Piezometric surface contour map of the study area. This is given as Figure 2. The figure shows the inferred position of the water table at different points across the study area.The lithologic sections from interpretation for each VES station were used to construct the Geoelectric Profile of subsurface geology of the study area (Figure 3). This profile or section is a model depicting the lateral relationship and continuity in rock units across the area. It also shows the inferred thicknesses of layers at each sounding station. 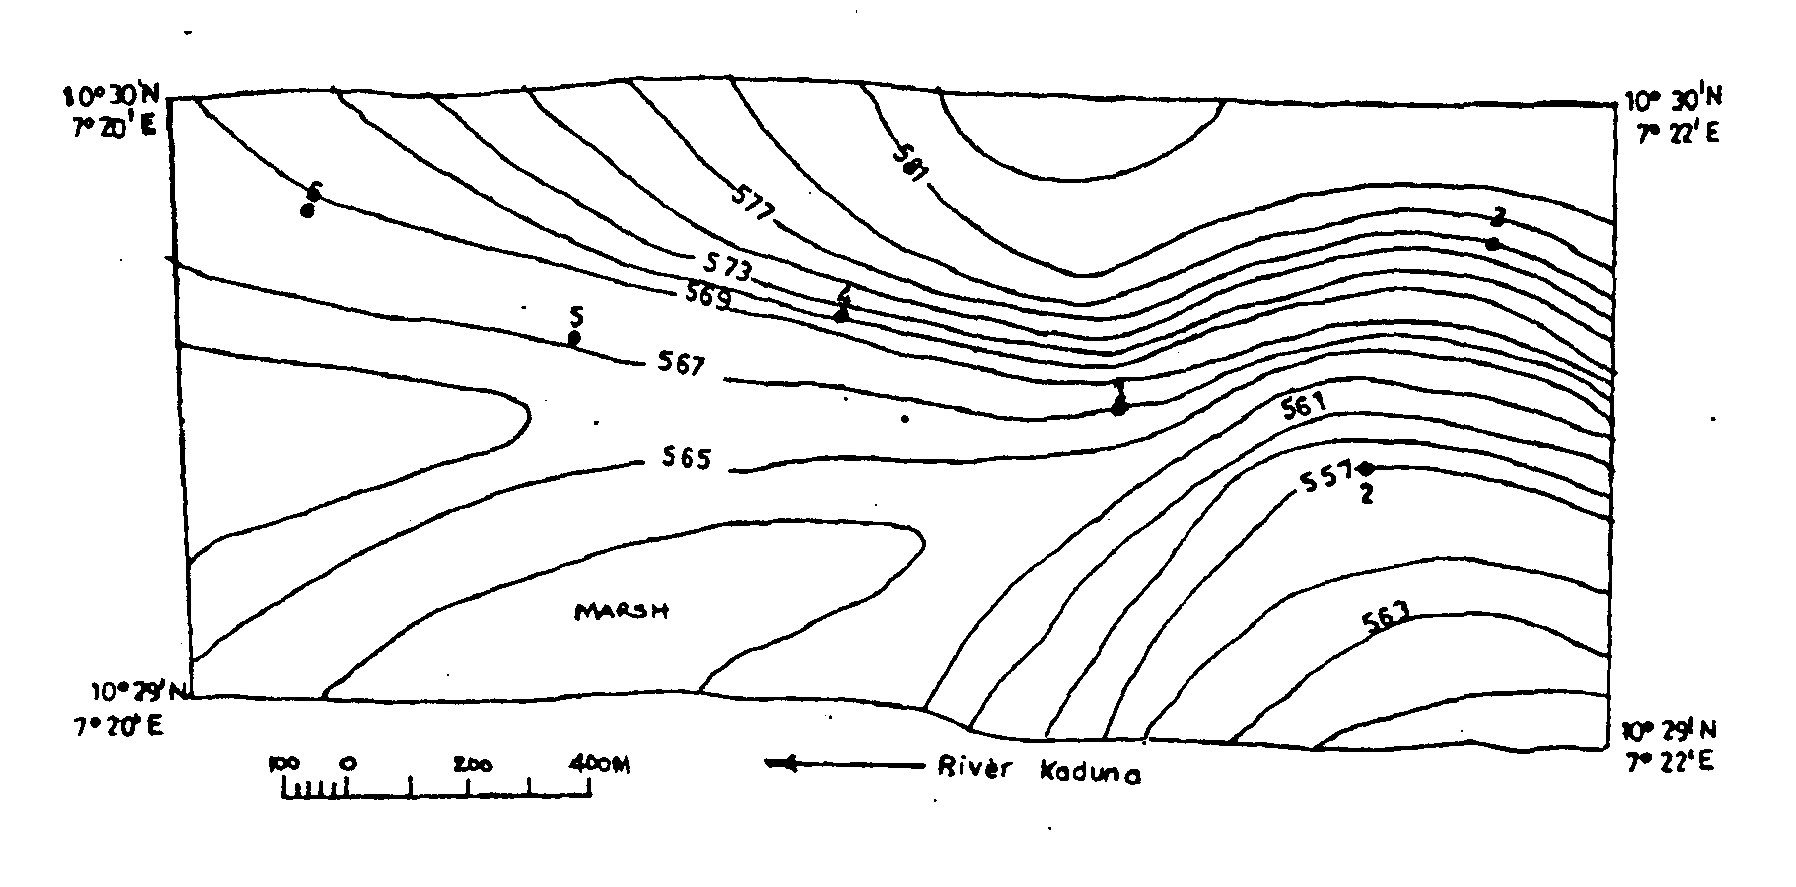 | Figure 2. Piezometric Surface Contour Map (with location of VES Points) |
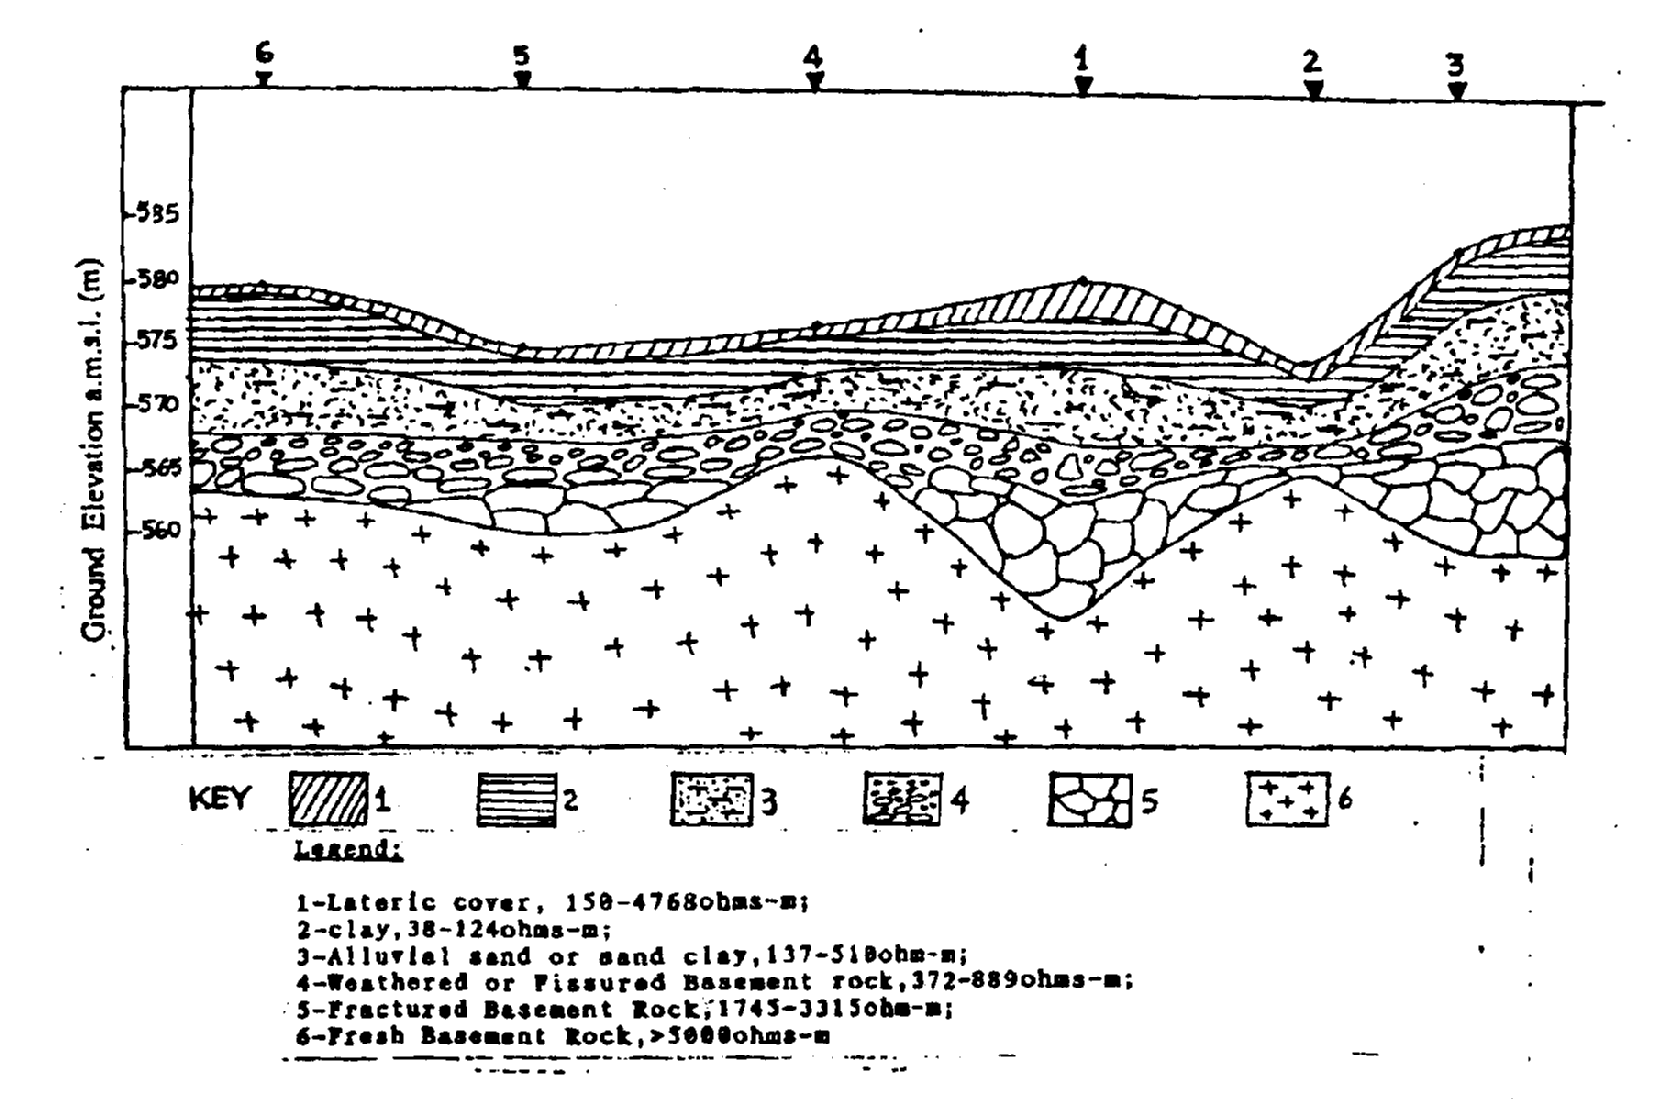 | Figure 3. Geoelectric Profile across the Vertical Electrical Sounding Stations |
5. Trend Surface Analysis of the Water Table
Trend analysis is a mathematical method used in geology to separate map data sets into two subsets, namely the regional nature and the local (or residual) fluctuations. It may be defined as a linear function of the geographic coordinates (e.g. X1 and X2) of a set observations so constructed that the squared deviations from the trend are minimized. Trend analysis is an adaptation of the multi-dimensional regression analysis applied to geologic problems[l3,14]. A linear trend surface is an equation of the form:  | (1) |
Equation (1) shows that a geologic or geophysical observation Y may be regarded as a linear function of some constant value (b0) related to the mean of the observations, plus an east - west (b1) co-ordinate component and a north-south (b2) component. In order to obtain the solution to equation (1) which contains three unknowns, three normal equations are required as follows: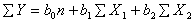 | (2) |
 | (3) |
 | (4) |
Equations 2, 3, and 4 can be transformed into the matrix form as follows: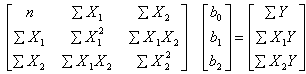 | (5) |
The solution of the matrix equation (5) will give the coefficients of the best-fitting linear trend surface with the least-square criterion. The parameters for the trend surface analysis of the water table shown in Table 1 have been used in equations 2, 3 and 4 as follows: | (6) |
 | (7) |
 | (8) |
Equations 6, 7 and 8 are expressed in the matrix form as: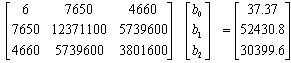 | (9) |
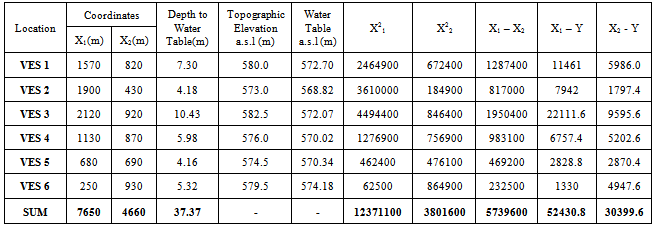
By solving matrix equation (9) using the Crammer’s rule, the values of the coefficients are obtained as:b0 = - 5.26b1 = 0.0026b2 = 0.0105Table 1. Parameters for the Trend Surface Analysis of the Water Table
 |
| |
|
Hence the equation of the regional trend surface of the water table in Nariya and environs is given by: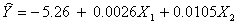 | (10) |
Where Ŷ = Depth to water table, in metresX1= East-west distance, in metresX2 = North-south distance, in metresBy using equation (10) of the trend surface of the water table, the expected or trend values of the depth to water table Ŷ were calculated for each VES station and comparison made with the actual values obtained from interpreted geophysical data, as shown in Table 1. The Coefficient of multiple regression, R, was then evaluated to verify how the values of Y and Ŷ correspond to each other from the following relationship: and
and
 Where R = Coefficient of multiple correlationSSR = Sum of squares due to regression,SST = Total sum of squares of dependent variable, Y
 = Mean of water table depths.Using the values in Table 1, the coefficient of multiple correlation was calculated to be 0.975. This high value implies that the calculated data shows that the trend surface equation is consistent with the actual depth to the water table, and the equation can therefore be used at any point in the area to obtain first-hand information on the depth to water table. This will be a good reference information of immense benefit to potential well drillers in the study area.
6. Conclusions
This study has made it possible to obtain information on the groundwater potential of Nariya Village, especially the Depth to water table, possible borehole locations and an estimate of the amount of groundwater available for exploitation have been determined. The interpreted geoelectric section which favourably compared with the geologic sections obtained from existing wells showed that in spite of the non-uniqueness problem that often beclouds rock resistivity interpretation, electrical resistivity survey is still a reliable subsurface investigation method. The trend surface equation developed gave a very good correlation with the measurement from existing dug wells. All these will provide useful information for project design, potential water well drillers, and for further hydrogeologic studies in Nariya.
References
| [1] | Omolokun, A.O. and Esu, I.E. (1981). “Pollution of River Kaduna by Liquid wastes discharge from some factories in Kaduna South” Proceedings of 2nd National Conference on water pollution. |
| [2] | Fyada, E.E. (1994). “Pollution of the downstream of River Kaduna: Threat to irrigated agriculture”. Proc. 1st Nat. Eng. Conference, Kaduna Polytechnic, 1(1):26-30. |
| [3] | Wright, EP. (1986). Water resources for humans, livestock and irrigation. In: Foster, L.J. (ed.). Agricultural development in drought-prone Africa. Overseas Dept. Inst. and Tropical Agric. Assoc. |
| [4] | Olaniyan, I.O. and Olabode, O.T. (2012). Assessment of the groundwater potential of a typical ‘fadama’ in Kaduna State, Nigeria. Researcher 4(4):10-15, Marsland Press, New York, U.S.A. www.sciencepub.net |
| [5] | Oluyide, P.O. (1995). Mineral occurrences in Kaduna State and their geological environments. Proceedings of NMGS Kaduna Chapter Workshop in collaboration with Kaduna State Govt. 15 December, pp.13-27 |
| [6] | Uma, K.O. and Kehinde, M.O. (1994). Potentials of regolith aquifers in relation to water supplies to rural communities: A case study from parts of Northern Nigeria. Journal of Mining and Geology 30(1): 97- 109. |
| [7] | Clark, L. (1985). “Groundwater abstraction from the Basement Complex areas of Africa”. Quarterly Journal of Eng. Geol. London. 18:25 -34 |
| [8] | Sen, Z. (2006). Horizontal rough fracture type curves for groundwater movement. Hydrological Sciences Journal 51(6):1125-1138 IAHS, Oxfordshire, U.K. |
| [9] | Okereke, C.S., Esu, E.O. and Edet, A.E. (1998). “Determination of potential groundwater sites using geological and geophysical techniques in the Cross River State, S.E. Nigeria”. J. of Afr. Earth Sci. 27(1):149-163. Elsevier Science Ltd., Gt. Britain. |
| [10] | Rastogi, A.K. (2007). Numerical Groundwater Hydrology. Penram International Publishing (India) Pvt.Ltd., Mumbai, pp. 624-633. |
| [11] | Adefila, S.F. (1975). “Decline in pressure head of the ‘Middle Zone’ aquifer of the Chad basin in parts of south-eastern Niger and north-east Nigeria”. Journal of Mining and Geology, 12(1 & 2):23. |
| [12] | Zohdy, A.A.R. (1989). “A new method for the automatic interpretation of Schlumberger and Wenner Sounding Curves”. Geophysics 54: 245-253. |
| [13] | Davis, J.C. (1973). Statistics and Data Analysis in Geology. John Wiley & Sons, Inc. |
| [14] | Onwuemesi, A.G. (1990). Hydrogeophysica1 and geotechnical investigations of the Ajali sandstone in Nsukka and environs with reference to groundwater resources and gully erosion problems. Water Res. J. of Nig. Assoc. of Hydrogeol. 2(1):70-76 |
 Abstract
 Reference
 Full-Text PDF
 Full-text HTML