Taina Pola, Tero Häkkinen, Jaana Hännikäinen, Jukka Vanhala
Tampere University of Technology, Department of Electronics, P.O.Box 692 FI-33101 Tampere Finland
Correspondence to: Taina Pola, Tampere University of Technology, Department of Electronics, P.O.Box 692 FI-33101 Tampere Finland.
| Email: |  |
Copyright © 2012 Scientific & Academic Publishing. All Rights Reserved.
Abstract
This paper investigates the possibility to use flexible thermal conductive materials for cooling tasks in electronics. Traditional circuit boards are stiff and therefore, they are not perfect solutions for utilization in wearable applications. We have tested 13 flexible heat sink materials for their heat conductivity and heat dissipation properties by heating them with a constant power and measuring the temperature the heating element reached. A Field Effect Transistor (FET) was utilised as a heating element and it was fed by a constant power from a laboratory power source. The FET was fastened onto the tested heat sink material with thermally conductive adhesive. Temperatures of the FET and the heat sink material were measured with a multimeter and with a thermal imaging camera. According to the results, the heat conduction depended on the amount of metal in the tested material. The materials containing a great deal of metal conducted heat well whereas conductive fabrics, in which the amount of metal is substantially less than with other tested materials, were not able to perform the effective heat transfer. The structure of the test sample as well as thermal conductivity of fastening materials also affects the results.
Keywords:
Textile, Heat Sink, Fastening, Thermal Conductivity
Cite this paper: Taina Pola, Tero Häkkinen, Jaana Hännikäinen, Jukka Vanhala, Thermal Performance Analysis of 13 Heat Sink Materials Suitable for Wearable Electronics Applications, Science and Technology, Vol. 3 No. 3, 2013, pp. 67-73. doi: 10.5923/j.scit.20130303.01.
1. Introduction
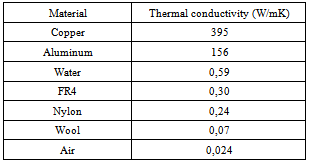
We carry different kinds of electronic devices with us embedded in pockets or integrated permanently into clothing or accessories. Due to the development of the electronics integration and miniaturization techniques it is also possible to add conductive yarns, fibres or routes as well as electronic components into the clothing so that added parts are almost unnoticeable by wearers. Textiles and clothing provide large surfaces for electronics placements and therefore clothes form a natural platform for different electronic components. In addition, textiles are light-weight, flexible, low-priced, and their manufacturing techniques are well known. Combination of textiles and electronics i.e. textile electronics can be utilised e.g. in various healthcare applications to monitor patients in real time or during sport activities to measure performance of athletes. For these kinds of applications small size and lightweight of electronics as well as unobtrusiveness are evident requirements. The most typical components to be integrated to the clothing, accessories, or environments are obviously different kinds of sensors as well as user interface components[1],[2]. The integration to the textile or clothing can be done in a thread level[3], in a fabric level (e.g. textile based buttons and keyboards[4]), or electronic components could be fastened to the surface of textiles (e.g. motion sensors[5] and biomonitoring[6]). Light Emitting Diodes (LEDs) are also generally utilised in electronics and in wearable applications to illustrate the functionality of the components or devices[7]. Recently LED technology has rapidly developed and LED’s luminous efficiency has increased. Therefore, LEDs are also widely utilized for lightning purposes e.g. indoors, outdoors, in cars, displays and torches[8]. LEDs have replaced light bulbs due to their properties of small size, durability, and energy efficiency. These properties also make their utilization in wearable electronics beneficial. At the moment LED products are one of the fastest growing areas in electric and electronics components and devices. Therefore, in the near future we expect LEDs to be integrated in the clothing and accessories for lightning purposes for several working areas, such as electricians and miners.Even tough, wearable applications have been researched for several years; there are still many challenges to overcome. Firstly, combining of soft and flexible textiles and hard and stiff electronics in unobtrusive and comfortable ways is a demanding task. Secondly, water resistance and moisture proofing as well as washing properties of electronics need to be considered. Typically clothing, accessories, and textiles can be washed whereas electronics does not endure water or washing without additional treatments. Thirdly, a significant challenge has become topical together with the utilisation of power LEDs. In general, all electronic components generate heat and in a case of power LEDs this may affect the wearing comfort of the clothing or in the worst case the component itself may be destroyed. Heat transfer also in clothing environment can happen in a three different ways, which are conduction, radiation and convection[8]. In a case of LEDs, the most of heat conducts through the base of the LED to the surrounding material and only a small amount of heat radiates directly to the environment. In traditional electronics different kinds of heat sink materials and methods can be utilised when the heat transfer away from the electronics is not efficient enough. Copper and pass throughs in circuit boards, aluminium cooling profiles, and different kinds of cooling fans are examples of these. If the temperature difference is high between the component or the material and the environment the more efficient cooling will be needed. High temperatures can e.g. raise power consumption and material or interface faults may increase[9]. To effectively conduct heat away from LEDs the heat sink material should be placed directly below the component. The conduction of heat across the interface depends on the various factors such as the geometry of the surface, the coefficient of thermal expansion, and the thermal conductivity of the interface material[9]. In this work, different kinds of thermally conductive materials, which could be potentially utilised for electronics heat sinks, were selected and their suitability for cooling tasks were tested. In addition, we paid attention to ways to enable the effective heat transfer. The requirements for heat sink materials were thinness, flexibility, and good thermal conductivity. Thin and flexible materials enable their use in garments and like garments. Therefore, these are the evident requirements for wearable applications. Traditional heat sink elements utilised in electronics are not suitable due their large size and stiffness. Thermal conductivity tells how well materials can conduct heat in W/mK. Typically, metals have good thermal conductivity properties whereas for traditional textiles thermal conductivity is quite poor. Thermal conductivities for common materials utilized in electronics and textiles are presented in Table 1. The reason for the research came up from the power LED applications. However, for cost reasons we replaced LEDs with FETs.Table 1. Thermal Conductivities of Materials.[9][10]
 |
| |
|
The paper is organized as follows. Tested materials and test methods are introduced in Section II. In Section III analysed results are presented and finally, in Section IV main conclusions are drawn.
2. Methods
Samples of different materials were tested for their heat conductivity and heat dissipation properties by heating them with constant power and measuring the temperature the heating element reached.
2.1. Tested Materials
The tested materials are divided in four different categories: planar samples, a cable, tinned copper wires, and electrically conductive fabrics.
2.1.1. Planar Samples
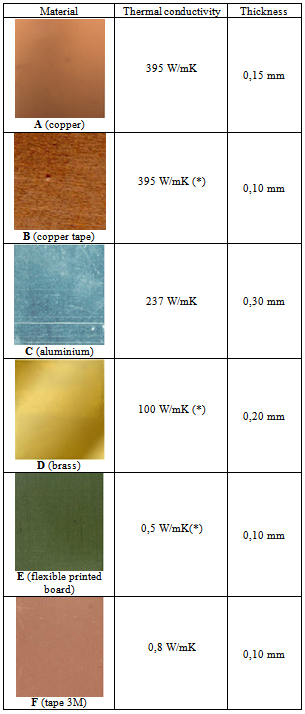
Tested planar samples, their thermal conductivities and the thickness of samples are illustrated in Table 2. Thermal conductivity between materials varies a lot as can be seen from Table 2. The thickness of samples varies between 0,10mm to 0,30mm. Silver and gold, which are also utilised in various textile electronics applications and in advanced connection technologies would also have good thermal properties, but they are expensive.
2.1.2. Cable
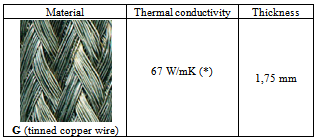
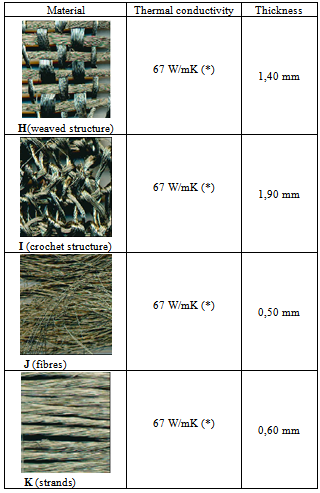
2.1.3. Tinned Copper Yarn
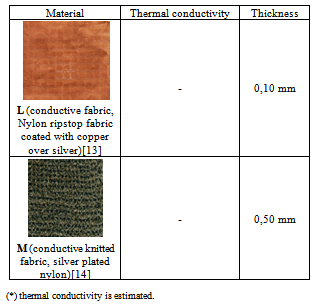
2.1.4. Electrically Conductive Fabrics
Electrically conductive fabric material samples L and M are presented in Table 5. The sample L is weaved and industrially produced (thin and planar) and the sample M is knitted utilising a conductive soft yarn. Thickness varies between 0,10 - 0,50 mm. These materials were chosen due to their thinness, fabric-likeliness, and the unlimited shape of the material. The samples included metals and they could also be utilised for ESD protectionTable 2. Planar Samples
 |
| |
|
Table 3. Cable
 |
| |
|
Table 4. Tinned Copper Yarn
 |
| |
|
Table 5. Conductive Fabrics
 |
| |
|
2.2. Test Samples Heating
Test samples were 5 cm * 7 cm in size and the utilised heating element was the FET model IRF620. The FET was attached to the test material samples in a same way in every case utilising thermally conductive oxime cure (RTV), which thermal conductivity is 1,8 W/mK and the operating temperature range is form -50°C to +230°C[15]. Contacts were ready in 20 hours. The utilised RTV was flexible also after drying. Test sample I is presented in Figure 1. 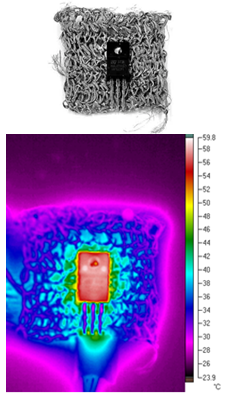 | Figure 1. Test sample (I) and thermal imaging camera picture |
The material samples were two at a time connected to an operating amplifier circuit that regulated the current through the FETs. The voltage over the FETs was set to a constant value from the laboratory power supply feeding the circuit. Therefore, constant power was driven to the FETs and dissipated as heat in them. The two outputs of the operational amplifier circuit were measured to ensure that they gave equal currents i.e. the offset voltages of the amplifiers were not causing significant difference to the heating power of the individual outputs. In all measurements the power output was the same: 0,85 W. With this power the surface temperature of the FETs rose to about 80°C when there was no heating element attached. The samples were placed horizontally on a styrofoam plate and the tests were performed in normal indoor conditions (still air, temperature around 22°C). Stabilization time was 15 minutes in every temperature measurement. Measurement setup is illustrated in Figure 2.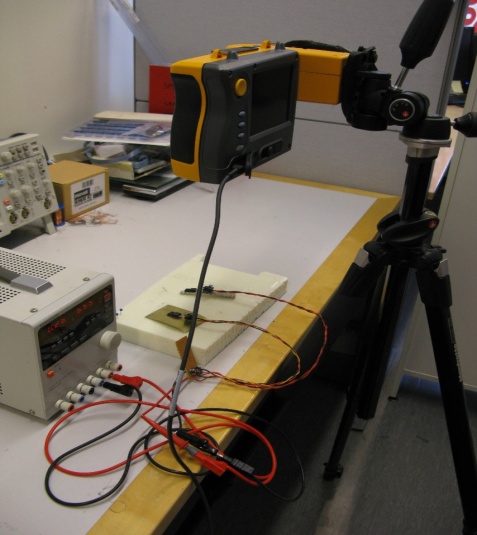 | Figure 2. Measurement with thermal imaging camera |
Temperature measurements were taken with a PT100 thermocouple attached to a multimeter and with a thermal imaging camera. Temperature readings were taken with the multimeter by touching the tip of a PT100 thermocouple wire on top of the FET and several points around it on the heat dissipating material. Reference measurement was made without any material, only the FET component was heated. The first measurements were made with a thermal imaging camera, since we were interested to see how the heat is distributed on the fabric. However, almost all tested materials are metallic and they reflected thermal radiation from the surroundings. Therefore, pictures did not give reliable results. Due to this we made measurements with a multimeter and with a thermal imaging camera. These two measurement systems are dissimilar. The multimeter measure temperature from the surface of the material and the thermal imaging camera measures temperature radiation from the surface. For comparison we used the numerical values of the thermal imaging camera.
3. Results and Analysis
3.1. Component Temperatures with two Different Methods
Figure 3 presents the results of the tested materials (A-M). The left column (of the pair) is the temperature of the FET component with the thermal imaging camera and the right column is the temperature of the FET component with the multimeter. The last measurement is the reference (ref) measurement and it has been made without any heat sink materials, only the component on the surface of the styrofoam plate has been heated. Separate material groups are shown with different colours.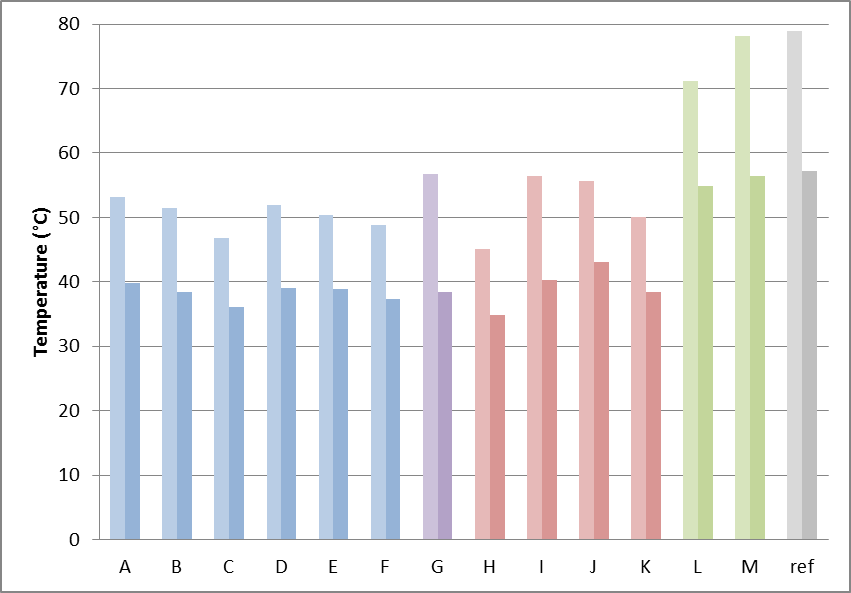 | Figure 3. Thermal imaging camera (left bar) and multimeter (right bar) |
Differences between material samples A-K are small. However, the values are clearly lower than in the reference measurement, which indicates that heat sink materials have worked. In thermal imaging camera measurements, the highest result was 56,7°C (material G), the lowest results was 43,3°C (H) and the reference was 79°C. The measurement results with the multimeter are lower than with the thermal imaging camera and the highest result was 43,1°C (J), the lowest result was 34,7°C (H), and the reference measurement result was 57,2°C. Figure 4 shows the standard deviation of measurements. The standard deviation is smaller in multimeter measurements than with thermal imaging camera measurements varying between 0,3-1,9°C (samples A-K). Samples L and M have quite high standard deviation. 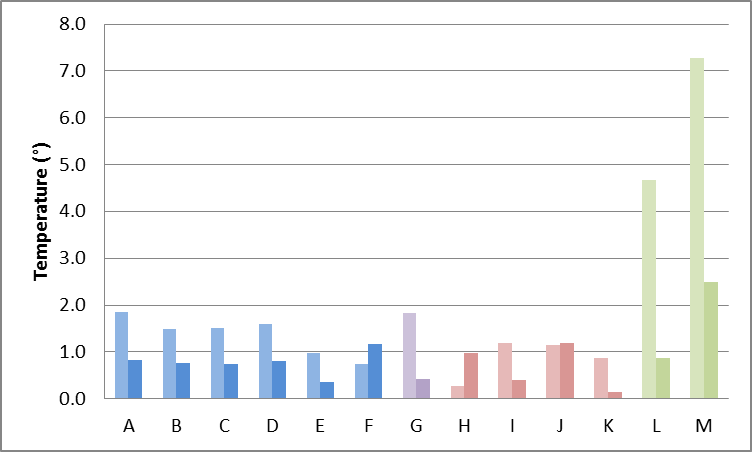 | Figure 4. Thermal imaging camera (left bar) and multimeter (right bar) |
To be able to analyse the results with the same scale the correction coefficient was utilized according to Equation 1. The correction coefficient is defined as the average of the temperature measurement relations between multimeter measurements and thermal imaging camera measurements. | (1) |
Tmm = temperature of multimeterTtc = temperature of thermal imaging cameran = number of samples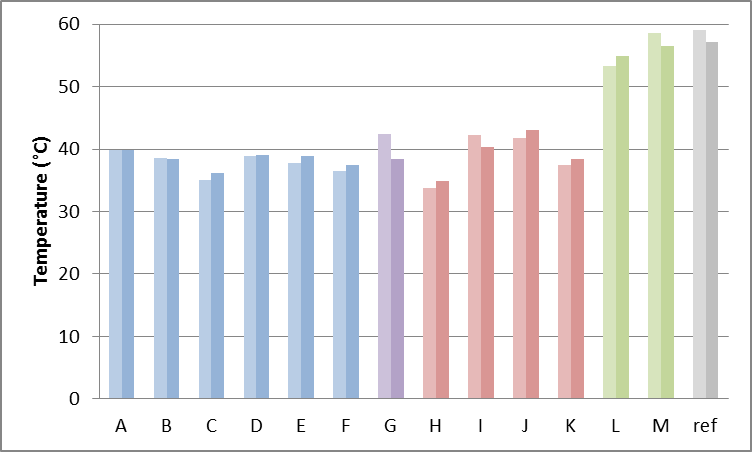 | Figure 5. Thermal imaging camera (left bar) and multimeter (right bar) |
Generally the trend in results is the same kind with and without the utilisation of the correction coefficient. The results of the samples A-F are quite similar, even though thermal conductivities of the utilized samples vary. Samples H-K are made with the same material and only their structures are dissimilar. According to Figure 5 temperature values vary and therefore, the structure clearly affects the results. The best result i.e. the lowest temperature of the component was when utilized the test sample H. The highest temperature was in the sample J, in which conductive fibres are utilised without any weaving or knitting technique and fibres are just put close to each other. In this case the temperature of the component is high and the heat is not transferred effectively between the fibres. The lowest temperature was in sample H. Heat is conducted well along the yarns and actually, the temperature values are lower than in samples A-G. Due to these we can conclude that a yarn conducts heat better than a fibre. Yarns have more metallic in them and therefore, they have better thermal conduction properties than fibres have. The yarn structure in the sample H was loose and there are holes between separate yarns. These holes provide space for heat convection.Our hypothesis was that conductive fabrics (materials L and M) are very potential choices for thermal conductive materials. They are thin and flexible and due to the added metal fibres they should have a better thermal conductivity than the plain textile. In addition, they can be made to almost any desired shapes. However, the results show that the heat of components is almost as high as without conductive material heat sink. Therefore, we can conclude that conductive fabrics can be used in cases like electric wires, but for cooling purposes those materials include insufficient amount of metals. Based on these results, heat transfers to the heat sink material, when the material contains metal. Conductive fabrics included metal parts, but these materials have insufficient contact and dissipation area. Differences between the thermal imaging camera and the multimeter results depend on different ways to measure temperatures. The multimeter measures the surface temperature while the thermal imaging camera measures thermal radiation of the surface. Inconsistency of the thermal coupling between the tip and the material being measured may have caused significant variations in the recorded results. It was tried to minimize by repeating the each measurement three times. The absolute values of the measurements with the thermal imaging camera may not be reliable either. However, they should be consistent with each other because the same kind of heat dissipating component was used on each measured sample and the recorded temperature was taken on top of it. The material of the FETs’ case is plastic which should not cause significant reflections on infrared wavelengths to distort the results. For comparing the properties of heat dissipating samples, however, the thermal images were not very useful since most of the materials were metallic and reflected thermal radiation from the surroundings rather than showed the temperature gradients on their surface.
3.2. Temperatures of Components and Materials
These measurements were made with a multimeter. Temperatures are measured from the topside of the FET and from the surface of the test material (on different part). Results are presented in Figure 6. The left column (of the pair) shows the temperature of the component and the right column shows the temperature of the material.The highest measured temperature in the component measurement was 43,1°C (material J) and the lowest temperature was 34,8°C (material H). In the material temperature the highest results was 50,5°C (material J) and the lowest temperature was 35,1°C (material F). Materials A-F has quite small temperature differences between the component and the material temperatures. In samples G and J temperatures are quite similar and the material temperature is high when compared to the component temperature. In both cases there is a large surface area between the component and the sample. The results of the materials L and M shows that these heat sink materials do not conduct heat effectively. The best heat emission is on the material sample, which have the lowest component and the material temperatures. Thermal conductivity even in these results seem to be irrelevant. Based on the results the material H has the best heat conduction properties. This is due to the facts that yarns have good thermal conductivities and the structure is reticulate and straight. In addition, a yarn is consisted of filaments, which have large surface areas to enable heat emission and to provide a good contact between the component and the material.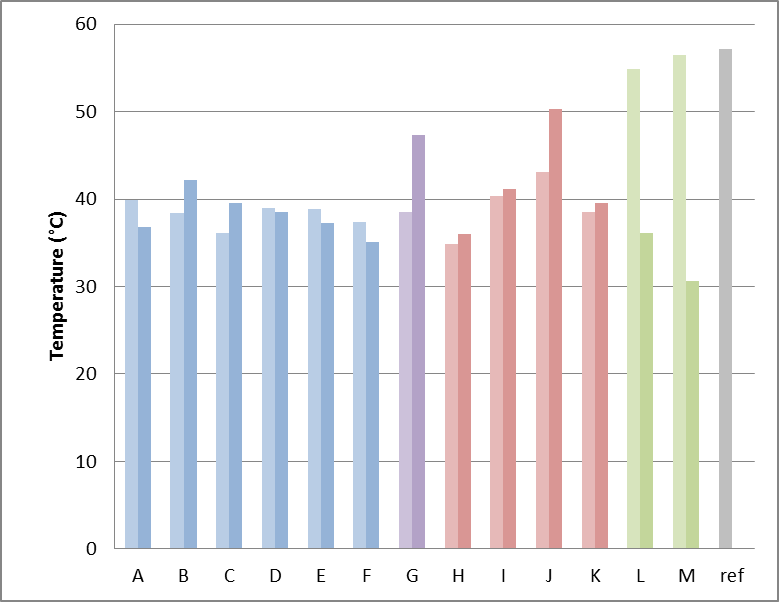 | Figure 6. Temperatures of component (Left bar) and material (Right bar) |
3.3. Conductive Glue vs Thermally Conductive Oxime Cure
All previous measurements have been made utilising conductive mass RTV to fasten the component to the material. In this measurement RTV mass and conductive glue (thermally conductive adhesive Thermopox) has been compared. Thermal conductivity for the glue is 7 W/mK and the connection is ready in 24 hours[16]. On the left side of bars in Figure 7 are illustrated temperatures utilising glue and on the right side are temperatures utilising RTV. The measurement has been made by measuring the temperature of the FET with thermal imaging camera. According, to the results in Figure 7 thermal conductive glue is better connection material than RTV mass when thermal properties are considered. The results were as expected because the glue had better reported thermal conductivity than RTV mass had (thermal conductivity 1.8 W/mK) and thermal conductivity of fastening medium affect the results. If the values of thermal conductivity of fastening materials are low, heat will not transfer effectively across the interface. Also, the air bubbles in the interface material prevent the heat transfer to the other material. We have been looking for a flexible fastening material, which have a good thermal conductivity. Thermal conductive glue has better measurement results, but it is rigid after drying. Whereas RTV mass is flexible, but temperature is higher in the measurements. The interface between the material and the component has the remarkable role since bad heat transfer can even break the component. This interface area and its durability against washing and other stresses should be researched further.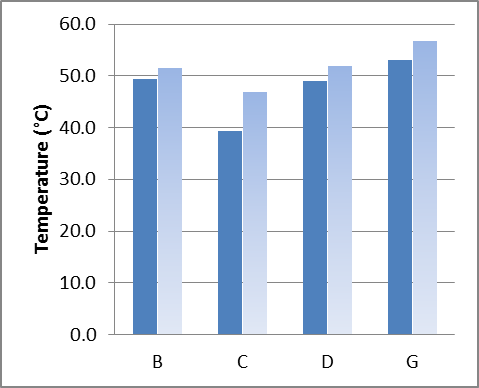 | Figure 7. Conductive glue (left bar), conductive mass (right bar) |
4. Conclusions
Textile electronics is a continuously growing topic and will be more prevalent in the future. The increasing amount of electronics being permanently integrated to the clothing, however, may cause other side effects such as heat dissipation of electronics components. In this research, different kinds of thermal conductivity materials were tested utilising the FET as a heating element. All tested materials were publicly available and generally used in electronics industry. The different thermal conductivity values of the tested materials did not affect much the results. Instead, the thermal conductivity values in fastening material affected more. The interface between the material and the heating element is very important part of the heat transfer. The best material was sample H (tinned copper yarns, weaved), because it had the lowest temperature values. The worst materials were in the samples L and M (electrically conductive fabrics), because these contained too small amounts of metals. All tested materials are thin and flexible and can be easily placed to the clothing. If these test materials are integrated in clothing, attention should also be paid to durability issues such as washing endurance. In the future some of these materials (e.g. material H) will be tested with power LEDs. The LED will also be integrated to clothing and durability tests against washings will be made.
ACKNOWLEDGEMENTS
This study has conducted in the LEDIVA project supported by TEKES (70070/10) and Satakunta region ERDF (SAT/0004/05.02.10/2010).
References
| [1] | J. Rantanen, J. Impiö, T. Karinsalo, M. Malmivaara, A. Reho, M. Tasanen, J. Vanhala, Personal and Ubiquitous Computing ,Volume 6 Issue 1, pp. 3-16, February 2002. |
| [2] | E. H.L. Aarts, J. L. Encarnação, True Visions: The Emergence of Ambient Intelligence, Springer-Verlag Berlin Heidelberg, 2008 |
| [3] | Zysset, C.; Kinkeldei, T.W.; Munzenrieder, N.; Cherenack, K.; Troster, G.; , "Integration Method for Electronics in Woven Textiles," Components, Packaging and Manufacturing Technology, IEEE Transactions on , vol.2, no.7, pp.1107-1117, July 2012 |
| [4] | Cho, G.; Smart Clothing Technology and Applications, CRC Press 2010, Pages 1–35, ISBN: 978-1-4200-8852-6 |
| [5] | Gilsoo Cho; Keesam Jeong; Min Joo Paik; Youngeun Kwun; Moonsoo Sung; , "Performance Evaluation of Textile-Based Electrodes and Motion Sensors for Smart Clothing," Sensors Journal, IEEE , vol.11, no.12, pp.3183-3193, Dec. 2011 |
| [6] | Paradiso, R.; Pacelli, M.; , "Textile electrodes and integrated smart textile for reliable biomonitoring," Engineering in Medicine and Biology Society,EMBC, 2011 Annual International Conference of the IEEE, vol., no., pp.3274-3277, Aug. 30 2011-Sept. 3 2011 |
| [7] | C. Cochrane, L. Meunier, F.M. Kelly, V. Koncar, Flexible displays for smart clothing, Indian Journal of FibreTextile Research, Vol. 36, December 2011, pp. 422-428 |
| [8] | G. Held, Introduction to Light Emitting Diode Technology and Applications, Auerbach Publications 2008, Print ISBN: 978-1-4200-7662-2 |
| [9] | R. C. Dorf, The Electrical Engineering Handbook, Second Edition, CRC Press, 1997. |
| [10] | A. Bejan Heat transfer handbook, Published by John Wiley & Sons, Inc., Hoboken, New Jersey, 2003 |
| [11] | website. Available:http://www.tme.eu/html/EN/tinnedbraids/ramka_1358_EN_pelny.html |
| [12] | website. Available:http://www.tme.eu/fi/katalog/?idp=1&search=plc-90a&cleanParameters=1 |
| [13] | Data Sheet for LessEMF website. Available: http://www.lessemf.com/1212.pdf |
| [14] | website. Available:http://www.shieldextrading.net/pdfs/331.pdf |
| [15] | website. Available:http://www.grovesales.co.uk/products.php?id=677. |
| [16] | website. Available:http://www.biall.com.pl/item,Klej_THERMOPOX_85CT_termoprzewodzacy_5g,404019.html |
 Abstract
 Reference
 Full-Text PDF
 Full-text HTML