M. Alavi1, H. Jazayeri-rad2, R. M. Behbahani1
1Department of Gas Engineering, Petroleum University of Technology, Ahvaz, 63431, Iran
2Department of Instrumentation and Automation, Petroleum University of Technology, Ahvaz, 63431, Iran
Correspondence to: M. Alavi, Department of Gas Engineering, Petroleum University of Technology, Ahvaz, 63431, Iran.
| Email: |  |
Copyright © 2012 Scientific & Academic Publishing. All Rights Reserved.
Abstract
Dimethyl ether (DME) as a new fuel has attracted many attentions for a number of decades and its commercial production has become a vital subject in fuel and energy productions. It can be technically produced in an adiabatic fixed-bed reactor by methanol dehydration by means of solid acidic catalysts such as γ_Al2O3. Methanol conversion and DME yield can be affected by the process settings such as feed temperature and flow rate. In order to examine the influences of these parameters on methanol conversion, a one-dimensional pseudo-homogenous model was developed. The optimum feed condition, with these factors affecting the process in an interacting manner, is determined while imposing some constraints on each decision variable. The performance of the reactor simulated using this procedure indicated a good agreement with its experimental data. This procedure can be applied to any other adiabatic fixed-bed reactor.
Keywords:
Dimethyl Ether, Adiabatic Fixed-Bed Reactor, Pseudo-homogenous Model, Conversion, Optimization
Cite this paper: M. Alavi, H. Jazayeri-rad, R. M. Behbahani, Optimizing the Feed Conditions in a DME Production Process to Maximize the Methanol Conversion, Science and Technology, Vol. 3 No. 2, 2013, pp. 61-66. doi: 10.5923/j.scit.20130302.03.
1. Introduction
Optimizing a chemical process consists of maximizing or minimizing an objective function. In fact, the decision variables are altered in a manner to determine the optimum process conditions while simultaneously imposing some constraints such as lower and upper limits on each variable. These constraints represent the process conditions and help to avoid some risky factors that may cause: unsafe situations in the experiments; uneconomic yield; or harmful effects on the settings. The optimum operating point can be achieved prior to performing the experiments by employing techniques such as experimental design (e.g. the Taguchi approach). However, when many variables are involved in the process, the best way to find the optimum value of the objective function is to model the process and use a mathematical optimization tool[1].The dimethyl ether (DME) production processes have been studied for several years. Within the last two centuries, due to the abundance of petroleum sources, optimization of energy and fuel consumption was not considered to be an important issue. Those sources were quite sufficient for the energy needs in the past. However, the air pollution and global warming from NOx, SOx and toxic particle emissions resulting from the combustion of these fuels, have taken world’s attention to the disadvantages of using petroleum fluids. Among all chemicals being introduced as a replacement, DME has been proved to be a suitable substitution.DME or methoxy methane is the simplest ether with the chemical formula of CH3OCH3. Its physical properties are very similar to the liquefied petroleum gases (LPG). Though, it has high oxygen content (around 35% wt.). In addition, the lack of carbon-carbon (C-C) bond has made it a more suitable and cleaner substitute for LPG. DME can also be a power generator in DME-fired turbines to supply energy. Its reaction with steam leads to a complete conversion of DME to hydrogen, carbon dioxide and carbon monoxide which contains a rich stream of hydrogen required in fuel cell feeds[2].DME can be produced using two methods. In the first method, which is known as the direct method, DME is directly produced from synthesis of gases involving four exothermic reactions. At first, the gases which include CO and CO2 and H2 are synthesized to methanol, and then DME is produced by methanol dehydration. The second method, i.e. the conventional method, which is known also as the indirect method, employs the dehydration of methanol over solid-acid catalysts such as HZSM-5 or γ_Al2O3[3].DME can be produced in a fluidized bed or fixed-bed reactors. Fluidized bed reactors have the best mass and heat transfer capabilities compared to the other class of reactors[4]. However, they are more complex and more expensive. Due to their simplicity in design and operation, fixed-bed reactors are favourite choices for the engineers. Because of their lower costs, adiabatic processes in fixed-bed reactors are commonly employed. Although in these processes temperature control may not be easily achieved.Bercic and Levec introduced a pseudo-homogenous and three heterogeneous one-dimensional steady-state models for DME production in an adiabatic fixed-bed reactor[5]. They showed that a homogenous model, after neglecting the intra-particle gradients and assuming the amount of effectiveness factor of the catalysts to be one, can describe the behavior of the reactor correctly without having significant differences from the actual performance. Farsi et al. proposed a dynamic one-dimensional heterogeneous model for this reaction and tested the reactor using real data from an industrial plant. They controlled the process by a PID controller[6]. Yaseri and Shahrokhi proposed a one-dimensional steady-state pseudo-homogenous model for an isothermal reactor that produced DME from synthesis gas (direct method). They investigated the effects of parameters such as feed pressure, flow rate and shell temperature on CO conversion[7]. Fazlollahnejad et al. developed a one-dimensional steady-state pseudo- -homogenous model for a bench scale adiabatic reactor[8]. Their model was validated with real data demonstrating the effects of the weight hourly space velocity (WHSV) and feed temperature on methanol conversion. The maximum conversion reported was approximately equal to 95.8% at 603.15 K with WHSV of 72.87 hr-1 (Figure 1). Shahrokhi and Baghmishe developed a one-dimensional heterogeneous model to predict the dynamic behavior of a methanol synthesis reactor. An optimizer which considers the maximum allowable temperature as the constraint was applied to find the optimum shell temperature in order to maximize the production yield[9].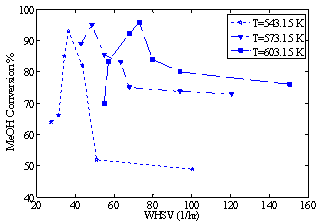 | Figure 1. Experimental data of methanol (MeOH) conversion versus WHSV at three different inlet feed temperatures[8] |
Contrary to the positive effect of higher feed temperature on the reaction rate, because of the exothermic nature of this reaction, a rise in temperature may cause hot spots in the reactor or may result in catalyst deactivation. So finding an optimum temperature profile that maximizes the methanol conversion is essential. In the present work, at first a one-dimensional pseudo-homogenous model is proposed, then the reactor was simulated and its validity was checked with the experimental data given by Bercic and Levec[5]. Consequently, a mathematical constrained optimization was performed to find the optimum feed conditions in order to maximize the methanol conversion.
2. Reaction Kinetics
Dehydration of methanol in order to produce DME can be described as: 2CH3OH ↔ CH3OCH3 + H2 O ∆H = - 23.0 kJmol-1The reaction rate equation proposed by Bercic and Levec[10] is: 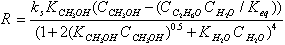 | (1) |
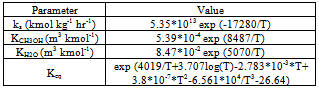
where Ci is the molar concentration for each component, Keq is the equilibrium constant which is a function of temperature, ks is the reaction rate constant, and the parameters KCH3OH and KH2O are adsorption constants presented in Table 1[5].Table 1. The reaction kinetics and equilibrium constants
 |
| |
|
3. Process Modeling and Numerical Solution
Methanol feed is injected into a preheater. It evaporates in the preheater which is kept at a constant temperature. It then enters the reactor. The reaction occurs over the solid acidic catalysts. The gas mixture exiting the reactor contains the products (water and DME) and some of unreacted methanol. A one-dimensional pseudo-homogenous model was developed to describe the behaviour of this system. The model consists of five ordinary differential equations describing: the temperature and pressure profiles; and the concentration profile for each component along the reactor. The mass balance can be expressed as: | (2) |
where Ci is the concentration of component i, ρb is bed density, us is the superficial velocity of the gas mixture and Ri is the reaction rate of component i. The energy balance can be expressed as: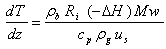 | (3) |
where Mw is the molecular weight of the gas mixture, ρg is the gas mixture density, cp is the overall molar specific heat capacity of the mixture and can be calculated as: | (4) |
The gas mixture is assumed to be an ideal gas, and the molar specific heat capacity cp can be calculated as: | (5) |
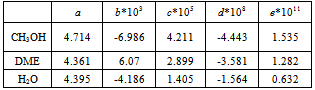
where R is the gas constant and T is the fluid temperature in each segment of the reactor. The values for the constants a, b, c, d and e obtained from Reid and Prausnitz[11] are shown in Table 2.The molar enthalpy of reaction, ΔH, at temperature T is expressed as[12]:  | (6) |
where T0 is the reference temperature and ΔH0 is the molar enthalpy of reaction at the reference temperature. The incremental change in the heat capacity of the gas mixture ∆cp can be expressed as:  | (7) |
Table 2. Parameters of heat capacities correlation
 |
| |
|
The pressure drop in the bed (Ergun equation[13]) can be expressed as: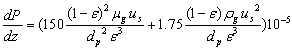 | (8) |
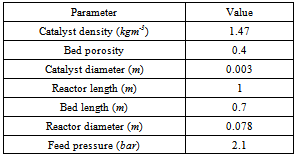
where P is the pressure in each segment of the reactor, ε is the bed porosity, dp is the catalyst diameter and µg is the viscosity of the fluid.The boundary conditions are: The required data for the simulation procedure, such as catalyst and reactor characteristics, are tabulated in Table 3.The above five ordinary differential equations are solved by using the fourth-order Runge-Kutta method. The reactor bed length is divided into 70 segments. Consequently, the methanol conversions and temperatures along the reactor are computed.Although the calculation of pressure drop for each segment of the reactor was performed, however, no significant pressure gradient was observed in this reactor. This is a result of the experimental scale of this apparatus.
 Table 3. Properties of catalyst and operating conditions
 |
| |
|
4. Model Validation and Simulation Results
The reactor is simulated using the data in Table 3. Figures 2a and 2b show the temperature profiles along the reactor when the feed rates of methanol are 4.34 and 6.74 dm3/hr, respectively. Each figure gives the temperature profiles for two different feed temperatures of 551.15 and 561.15 K.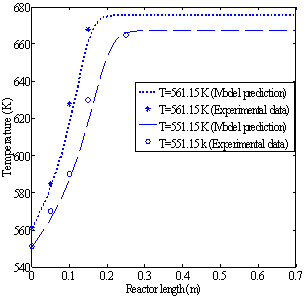 | Figure 2a. Temperature profiles along the catalyst bed (methanol feed rate 4.34 dm3/hr) |
Figures 3a and 3b show the methanol conversion along the reactor when the fresh rates of methanol in the feed are 4.34 and 6.74 dm3/hr, respectively.The experimental value of equilibrium methanol conversion reached at these conditions is about 81%[5]. Each figure gives the conversion profiles for two different feed temperatures of 551.15 and 561.15 K. Comparing these simulation results with the experimental data given by Bercic and Levec[5] shows that the proposed model is able to accurately predict the values of conversions and temperatures along the reactor.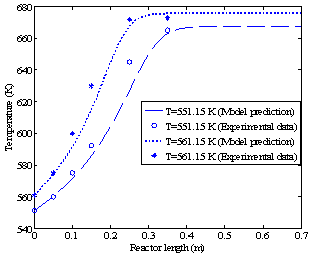 | Figure 2b. Temperature profiles along the catalyst bed (methanol feed rate 6.74 dm3/hr) |
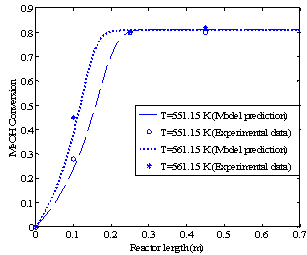 | Figure 3a. Methanol (MeOH) conversion profiles along the reactor (methanol feed rate 4.34 dm3/hr) |
4.1. Effects of Temperature on Methanol Conversion
Since this reaction is an exothermic reaction which takes place in an adiabatic reactor, the temperature along the reactor increases until it reaches the equilibrium point and then remains constant. High temperatures accelerate the reaction rate but at the same time, as a result of the Le Chatelier's principle, they reduce the methanol conversion by reversing the reaction. In addition, temperatures above 674 K will cause hot spots in the reactor, catalyst deactivation and by-product production. Therefore, it is essential to find a feed temperature that maximizes the methanol conversion without violating these constraints.For the given feed pressure (2.1 bar)and feed rate (4.34 dm3/hr), Figures 4a and 4b show that for the feed temperatures above 560 K, a harmful high temperature of 675 K at the equilibrium point is observed.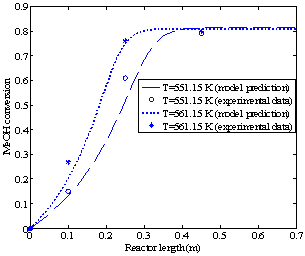 | Figure 3b. Methanol (MeOH) conversion profiles along the reactor (methanol feed rate 6.74 dm3/hr) |
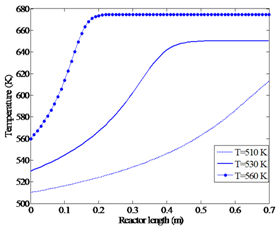 | Figure 4a. Effect of feed temperature on temperature profile (p=2.1 bar, methanol feed rate 4.34 dm3/hr) |
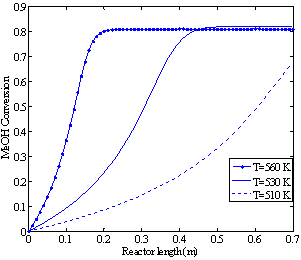 | Figure 4b. Effect of feed temperature on methanol conversion (p=2.1 bar, methanol feed rate 4.34 dm3/hr) |
When the feed enters the reactor at around 510 K, no equilibrium point is obtained along the catalyst bed length. However, at feed temperature of about 530 K, the highest equilibrium conversion among these three investigated conditions is achieved.
4.2. Effects of Flow Rate on Methanol Conversion
By increasing the flow rate, WHSV of the gas increases. This reduces the space time, which consequently does not allow the reaction to proceed properly. As a result, a large amount of unreacted reactant is transferred to the reactor output. Figures 5a and 5b show that at T (feed) = 551.15 K and P = 2.1 bar, flow rates more than 12 dm3/hr do not reach to equilibrium point along the length of the reactor.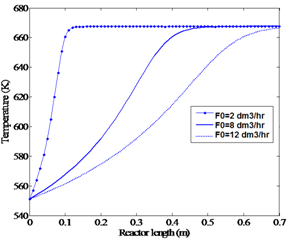 | Figure 5a. Effect of feed flow rate on temperature profile (P=2.1 bar, feed temperature 551.15 K) |
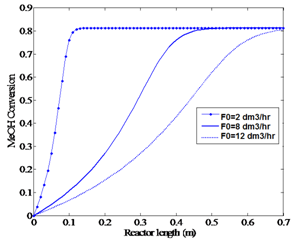 | Figure 5b. Effect of feed flow rate on methanol conversion (P=2.1 bar, feed temperature 551.15 K) |
5. Optimization
As discussed in the previous sections, feed temperature and flow rate are able to influence the conversion and temperature profiles of the reactor. In order to find the optimum condition which maximizes the methanol conversion, an optimization tool which uses feed temperature and flow rate as the decision variables is employed. For both of these variables, proper lower and upper limits are considered as constraints. The four real experiments, the results of which are shown in Figures 2 and 3, were performed under the conditions of feed temperatures of T0=551.15 K and T0=561.15 K and methanol feed rates of F0= 4.34 dm3/hr and F0=6.74 dm3/hr, yielded a maximum equilibrium conversion of about 81%. A high temperature limit of about 670 K (Figure 4a) was observed to be an upper bound constraint for T. A feasible upper limit for the feed flow rate, F0, should be equal to 8 dm3/hr (Figures 5a and 5b). Therefore, the optimization problem should be formulated as: | (8) |
Subject to:F0 < 8 dm3/hrT < 560 K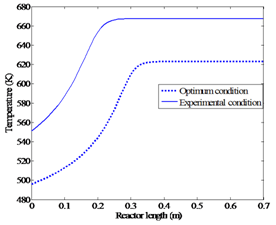 | Figure 6a. Comparing the temperature profiles for the optimum condition and experimental condition |
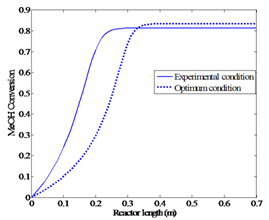 | Figure 6b. Comparing the conversion profiles for the optimum condition and experimental condition |
The solution to this optimization problem gives Topt(feed) = 496 K and Fopt(feed) = 1.1 dm3/hr. The maximum conversion at this condition is about 84%. Figures 6a and 6b represent the new optimum profiles and the profiles of the real experiment.These figures clearly represent that the optimum condition produces improved yield (84%) when compared against the maximum yield obtained from the experimental procedure (81%) reported in the literature[5].
6. Conclusions
A one-dimensional pseudo-homogenous model was developed to simulate the adiabatic fixed-bed reactor for DME production. The conversion and temperature profiles for two different inlet temperatures and flow rates were plotted. It has been shown that these profiles closely fit the experimental data given by a recently published paper. The maximum methanol conversion obtained, using the results of these four experiments, was equal to 81%. The effects of inlet temperature and flow rate on methanol conversion were investigated. Then a constrained optimizer that considers inlet temperature and flow rate as the decision variables, were used to find the optimum condition for methanol conversion. Under the optimum condition, the feed temperature T = 496 K and the feed flow rate F0=1.1 dm3/hr. The methanol conversion was determined to be equal to 84% compared against the suboptimal conversion (81%) reported in the literature.
References
| [1] | C. A. O. Nascimento, R. Giudici, and R. Guardani, "Neural network based approach for optimization of industrial chemical processes," in Computers & Chemical Engineering vol. 24, pp. 2303-2314, 2000. |
| [2] | T. A. Semelsberger, R. L. Borup, and H. L. Greene, "Dimethyl ether (DME) as an alternative fuel," Journal of Power Sources, vol. 156, pp. 497-511, 2006. |
| [3] | M. Xu, J. H. Lunsford, D. W. Goodman, and A. Bhattacharyya, "Synthesis of dimethyl ether (DME) from methanol over solid-acid catalysts," Applied Catalysis A: General, vol. 149, pp. 289-301, 1997. |
| [4] | W.-Z. Lu, L.-H. Teng, and W.-D. Xiao, "Simulation and experiment study of dimethyl ether synthesis from syngas in a fluidized-bed reactor," Chemical Engineering Science, vol. 59, pp. 5455-5464, 2004. |
| [5] | G. Bercic and J. Levec, "Catalytic dehydration of methanol to dimethyl ether. Kinetic investigation and reactor simulation," Industrial & Engineering Chemistry Research, vol. 32, pp. 2478-2484, 1993. |
| [6] | M. Farsi, R. Eslamloueyan, and A. Jahanmiri, "Modeling, simulation and control of dimethyl ether synthesis in an industrial fixed-bed reactor," Chemical Engineering and Processing: Process Intensification, vol. 50, pp. 85-94, 2011. |
| [7] | E. Yaseri and M. Shahrokhi, "Modeling, aimulation and control of a tubular fixed-bed dimethyl ether reactor," Chemical Biochemical engineering, vol. 24, pp. 425-423, 2010. |
| [8] | M. Fazlollahnejad, M. Taghizadeh, A. Eliassi, and G. Bakeri, "Experimental study and modeling of an adiabatic fixed-bed reactor for methanol dehydration to dimethyl ether," Chinese Journal of Chemical Engineering, vol. 17, pp. 630-634, 2009. |
| [9] | M. Shahrokhi and G. R. Baghmisheh, "Modeling, simulation and control of a methanol synthesis fixed-bed reactor," Chemical Engineering Science, vol. 60, pp. 4275-4286, 2005. |
| [10] | G. Bercic and J. Levec, "Intrinsic and global reaction rate of methanol dehydration over .gamma.-alumina pellets," Industrial & Engineering Chemistry Research, vol. 31, pp. 1035-1040, 1992. |
| [11] | R. C. Reid, J. M. Prausnitz, and B. E. Poling, “The properties of gases and liquids”, 4th ed., New York: McGraw-Hill, 1987. |
| [12] | J. M. Smith, H. C. Van Ness, and M. M. Abbott, “Introduction to chemical engineering thermodynamics,” 7th ed., Boston: McGraw-Hill, 2001. |
| [13] | J. M. Coulson, J. F. Richardson, and D. G. Peacock, “Chemical engineering,” 3d ed., Oxford; New York: Pergamon Press, 1977. |
 Abstract
 Reference
 Full-Text PDF
 Full-text HTML