-
Paper Information
- Next Paper
- Paper Submission
-
Journal Information
- About This Journal
- Editorial Board
- Current Issue
- Archive
- Author Guidelines
- Contact Us
Science and Technology
p-ISSN: 2163-2669 e-ISSN: 2163-2677
2013; 3(2): 47-54
doi:10.5923/j.scit.20130302.01
Three Dimensional Seismic/Well Logs and Structural Interpretation over ‘X – Y’ Field in the Niger Delta Area of Nigeria
 Abstract
 Reference
 Full-Text PDF
 Full-text HTML
Ihianle O. E.1, Alile O. M2, Azi S. O.2, Airen J. O.2, Osuoji O. U.2
1Ministry of Special Duties, Oil and Gas, Benin City, Edo State, Nigeria
2Department of physics, University of Benin, Ugbowo, Benin City, Nigeria
Correspondence to: Alile O. M, Department of physics, University of Benin, Ugbowo, Benin City, Nigeria.
| Email: |  |
Copyright © 2012 Scientific & Academic Publishing. All Rights Reserved.
A Three Dimensional seismic, well logs and structural interpretation of a Field in the Niger Delta was done to determine the reservoir properties and volume of hydrocarbon contained within the sand interval at the depth investigated. Data used were well logs, seismic section and the structural map of the top of the sand. The Interactive Petrel Software was used in the Interpretation. Utilizing data from well logs, the reservoir bed boundaries, lithology with local knowledge, petrophysical parameters, hydrocarbon type (gas or oil) and geometry were determined. The seismic section and structure map revealed fault assisted closures at the center of the field, which correspond to the crest of rollover anticlines and which served as the trapping medium. The estimated volume of hydrocarbon in place within the interval ranging from 3,909.06m (12,825ft) to 4,053.84m (13,300ft) was calculated as 289,227,007 bbl (37,281acre-ft) of oil. The study showed the feasibility of integrating borehole data and structural map in mapping reservoir fluid boundaries towards calculating the volume of hydrocarbon in place.
Keywords: Volumetric Analysis, Reservoir Properties, Hydrocarbon Volume, 3D Seismic, Horizon, Tops, Bottoms, Contacts
Cite this paper: Ihianle O. E., Alile O. M, Azi S. O., Airen J. O., Osuoji O. U., Three Dimensional Seismic/Well Logs and Structural Interpretation over ‘X – Y’ Field in the Niger Delta Area of Nigeria, Science and Technology, Vol. 3 No. 2, 2013, pp. 47-54. doi: 10.5923/j.scit.20130302.01.
Article Outline
1. Introduction
- The knowledge of the character and extent of a hydrocarbon reservoir are important factors in quantifying the hydrocarbon in place[20]. The a priori Information required are the thickness, pore space and areal extent of the reservoir. Other intrinsic parameters are the shale volume/content, net to gross ratio and saturation values. These parameters are important because they serve as veritable inputs for reservoir volumetric analysis and consequently estimation of the volume of hydrocarbon in place[10]. Determination of the reservoir thickness is best obtained from cut-offs which are visible on well logs, especially with the gamma ray and resistivity logs[5]. The density-neutron log also provides a means to estimate reservoir thicknesses in addition to revealing the type of hydrocarbon present in the reservoir. A higher percentage of oil and gas is produced from lithologies like sandstones, limestone and dolomites which are first identified with the aid of the gamma ray log[5]. The resistivity log is a valuable tool used to obtain the true formation resistivity as well as identify the oil – water contact as it differentiates between water and hydrocarbon in the pore space of the reservoir rocks[20] and since these logs are recorded with respect to depth, the hydrocarbon-bearing interval can be determined with reasonable accuracy and precision. Accurate mapping of the lateral dimension of the reservoir can either be obtained from correlation between well logs, where abundantly available and spatially distributed[8] or observed impedance contrast seen as direct hydrocarbon indicators on seismic sections[7]. In the study, combination of the use of grids and zones on the structure map of the top of the sand was done while interpolating and extrapolating the various geometrical and petrophysical parameters calculated from well logs. This deterministic estimation of the hydrocarbon in place (HIP) was guided by the procedures employed in static reservoir modelling[8].In calculating the volume of hydrocarbon in place, the gridded gross rock volume (GRV), net to gross (N/G) ratio, porosity and the hydrocarbon saturation of each zones and quadrant[19] were statistically solved taking into cognizance the reservoir bed and fluid boundaries, lithology, shale content, true formation resistivity, cut-offs and contacts. The borehole rugosity, matrix density and rock and hydrocarbon type (gas or oil) were also considered.The objective of this study are to through the procedures outlaid above define the reservoir structure of the field and estimate the volume of hydrocarbon originally in place.
2. Geology of the Study Area
- The ‘X – Y’ Field lies between longitude 6048’E - 6054’ E (Easting) and latitude 4029’N – 4034’N (Northing) located within the swamp region of the Niger Delta Area (Fig. 1) which is composed of an overall regressive clastic sequence reaching a maximum thickness of about 12 km[11]. It contains only one identified petroleum system referred to as the Tertiary Niger Delta (Akata – Agbada) Petroleum System[13]. The Tertiary section of the Niger Delta is divided into three formations, the Akata, Agbada and Benin formations[22]. The Akata formation lies at the base of the Niger Delta sequence and is of marine origin. It is composed of thick shale sequences (potential source rock) and also of turbidity sand (potential reservoirs in deep water) with minor amounts of clay and silt. It began in the Palaeocene through the Recent and is estimated that the formation is up to 7,000m (22,966ft) thick[9]. The formation underlies the entire delta, and is typically over pressured.
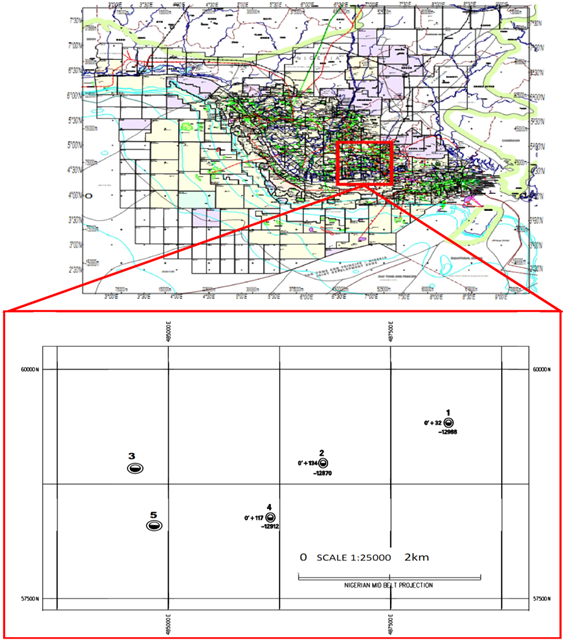 | Figure 1. Map of the Niger Delta showing the location of the study area and the scle in km[16] |
3. Materials
- The study of the field under investigation was initiated in 2009 using data obtained from a multinational oil company operating major fields in the Niger Delta area. The 2-D and 3-D seismic data were acquired in 1972 and 1996 respectively while data from the first well was acquired in 1975. The hydrocarbon found in the reservoir C.1.0 sand is underlain by water, which made it possible for an accurate estimation of Ro and Rt from the log as defined by[3] and[23]. The data used in the study included digital suites of well logs which were imported into the interactive Petrel’s software as shown in Fig. 2, seismic sections, base map and structure map of the study area. The seismic sections highlighted the fault enclosing the reservoir brought about by direct hydrocarbon indicators while revealing the horizons tracked on the reflections across the field.The relevant wireline log signatures and cutoffs were employed to identify the hydrocarbon-bearing reservoirs and compute reservoir petrophysical parameters like porosity, water saturation, net reservoir thickness, gross reservoir thickness and the ratio of net to gross thicknesses[1]. In addition, fluid contacts were delineated. The logs include: gamma ray log (lithology identification), density and neutron log (determining porosity and lithology) and resistivity log (delineating fluid contents and identifying pore fluid type).
4. Methodology
- In determining the lithology, the shale and clean sand base lines were established from the gamma ray log and thereafter the amount of shaliness of the reservoir lithology was calculated. The neutron log porosity corrected for shale volume, provided an estimate of the reservoir rock porosity while the density log was used to establish the lithology type.The resistivity log was used to calculate for Ro (the resistivity of the formation completely saturated with water) and Rt (the resistivity of the formation saturated with hydrocarbon). Using the second Archie’s equation, the water saturation was calculated for the separate reservoir intervals taking into consideration the transition width.According to[8], mapping the lateral boundary of the reservoir can be achieved with well logs where abundantly and spatially distributed. This was done by extracting and mapping cut offs and contacts. In this study, the grid template method was employed both for surface area and depth. The horizons used to define the reservoir boundary were extracted from surfaces, cutoffs and contacts namely, shale – sand horizons, water up to (WUT), water down to (WDT), gas up to (GUT), gas down to (GDT), oil up to (OUT), oil down to (ODT), oil – water contact (OWC), gas – oil contact (GOC), gas – water contact (GWC)) seen on the logs as shown in Fig. 3 guided by the grid-contoured surface map of the C.1.0 sand structure[21] as shown in Fig. 4.The volume of hydrocarbon in place was thereafter calculated using the reservoir net-to-gross deterministic equation[8]:
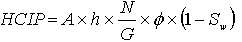 where A = Drainage/Reservoir area, (m2).h = Thickness of the reservoir by taking average values from well log (gamma ray, neutron and density logs) signatures, (m).
  = Average effective porosity obtained from the porosity log, (fraction/%). Sw = Average water saturation value from resistivity log, (fraction/%).
  ratio of net-to-gross thickness of the reservoir as obtained from the gamma ray logs.
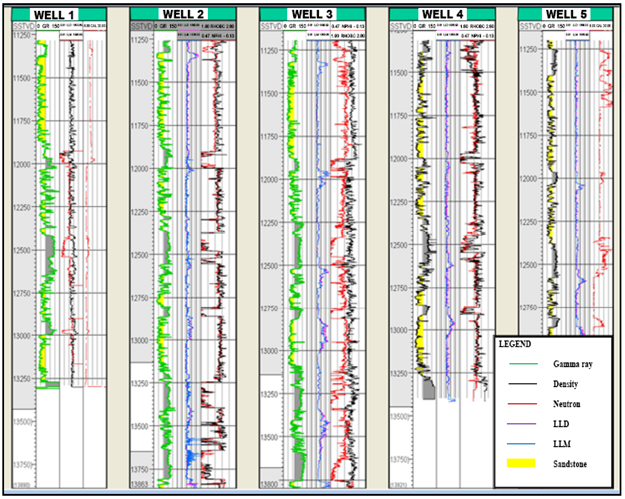 | Figure 2. Well logs displayed on the Petrel well section window[19] |
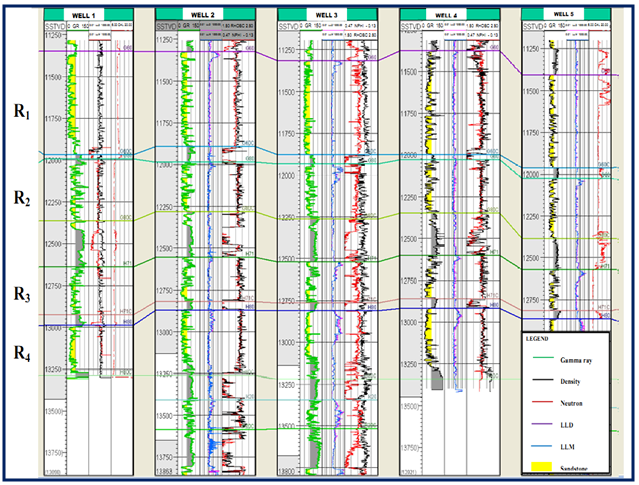 | Figure 3. Top and bottom of the reservoirs as differentiated by the gamma ray log |
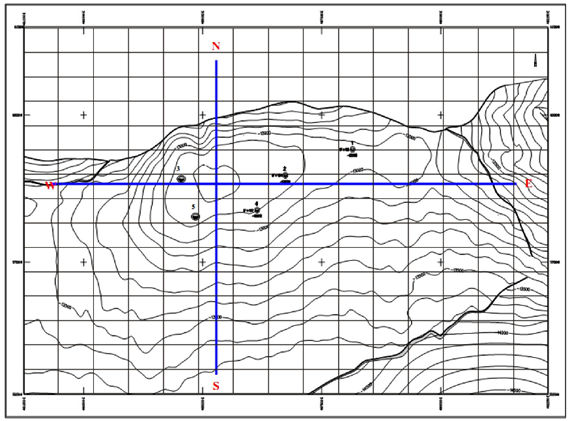 | Figure 4. C1.0 Top depth Structure Map showing cross section lines and grids separated into four quadrants |
|
5. Results and Discussions
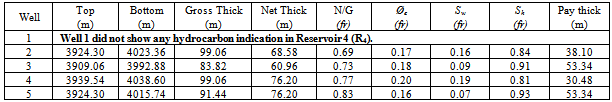
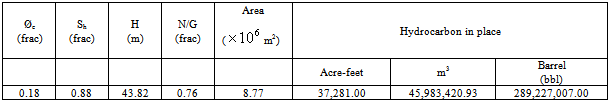
- The well logs revealed four (4) hydrocarbon-bearing sandstone reservoirs - R1, R2, R3 and R4 which were visible from the gamma ray logs and the neutron – density logs after defining the base lines and cut offs. One approach is the use of the gamma ray log for determining the amount of shaliness of a formation and for picking tops[4].[16] applied the method of picking tops from well logs to the reservoirs in the Usso field, in the Niger Delta Basin. Also[8] in his book titled Integrated Reservoir Studies emphasized the use of well logs in correlating seismic data when picking horizons and tops. On the reservoir lithology,[6] and[11] in their respective studies on the tertiary lithostratigraphy of the Niger Delta revealed that the producing intervals are composed of sandstone. The reservoir of interest is the R4 displayed on Fig. 3.The salient reservoir petrophysical properties/parameters obtained from the reservoir is shown in Table 1. The effective porosity varied between 0.16 and 0.20 while the hydrocarbon saturation was between 0.81 and 0.93. The net pay thickness of the reservoir varied between 30.48 m (100 ft) and 53.34 m (175 ft). Data from Well 1 was not obtainable since the resistivity logs clearly showed that there is no hydrocarbon indication even though the gamma ray log showed the sandstone interval. The average effective porosity and average hydrocarbon saturation is 0.18 and 0.88 respectively as shown in Table 2. Averaging of reservoir porosity and saturation values are necessary to obtain single interval values from the heterogeneity of the reservoir layer due to varied forces involved in sedimentation, consolidation and compaction.[18] in their study on seismic-guided estimation of log properties emphasized the need to average log values which is derivable from either the arithmetic or harmonic averaging method[1].[17] obtained near porosity value of 16.5% in their study of the Ossu Oil Field, Northern Depobelt, onshore Niger Delta, Nigeria. Also research works by some authors showed porosity values that were slightly higher than the porosity values obtained in this study.[15] in their study, over the Eve Field, Niger Delta obtained porosity values between 25% and 31%.[2] in their study over the Umoru Field in the Niger Delta obtained effective porosity values between 28% and 30%. Also[10] described the primary Niger Delta reservoirs as Miocene paralic sandstone with 40% porosity. The differences in these values are due to the different sand and shale baselines chosen to arrive at the shale volume used in correcting the porosity for the effect of shale[21].These properties obtained are the parameters required for the deterministic calculation of the hydrocarbon in place.The key to success in interpreting geological maps and models is the ability to think in three dimensions[12]. Drawing geological cross section lines, north to south (N – S), east to west (E – W) and grids across the C1.0 Top Depth Structure Map as shown in Fig. 4 correlated with the horizons reflected on the seismic section of Fig. 5, the well tops from log readings as shown in Fig. 3 and the cutoffs with fluid contacts from log readings as seen on Fig. 3, the reservoir area “A” was projected. This projection was done using the a priori and a posteriori values obtained by interpolation and extrapolation, guided by the square grids in each quadrant. The total estimated area covered by the hydrocarbon sand was 8.77 km2 (2,166 acre).[14] applied this method to capture the complexity of the Burgan Field reservoirs in Kuwait. The shape and character of the reservoir is shown in Fig. 6 and 7. The hydrocarbon pore volume estimated showed that a total estimate of 289,227,007 bbl (37,281 acre-ft) of oil was originally contained in the reservoir sand. The detailed analysis is shown in Table 2.[16] applied this method to evaluate the prospectivity of the Usso Field in the Niger Delta Area
|
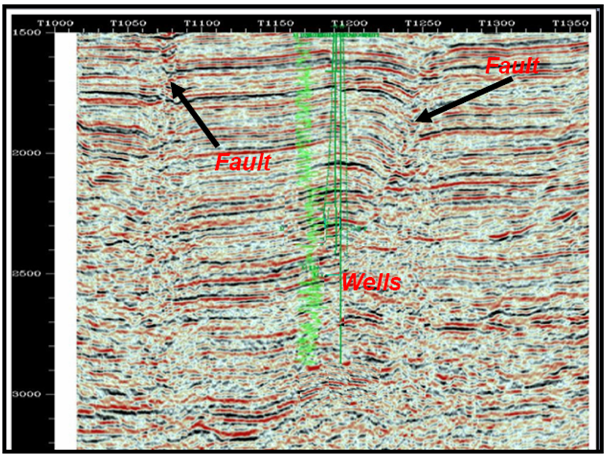 | Figure 5. Seismic section showing the main faults and well positions between faults |
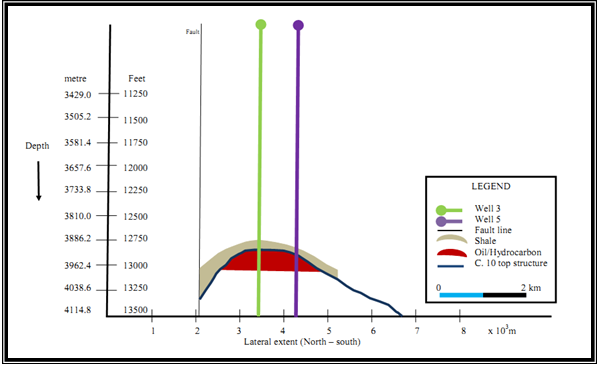 | Figure 6. North – South subsurface Cross Section of the ‘X – Y’ Field |
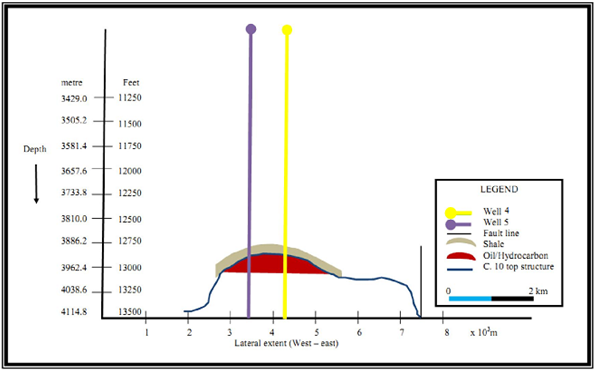 | Figure 7. West – East subsurface Cross Section of the X – Y Field |
6. Conclusions
- In this study, having carried out a 3-D structural interpretation of the ‘X – Y’ field, characterized and quantified by the use of well logs, surface seismic sections and structure map, the hydrocarbon in place within the depth interval ranging from 3,909.06m (12,825ft) to 4,053.84m (13,300ft) was estimated. From the well log data analyzed, four hydrocarbon bearing reservoirs (R1, R2, R3 and R4) were identified but that of interest is R4. By projecting the a priori and a posteriori values obtained by interpolation and extrapolation from the well logs guided by the grids on the structure map, the shape and geometry of the reservoir was determined while making use of the petrophysical parameters of the reservoir.Reservoir areal extent obtained revealed that the C.1.0. Top sand reservoir had an area estimate of 8763.99 m2 and an estimated volume of hydrocarbon in place of 289,227,007 bbl of oil.The structure map and seismic section revealed also that the principal structure responsible for the hydrocarbon entrapment in the field was the anticlinal structure at the center of the field which is tied to the crest of the rollover structure assisted by faults.