-
Paper Information
- Next Paper
- Previous Paper
- Paper Submission
-
Journal Information
- About This Journal
- Editorial Board
- Current Issue
- Archive
- Author Guidelines
- Contact Us
Science and Technology
p-ISSN: 2163-2669 e-ISSN: 2163-2677
2012; 2(5): 122-129
doi: 10.5923/j.scit.20120205.03
He II Line 4686 a as Wavelength Standard for Fourier Transform Spectrometer
 Abstract
 Reference
 Full-Text PDF
 Full-Text HTML
Waqar A. A. Syed 1, 2, Nazar A. Shah 3, Z. Wazir 2
1Blackett Laboratory, Imperial College of Science, Technology and Medicine, London SW7 2AZ, UK
2Department of Physics, International Islamic University, Islamabad, Pakistan
3Department of Physics, COMSATS institute of Information Technology, Islamabad, Pakistan
Correspondence to: Z. Wazir , Department of Physics, International Islamic University, Islamabad, Pakistan.
| Email: |  |
Copyright © 2012 Scientific & Academic Publishing. All Rights Reserved.
We report the experimental work for the determination of wavelength standard to validate the measurements of Fourier transform spectrometer. A dc run hollow-cathode discharge with two anodes on either sides of a cathode is designed for the precise measurements of He II lines at 4686 Å. The Doppler width and ion-drift shift were measured by using each anode alternatively which changes the direction of electric field from 0o to 180o. The stability of He II line has been investigated and comparable precision with respect to previous work has been obtained. Excellent wavelength accuracy with relative uncertainty in line position of the order of 108 is within reach of single point calibration factor.
Keywords: Frequency Standards, Fourier Transform Spectroscopy, Width and Shift of Lines
Article Outline
1. Introduction
- We report the experimental work for the determination of a wavelength standard to validate the measurements of Fourier transform spectrometer. The development of high resolution Fourier transform spectroscopy (FTS) with its wide spectral range, high wavelength accuracy has led to outstanding improvements in the laboratory data base in the infrared, visible and ultraviolet regions[1-4], however significant improvements can be achieved by using a single calibration factor, which has been reported to reduce the uncertainties to a few parts in 108. The simplest method of wavelength calibration in the visible and ultraviolet regions is the one using a primary wavelength standard together with a number of secondary standards distributed throughout the spectrum. The FT spectrometry requires fewer standards than prism and grating instruments. The orange line of krypton has been considered as primary standard for many years along with the secondary standards, mostly the lines of iron, thorium and inert gases. The accuracy degenerates as one goes into the infrared or ultraviolet; because of the difficulties associated with the large number of intermediate steps and the actual measurements. Overlapping orders in grating spectra have been used to extend visible standards to the ultraviolet, but this led to large systematic errors, since spectra of different orders are sometimes focused in different planes, which are slightly displaced relative to each other. Moreover asymmetry of the instrumental line contour may lead to an apparent shift of spectral lines in spectra of different order. Therefore, it is essential to find some independent method for the determination of wavelength standards in the VUV. Suitable standards are provided by lines whosewavelength can be calculated by Ritz's combination principle or from Dirac-Sommerfeld theory of one electron spectra, with the Lamb shift correction. Fundamental principles for selection of wavelength standard in VUV are described in references[5-6].
2. FTS and Wavelength Standards
- Learner et al [7] and Salit et al [8,9] have briefly discussed the problems concerning the calibration of a spectrometers. They stressed on the need of a single multiplicative correction factor for the absolute calibration of a spectrum. For a FTS, the sampling laser leads directly to a wavenumber scale which is linear to within the stability of laser i.e. 1:108. The need for correction of the wavelength scale arises from the use of a finite entrance aperture and imperfect optical alignments within the interferometer. Although an analytical correction can be made for the finite aperture effect; calibration with a trusted wavelength standard is typically used to accomplish both corrections. Excellent relative accuracy is available with relative ease in FT spectroscopy, however the determination of the absolute wavelength is entirely different from the spectra observed from the grating instruments, and therefore accurate wavenumber orwavelength calibration requires major differences in experimental strategies. If wavelength accuracy is limited by noise, the uncertainty in the line position is roughly the linewidth divided by the product of signal to noise ratio and the square root of the number of the samples in the linewidth. If both the resolution and S/N are high enough, the position uncertainty due to photon noise can be made very small. While recording an interferogram, all lines are observed at all steps of scan, therefore, the determination of the wavenumber-axis in the spectrum depends on the correct and accurately equal scanning steps. The phase corrected and un-calibrated output is already on a self-consistent linear wavenumber scale determined by this step. Therefore for FTS, only one standard is needed to give a complete calibration of a wavenumber scale.A test for internal consistency[7] is described by the criterion that the plot of ‘
 ’ against ‘
 ’ should be a horizontal line. The true wavenumber ‘
 ’ can be expressed in terms of observed wavenumber ‘
 ’
’ | (1) |
 , and
, and  . The wavenumber scale of an FTS is determined by the cosine of angle between optical axis and the light being measured. ‘
 ’ is of the order of ‘
 and therefore, is independent of ‘
 ’ and can be found from a single reference standard. Theoretically, only one calibration line is needed but the common practice is to calculate ‘
 ’ for every line of sufficient strength for which a trusted wavelength is available. This aggregate would typically be used to calculate a single ‘
 ’ as a mean and reduce the uncertainty in the calibration.The calibration lines employed should ideally possess wavenumber measurements, at least an order of magnitude greater in accuracy than the lines in the spectrum to be calibrated, however this may not always be possible. On plotting ‘
 ’ against ‘
 ’, a horizontal line should be obtained where the value of offset from zero is the calibration constant needed to put the line number on an absolute scale. Obtaining the sloping line implies the pressure of illumination shifts. The linearity of the wavenumber scale means that the wavenumber calibration can be transferred from one spectrum to another if the spectra are overlapping.The requirement of an absolute calibration limits us to calibrate with the lines generated within the same lamp[7]. Argon is one of the most useful sources of standard wavelengths, carefully determined Norlen[10]. He excited the Ar II spectrum in water cooled hallow cathode at a pressure of 0.2 torr and measured the vacuum wavelength with a Fabry-Perot interferometer. We have compared the observations from our double-anode hollow cathode with the Norlen’s standards. The plot of ‘
 ’ against ‘
 ’ clearly deviates from the horizontal line, similar to the pattern observed by the IC group and at Kitt-Peak. In this plot the scatter is a little bigger as compared with the work of Pickering[11] and Learner[7] at IC, they described this shift due to the difference of pressure and running conditions of the lamp. Salit et al[8] believed that the apparent slope between their FTS measurements and the Fabry-Perot measurements of Kaufman[12] is not due to the operating conditions of lamp. Regardless of the linewidth or source an asymmetry was found in the FTS instrumental line shape in the spectra and no significant change in slope is found when line shape asymmetry was reversed. An extensive 'Th' atlas was prepared with FTS at Kitt Peak[13] showing a systematic bias between FTS and Fabry-Perot measurements as a function of wavenumbers. Both Fabry-Perot and FTS possess very high levels of internal consistency, and it was not clear whether the observed disagreements were due to FTS, or due to Fabry-Perot, measurements; which deepens our concern that these wavelength standards are a primary source of the observed bias and are not quite adequate standards.
2.1. He II 4686Å as Standard
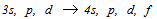
- The spectrum of singly ionized helium has been as important in the history of spectroscopy or as that of the hydrogen itself[14]. The 4686 Å line of He+ corresponds to the
 lines of hydrogen but with a factor of Z2 (=4) in energy. The fine structure of the ionized helium He II ,3s, p, d −4s, p, d, f line complex
  is sixteen times wider and Doppler widths fifty percent smaller than corresponding structure in hydrogen, and therefore λ4860 Å offers a better opportunity than ‘
 ’ for the resolution of its components. The relative separations of these components provide a fundamental test for the predictions of quantum electrodynamics[15][16-17]. The excitation[20] requires a relatively violent gas discharge, which favors neither a small Doppler width nor freedom from the influence of electric fields. Its attraction as a test of radiation theory lies particularly in the possibility of checking the predicted dependence of term shift on ‘n’ and on ‘Z’. Larson et al[21] have used gaseous atomic beam light source with pressure scanned Fabry-Perot spectrometer. The measured widths were about 0.085 cm-1 comparable to those of hallow cathodes, but much wider than the observed natural width. Berry & Roesler[17] have described these widths arises in the excitation process, as the atomic beam density is low enough to rule out any collision during decay
3. Experimental
3.1. UV-Fourier Transform Spectrometer
- The present work was carried out by using a commercial FT500 FTS built by Chelsea instruments based upon the prototype developed at IC, London. It is a compact instrument of size 1.5 m x 0.25 m x 0.25 m. The experimental interferograms and spectra were taken / processed using the software “GREMLIN” developed by J. W. Brault[24]. The running conditions for the lamp were optimized using a 1 meter 'Monospek' grating monochromator containing a 102 mm wide grating ruled at 1200 lines per mm giving a resolution of 24 mÅ at a wavelength of 3000 Å. The lines particularly chosen for the observation were He I 4713 Å and He II 4686 Å. We have tried to run the lamp at the lowest possible pressure just above 0.1 mb and current of 8 mA. The lamp is run either in pure helium or with a mixture of 1 to 5 percent of argon in helium. Entrance and exit aperture were set to 100 μm, limiting the resolution to 0.8 Å, but allows good light throughput.
3.2. Designing of Light Source
- In hollow-cathode light source[25-26], the atoms are moving at high speeds and are subjected to the perturbing influences of electric fields, magnetic fields and collisions with other atoms and ions. The broadening effects are associated with inter atomic collisions, and therefore operating the discharge tube at low pressure can reduce inter-atomic Stark effect, then the principal contributor to the observed linewidth is that due to Doppler effect. However, if the source is placed in a low temperature bath, and operated at a low current density, Doppler temperature broadening can also be reduced.For this study, a dc run hollow cathode discharge was designed with two anodes on either sides of the cathode. The measurements were made using each anode alternately, which changes the direction of electric field from 0o to 180o. The cathode and the anode were open ended cylinders, machined from 99.99% pure copper and joined to Pyrex tube and designed to be cooled below to -50℃. The lamp run at a very low currents of 15 mA at 300 to 350 V, which was in order to reduce the Doppler width. The cathode was 12 mm in bore and 25 mm in length with a wall thickness of 20 mm. The inner walls of cathode were given 2% taper towards one end for easy cleaning whereas six notches of size 2 × 1 × 2 mm were machined on the outer wall. The idea behind these notches was to promote rapid cooling of the cathode. The inner diameter of the anodes was 16 mm and the lengths were the similar to that of cathode. The thickness of the outer walls was 16 mm and since the cooling of the anode was not required, the outer walls were left plain. The ends of copper pieces were machined with a ledge on a thin lip of 5 mm so that the Pyrex spacers could be slip fitted inside the lip and butted against the edge. These lips were made with great care, and were as thin as possible (about 100 µm). A gap of 25 µm between these lips and Pyrex was made in the order to accommodate the difference between the thermal expansion of the copper and Pyrex. Helium at a pressure of usually 0.1 to 0.4 mb continually circulated in the lamp. The pressure was monitored with a Pirani gauge, fixed very close to the lamp. The diagram of the lamp is given in the Fig. 1.
3.3. Optimizing the Running Condition of Lamp
- To get the best possible optical alignment of the source with the FTS is very crucial. A little off axial displacement produces non-uniform radiance on the aperture of the FTS and causes illumination shift[7]. Since it was not possible to put an external laser beam through the lamp and FTS, the adjustment was done by illuminating the aperture of the FTS with minor adjustments of the source and focused by a lens and then the signal at the detector was maximized.
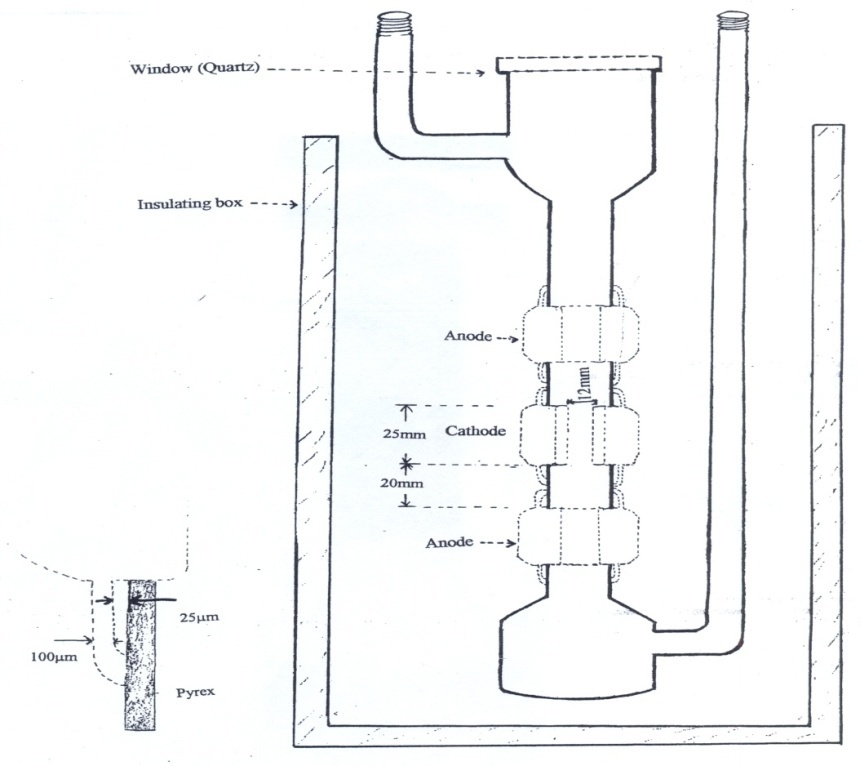 | Figure 1. Double anode lamp used in this study |
- The lamp was initially designed to work at Liquid nitrogen temperature. Unfortunately the glass to metal seal could not sustain at this temperature. Therefore, with the help of an external fan, and by putting liquid nitrogen in the bottom of the bucket, avoiding liquid nitrogen to be in direct contact with the glass to metal joints, we managed to get temperature much below -50℃. All the interferograms recorded during this experiment were at this temperature.
3.4. Data Acquisition
- Prior to all observations the FTS was evacuated to about 10-4 mbar, which was necessary to avoid making a correction for the refractive index of the air and it also reduces acoustic noise. The modulation is maximized using a solar blind photomultiplier to detect a mercury spectrum dominated by the line at Hg (253.7 nm). The detector was a photomultiplier '1P28'. The signal to noise ratio in the FTS spectra was extremely weak for the desired line which was improved to 74 by 1000 coaddings. Twenty batches of 50 co-added scans were recorded and then the spectra were added. Sufficiently pure helium gas for filling the discharge tube was obtained.
4. Results and Discussion
4.1. Calibration for Aperture Offset
- A crude shift of 50 mK was applied as the initial calibration constant to compensate for the aperture offset. The whole pattern was shifted in steps of 0.5 mK to obtain the smallest residual between the observed and simulated pattern. Fig. 2. is plot of the offset of the whole complex versus the residual left after overlapping with the experimental profile; the uncertainty in wavenumber is about ± 1.5 mK. The energy level diagram, Fig. 2 shows all thirteen transitions between (n = 4) to (n = 3) level of ionized helium. A comparison of the observed line position, best-fit of all components with theoretical positions of each component is given in Table 1. The extremely small discrepancies as given in column 6 imply an excellent close match. The errors on line positions are much smaller than the fitting lines individually. A fundamental test for the predictions of quantum electrodynamics is the calculation of the relative separations of these components. Theoretical positions calculated from the energy-level tables for one electron spectra[18] and the lsq fitted positions of line components relative to the component 5,
 of the complex are given in the table. An offset of 51 mK has been applied before making this comparison. The best position measurements of the past studies[17].recorded on Fabry-Perot instrument are also included in Table 1. In our studies the recorded linewidth of the components are about 235 mK for the strong isolated components i.e. 5 and 8+9 with an uncertainty of ±1.6 and ±1.3mK respectively, which is 8/1000 and 6/1000 of the line widths respectively. This indicates the high precision attained in this experiment. Fig. 3. shows the recording of He II, 3s, p, d −4s, p, d, f line complex from the double anode hallow cathode together with the fitted profile of line. The superior resolution and precise calibration allow good measurements to be made on all well resolved lines. After getting a satisfactory fit the centre of each line was measured with respect to the reference component 5. Although the low signal to noise ratio makes it difficult to determine the width and profile more accurate, the resolution was sufficient to obtain measurements of the more widely spaced components 10 and 11 to the accuracy comparable with the reference[17]. For the component 5, (
 ) was calculated to calibrate the wavenumber in the spectrum, where
  . a plots of
  versus showing the effects of wavenumber correction is given in Fig. 4. It is interesting to note that the value of
  is almost the same (4 × 10⁻⁸) for the argon standards for the wavenumber 21300 K, and He II line (21335 K).
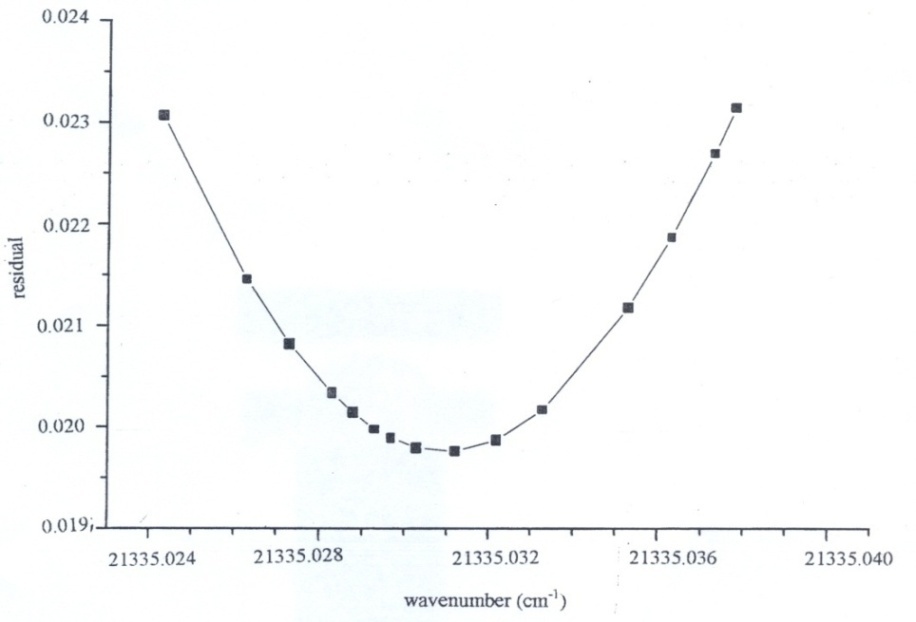 | Figure 2. Plot of wavenumber offset versus residual left on overlapping the experimental profile with the theoretical one |
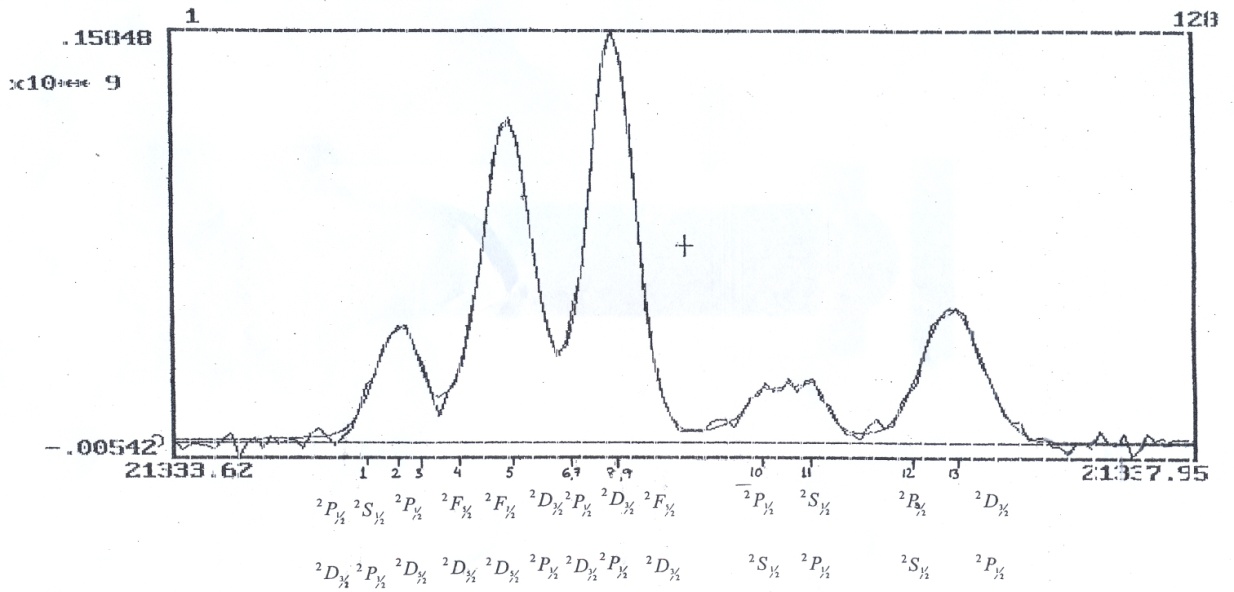 | Figure 3. Spectra of He II 3s,p,d-4s,p,d,f complex, observed from double anode hollow-cathode together with the fitted profile |
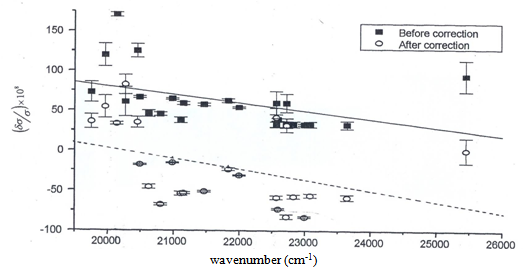 | Figure 4.  versus versus  , solid line represents before applying the correction and dotted line represents after correction, taking component 5 as reference , solid line represents before applying the correction and dotted line represents after correction, taking component 5 as reference |
4.2. Relative Line Intensities and Positions
- The low pressure glow discharges are not a local thermodynamic equilibrium (LTE). The observed intensity of a line depends upon the population among the various excited states as well as the intrinsic transition probabilities and is affected by absorption and reemission by neighboring atoms. The measurements of the emission intensities yield the product of population density and oscillator strength, and if the latter is known the former can be deduced. Most past studies of 4686 Å have produced intensity anomalies. The analysis of the Roesler and Meck[16] showed a greater deal of sensitivity of the upper levels, especially 4s and 4p levels to the pressure, current and geometry of the hallow cathode. Bethe and Salpeter[27] have theoretically calculated the line intensities of one electron spectra. However in the absence of LTE the population of each level depends on the balance between excitation and de-excitation rates and does not necessarily follow the statistical distributions. With different excitation conditions a different set of intensities may be observed. That was the main reason that we really aimed to resolve all the components of the line properly.The calculated statistical intensities, of all lines allowed in
 complex relative to that of,
 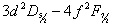 as 100 are presented in Table 2. Concerning the blends between components, assuming that all the lines would have the same recorded profile if they were unblended, a standard profile of the blend (8+9) was determined by neglecting the small separation between 8 and 9. Relative to the strongest component, the intensities and widths of the other components were allowed to vary to obtain best match to observed pattern, except where two components have the same upper level their relative intensities were clamped at theoretical ratios. The fitted FWHM of eight components, including the component 5, which is well resolved and with a good signal to noise ratio, is of the order of 235±3.2 mK, and that the width is assumed to be the FWHM of all thirteen components of the complex.
|
4.3. Linewidth and Shifts
- In a real light source, the effects from inter-atomic collisions and Stark effects can be reduced by operating the discharge tube at low pressure and current. The remaining contributor to the broadening that is left is called the Doppler effect, where the Doppler FWHM is
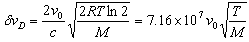 | (9) |
 ) of He II 4686 Å and He I line 4713 Å
 . We define the shift to be positive when the shift implies a motion of the ion towards the spectrometer. A very small shift in the neutral helium lines shows consistency with the explanation that the Doppler shift of neutral atomic line is caused by momentum transfer from electrons, which drift opposite the field direction. The importance of the drift shift is its effect on the determination of the correct wavenumber, and obviously measurements taken with the field direction alternatively towards and away from the spectrometer must be averaged. The summarized results for the components having reasonable signals to noise ratio of He II 4686 Å, He I 4713 Å and Norlen's Ar II standards observed during this experiment are presented in Table 3. The plots represent calibration lines with respect to selected lines of Norlen's Ar II standards and spectrum on observing the He-Ar lamp in two directions i.e. 0o to 180o to the anode cathode axis are given in Fig. 5. The positive shift implies a motion of ions away from the anode, which can be considered as significant shift.
|
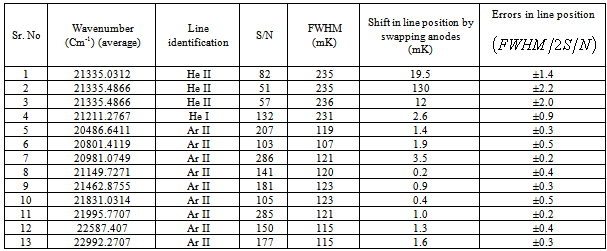
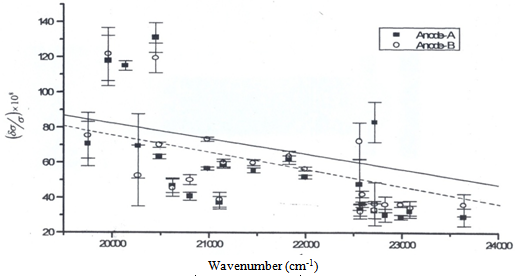 | Figure 5. Plot showing  versus versus  , here , here  . Plot represents the selected Norlen’s standards and on observing He-Ar lamp in two directions i.e. 0° and 180° . Plot represents the selected Norlen’s standards and on observing He-Ar lamp in two directions i.e. 0° and 180° |
4. Conclusions
- Excellent relative wavelength accuracy is available with relative ease in FT-spectroscopy, however accurate wavenumber calibration requires major differences in experimental strategies. The stability of He II 4686Å lines has been investigated concerning the limiting uncertainty involved in calibrating FTS spectra by using a single calibrating factor to the entire optical frequency range. The whole complex or some of its components could provide excellent line calibration factor for FTS spectra. A comparable precision with respect to previous work has been obtained. Despite the rather larger Doppler widths, the calibration accuracy using this line is about 1 mK.
ACKNOWLEDGEMENTS
- W Syed would like to gratefully acknowledge Dr. Anne P. Thorne for her valuable support and helpful discussion during this work at Imperial College. (late) Dr. R.C.M. Learner suggested the work and his support is highly appreciated and acknowledged. Author is grateful to Dr. J.C. Pickerring, and G. Cox at IC, and Tariq Aziz at CIIT for their help and support, Islamabad.
References
| [1] | P. Luc and S. Gerstenkorn, “Fourier transform spectroscopy in the visible and ultraviolet range,” Appl. Opt. 17, 1327 - 1331 (1978). |
| [2] | J. W. Brault, “Fourier transform spectrometry in relation to other passive spectrometers,” Philos. Trans. R. Soc. London. Ser. A307, 503 - 511 (1982). |
| [3] | A. P. Thorne, “High-resolution Fourier transform atomic spectrometry,” J. Anal. At. Spectrom. 2, 227 - 232 (1987). |
| [4] | A. P. Thorne, “Fourier transform atomic spectroscopy in the ultraviolet,” Anal. Chem. 63, 57A - 65A (1991). |
| [5] | A. P. Thorne, Spectrophysics (2nd ed. Chapman and Hall, London, 1988). |
| [6] | B Edlén, " Wavelength measurements in the vacuum ultra-violet," Rep. Prog. Phys. 26 181 - 212 (1963). |
| [7] | R. C. M. Learner and A. P. Thorne, “Wavelength calibration of Fourier-transform emission spectra with applications to Fe I,” J. Opt. Soc. Am. B 5, 2045 - 2059 (1988). |
| [8] | M. L. Salit, J. C. Travis, and M. R. Winchester, “Practical wavelength calibration considerations for UV-visible Fourier-transform spectroscopy’, Appl. Opt. vol. 35, No. 16, 2960 - 2970 (1996). |
| [9] | M. L. Salit, C. J. Sansonetti, Damir Veza, and J. C. Travis, "Investigation of single-factor calibration of the wavenumber scale in Fourier transform spectroscopy," J. Opt. Soc. Am. B.21, No. 8, 1543 - 1550 (2004). |
| [10] | G. Norlen, "Wavelengths and Energy Levels of Ar I and Ar II based on New Interferometric Measurements in the Region 3 400-9 800 Å," Physica Scripta. 8 249-268 (1973). |
| [11] | J. C. Pickerring, "Ph.D. dissertation, University of London" (1993). |
| [12] | V. Kaufman, “Wavelengths, energy levels, and pressure shifts in mercury 198,” J. Opt. Soc. Am. 52, 866 - 870 (1962). |
| [13] | Palmer, B. A., and Engleman Jr. R. E., ‘Atlas of the Thorium Spectrum’, Los Almos National Laboratory Rep. LA-9615 (National Technical Information Service, Springfield, Va. (1983) pp.8 |
| [14] | A. Fowler, "Hydrogen, Spectrum of, Observations of the principal and other series of lines in the," Monthly Notices of the Royal Astronomical Society 73, 62–105 (1912). |
| [15] | G. W. Series,"The Fine Structure of the Line 4686 angstrom of Singly Ionized Helium," Series Proceedings of the Royal Society of London. Series A, Mathematical and Physical Sciences. 226, No. 1166 (Nov. 23, 1954) 377 - 392 (1951). |
| [16] | F. L. Roesler and J. E. Mack, "Behavior of the He II 3s, p, d-4s, p, d, f Line Complex in a Hollow Cathode Plasma," Phys. Rev. 135, No.1, A58 - A71 (1964). |
| [17] | H. G. Berry and F. L. Roesler, "Excitation of Ionized Helium States in a Cooled Hollow- Cathode Discharge" Phys. Rev. A. 1, 1504 - 1517 (1970). |
| [18] | J. D. Garcia and J. E. Mack, "Energy Level and Line Tables for One-Electron Atomic Spectra," J. Opt. Soc. Am. 55, 654 - 685(1965). |
| [19] | H. A. Bethe and E. E. Salpeter, Quantum Mechanics of One- and Two- Electron Atoms (Plenum Publishing Corporation, Newyork 1977) |
| [20] | J. M. Hariman, “Numerical Values for Hydrogen Fine Structure”, Phys. Rev. 101, 594 – 598 (1956). |
| [21] | H. P. Larson and R. W. Stanley, "Analysis of the He II 4686 Angstroms (n=4 to n=3) line complex excited in an atomic-beam light source," J. Opt. Soc. Am. 57, 1439-1449 (1967). |
| [22] | A. P. Thorne, C. J. Harris, I. Wynne-Jones, R. C. M. Learner, and G. Cox, “A Fourier transform spectrometer for the ultraviolet: design and performance,” J. Phys. E 20, 54-60 (1987). |
| [23] | A. P. Thorne, in Proceeding of an ESA Workshop on Solar Physics and Astrophysics at interferometric esolution, ESA SP-344, 191(1992) |
| [24] | J. W. Brault, computer code GREMLIN (national Oceanic and Atmospheric Administration, Aeronomy Laboratory, Boulder, CO, 1994-1995) |
| [25] | S. Tolanski, Introduction to Atomic Physics (Longman, 1963). |
| [26] | F. Llewelyn-Jones, "The Glow Discharge and Introduction to Plasma Physics," Metuen and Co. Ltd., London (1966). |
| [27] | H. A. Bethe and E. E. Salpeter, Quantum Mechanics of One and Two Electron Atoms (Academic Press Inc, New York 1957). |
| [28] | F. L Roesler and L De Noyer, (1964), "Differential Motion of Excited He+ Ions in a Hollow Cathode Plasma" Phys. Rev. letters, 12, 396-398 |