-
Paper Information
- Next Paper
- Previous Paper
- Paper Submission
-
Journal Information
- About This Journal
- Editorial Board
- Current Issue
- Archive
- Author Guidelines
- Contact Us
Science and Technology
p-ISSN: 2163-2669 e-ISSN: 2163-2677
2012; 2(4): 87-97
doi: 10.5923/j.scit.20120204.06
Heavy Metals in Vasai Creek, Mumbai: Applied Monitoring and Impact Assessment
 Abstract
 Reference
 Full-Text PDF
 Full-Text HTML
Pravin U. Singare , Manisha P. Trivedi , Ravindra M. Mishra
Department of Chemistry, Bhavan’s College, Munshi Nagar, Andheri (West), Mumbai 400058, India
Correspondence to: Pravin U. Singare , Department of Chemistry, Bhavan’s College, Munshi Nagar, Andheri (West), Mumbai 400058, India.
| Email: |  |
Copyright © 2012 Scientific & Academic Publishing. All Rights Reserved.
The present study deals with the assessment of toxic heavy metals in water of Vasai Creek of Mumbai. The study was carried for the assessment years 2009-10 and 2010-11 at four different sampling stations. The heavy metals studied were Al, As, Cd, Cr, Hg, Ni, Pb, Sr and Mn. It was observed that the concentration level of the various toxic heavy metals for the year 2010-11 was higher than that obtained during the year 2009-10 by a factor of 1.1 to 1.5 µg/L. The environmental impact of these toxic heavy metals is discussed. The results of the present investigation point out the need to implement adequate environmental control and management programmes so as to minimise the toxicity effects of the heavy metals on marine life.
Keywords: Heavy Metals, Toxicity, Marine Life, Environmental Impact, Quantification, Atomic Absorption Spectroscopy, Cold Vapour Technique, Vasai Creek, Mumbai, India
Article Outline
1. Introduction
- Land and water are precious natural resources on which rely the sustainability of agriculture and the civilization of mankind. Unfortunately, they have been subjected to maximum exploitation and severely degraded or polluted due to anthropogenic activities. The pollution includes point sources such as emission, effluents and solid discharge from industries, vehicle exhaustion and metals from smelting and mining, and nonpoint sources such as soluble salts (natural and artificial), use of insecticides/pesticides, disposal of industrial and municipal wastes in agriculture, and excessive use of fertilizers[1,2]. Each source of heavy metals contamination has its own damaging effects to plants, animals and ultimately to human health, but those sources that contaminates soils and waters are of serious concern due to the persistence of these heavy metals in the environment and carcinogenicity to human beings. These heavy metals cannot be destroyed biologically but are only transformed from one oxidation state or organic complex to another[3, 4]. The environmental parameters of waters effect toxicity of the metal either by influencing physiology of organisms or by altering chemical form of the metal in water. In general, metals are less toxic at lower temperatures and high salinity than at high temperatures and lower salinity. Toxicity of a metal is also dependent upon residence time of metals concerned. Generally, most metals have a long residence time and hence exert their toxic effect over a long time.The toxicity of heavy metals has long been concerned since it is very important to the health of people and ecology. With the growing interest in pollution of marine environment, many countries are conducting monitoring studies on metals in aquatic marine environment. Therefore, this heavy metal pollution possessing a potential threat to the environment and human health has become a national and international problem. Extensive work has been carried out recently all over the world on heavy metals in different rivers[5-7]. In Western Europe, 1,400,000 sites were affected by heavy metals[1], of which, over 300,000 were contaminated, and the estimated total number in Europe could be much larger, as pollution problems increasingly occurred in Central and Eastern European countries[8]. In India, use of heavy metal fungicides in agriculture is increasing as seed-dressing agents. Antifouling properties of mercury compounds are yet used in pulp mills, industrial and domestic sewage wastes from various sources are now a threat to the survival of fishes and other organisms. The common feature of these metals is that they are all relatively toxic even at fairly low concentrations and are readily concentrated by aquatic organisms , and plants. The seriousness of heavy metal contamination is further compounded by the fact that they are generally water soluble, non-degradable, vigorously oxidizing and are strongly bonded to many biochemicals inhibiting their functions. Today, additional quantities of heavy metals are being added to estuarine and coastal regions from agricultural and industrial waters, hospitals, domestic sewage and from the polluted atmosphere. At sufficiently high concentrations, heavy metals are toxic to marine and estuarine organisms and to their consumers at higher trophic levels including man.The preservation of aquatic resources for ecosystem and human health and well-being is a paramount concern worldwide and it has become evident that approaches to managing aquatic resources must be undertaken within the context of ecosystem dynamics in order that their exploitation for human uses remains sustainable[9]. If aquatic resources are not properly managed and aquatic ecosystems deteriorate, then human health and well-being may be compromised. Water quality monitoring for the detection of trends, impacts, and improvements is further complicated because the issues of concern and available resources are constantly changing[10]. Although it is not always possible to predict new and emerging threats to aquatic ecosystems, baseline water quality monitoring must be maintained to facilitate the early detection of such threats. The success of local, regional, and global efforts to curb rates of water quality degradation is only possible if sufficient monitoring data are available that enable the tracking of trends over time and space. The problem of environmental pollution due to heavy metals has begun to cause concern now in most of the major metropolitan cities in Maharashtra state and Mumbai is not an exception to it. The day by day increasing tremendous industrial pollution[11-20] has prompted us to carry the systematic and detail study of water pollution due to toxic heavy metals in Vasai Creek of Mumbai which is becoming highly polluted due to rapid urbanisation and industrialisation.
2. Materials and Methods
2.1. Area of Study
- Vasai Creek is an estuarine creek, one of the two main distributaries of the Ulhas Creek in Maharashtra state of western India. The Ulhas Creek splits at the northeast corner of Salsette Island into its two main distributaries, Vasai Creek and Thane Creek. Vasai Creek which lies between latitude 19.315°N longitude 72.875°E, forms the northern boundary of Salsette Island, and empties west into the Arabian Sea. The Creek receives domestic raw sewage as well as industrial waste water effluent from surrounding habitation and nearby industrial belt. The activities like cattle washing, cloth washing, and religious activities like immersion of idols of Lord Ganesha and Deity Durga during Ganesh festival and Navratri festival is also a major source of pollution of creek water.
2.2. Climatic Conditions
- Climate is subtropical, with mild winters and warm summers. The weather is typical coastal sultry and humid. The average rainfall of records from 1500 mm to 2000 mm. The place experiences the onset of the monsoon in the month of June and experiences monsoon till the end of September. The average temperature recorded in varies from 25 to 37 degrees.
2.3. Requirements
- The chemicals and reagent used for analysis were of analytical reagent grade. The procedure for calculating the different parameters were conducted in the laboratory. The laboratory apparatus were soaked in nitric acid before analysis and then rinsed thoroughly with tap water and de-ionised distilled water to ensure any traces of cleaning reagents were removed. Finally, it is dried and stored in a clean place. The pipettes and burette were rinsed with the same solution before final use.
2.4. Water Sampling and Sample Preparation
- The water samples were collected randomly four times in a month in morning, afternoon and evening session at four different sampling stations namely near Vasai Bunder (S-1) , Bhayandar west side of Railway Bridge (S-2), Bhayandar east side near RetiBundar (S-3), and Ghodbundar site (S-4) along the Vasai Creek (Figure 1). The samples were collected and subsequently analysed for a span of two years starting from October 2009 to September 2011. The sampling was done in three shifts i.e. morning shift between 07:00 a.m. to 09:00 a.m., afternoon shift between 02:00 p.m. to 04:00 p.m. and evening shift between 07:00 p.m. to 09:00 p.m. Polythene bottles of 2.5 L and 2.0 L were used to collect the grab water samples (number of samples collected, n = 19). The bottles were thoroughly cleaned with hydrochloric acid, washed with tape water to render free of acid, washed with distilled water twice, again rinsed with the water sample to be collected and then filled up the bottle with the sample leaving only a small air gap at the top. The sample bottles were stoppard and sealed with paraffin wax. Water samples (500 mL) were filtered using Whatman No. 41 (0.45 μm pore size) filter paper for estimation of dissolved metal content. Filtrate (500 mL) was preserved with 2 mL nitric acid to prevent the precipitation of metals. The samples were concentrated to tenfold on a water bath and subjected to nitric acid digestion using the microwave-assisted technique, setting pressure at 30 bars and power at 700 Watts[21,22]. About 400 mL of the sample was transformed into clean glass separating funnel in which 10 mL of 2% ammonium pyrrolidine dithiocarbamate, 4 mL of 0.5 M HCl and 10 mL of methyl isobutyl ketone (MIBK) are added[23]. The solution in separating funnel was shaken vigorously for 2 min and was left undisturbed for the phases to separate. The MIBK extract containing the desired metals was then diluted to give final volumes depending on the suspected level of the metals[24]. The sample solution was then aspirated into air acetylene flame in an atomic absorption spectrophotometer.
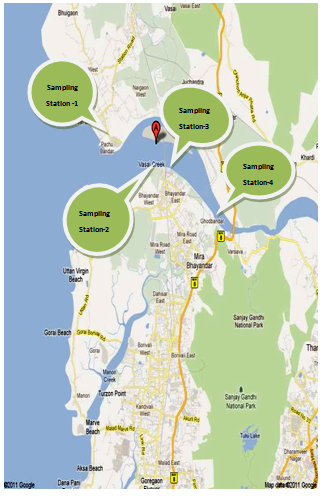 | Figure 1. Map Showing Sampling Stations along Vasai Creek of Mumbai |
2.5. Heavy Metal Analysis by AAS Technique
- The analysis for the majority of the trace metals like aluminum (Al), cadmium (Cd), chromium (Cr), nickel (Ni), lead (Pb), strontium (Sr) and manganese (Mn) was done by Perkin Elmer ASS-280 Flame Atomic Absorption Spectrophotometer. Arsenic (As) was determined by hydride generation coupled with an atomic fluorescence detector, while mercury (Hg) was analysed with a cold-vapour atomic adsorption spectrophotometer. The calibration curves were prepared separately for all the metals by running different concentrations of standard solutions. A reagent blank sample was taken throughout the method, analyzed and subtracted from the samples to correct for reagent impurities and other sources of errors from the environment. Average values of three replicates were taken for each determination.
2.6. Quality Control/Assurance
- Water samples were collected in polythene bottles that were free from heavy metals and organics and well covered while transporting from field to the laboratory to avoid contamination from the environment. All reagents were standardised against primary standards to determine their actual concentrations. All instruments used were calibrated before use. Tools and work surfaces were carefully cleaned for each sample during grinding to avoid cross contamination. Replicate samples were analysed to check precision of the analytical method and instrument. To validate the analytical procedures used, the spike recovery test was conducted on some samples for Al, As, Cd, Cr, Ni, Pb, Sr, Mn and Hg.
3. Results and Discussion
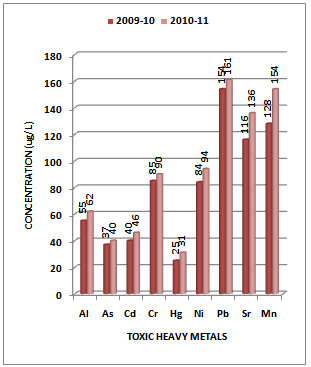
- Although there is no clear definition of what a heavy metal is, density is in most cases taken to be the defining factor. Heavy metals are thus generally defined as those having a specific density of more than 5 g/cm3. Heavy metals are among the most common environmental pollutants, and their occurrence in waters and biota indicate the presence of natural or anthropogenic sources. Although adverse health effects of heavy metals have been known for a long time, discharge of heavy metals continues and is even increasing in some areas, in particular in less developed countries. The main threats to human health from heavy metals are associated with exposure to lead, cadmium, mercury and arsenic (arsenic is a metalloid, but is usually classified as a heavy metal). Their accumulation and distribution in soil and aquatic environment are increasing at an alarming rate thereby affecting marine life[25-27].The experimental data on concentration (µg/L) of toxic heavy metals like Al, As, Cd, Cr, Hg, Ni, Pb, Sr and Mn in the water samples collected along sampling stations S1, S2, S3 and S4 of Vasai Creek is presented in Table 1. The trend in average concentration of these metals at different sampling stations for the assessment years 2009-10 and 2010-11 is graphically represented in Figures 2-5.
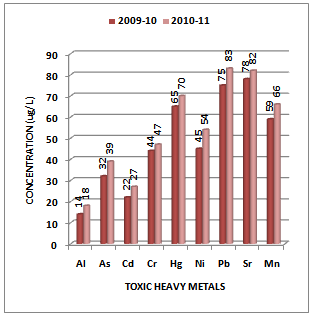 | Figure 2. Variation in average concentration values of different toxic heavy metals in water samples collected at S-1 sampling station of Vasai Creek during the assessment year 2009-10 and 2010-11 |
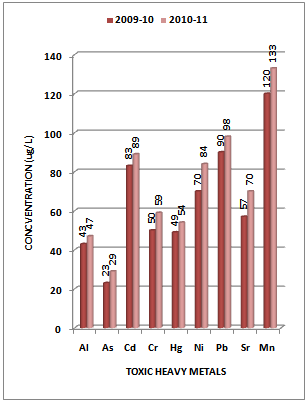 | Figure 3. Variation in average concentration values of different toxic heavy metals in water samples collected at S-2 sampling station of Vasai Creek during the assessment year 2009-10 and 2010-11 |
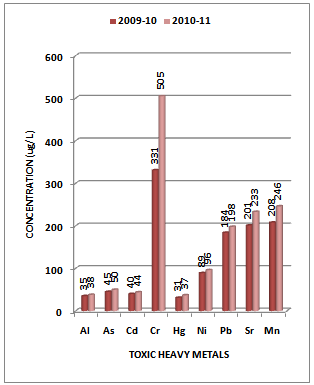 | Figure 4. Variation in average concentration values of different toxic heavy metals in water samples collected at S-3 sampling station of Vasai Creek during the assessment year 2009-10 and 2010-11 |
 | Figure 5. Variation in average concentration values of different toxic heavy metals in water samples collected at S-4 sampling station of Vasai Creek during the assessment year 2009-10 and 2010-11 |
| ||||||||||||||||||||||||||||||||||||||||||||||||||||||||||||||||||||||||||||||||||||||||||||||||||||||||||||||||||||||||||||||||||||||||||||||||||||||||||||||||||||||||||||||||||||||||||||||||||||||||||||||||||||||||||||||||||||||||||||||||||||||||||||||||||||||||||||||||||||||||||||||||||||||||||||||||||||||||||||||||||||||||||||||||||||||||||||||||||||||||||||||||||||||||||||||||||||||||||
| ||||||||||||||||||||||||||||||||||||||||||||||||||||||||||||||||||||||||||||||||||||||||||||||||||||||||||||||||||||||||||||||||||||||||||||||||||||||||||||||||||||||||||||||||||||||||||||||||||||||||||||||||||||||||||||||||||||||||||||||||||||||||||||||||||||||||||||||||||||||||||||||||||||||||||||||||||||||||||||||||||||||||||||||||||||||||||||||||||||||||||||||||||||||||||||||||||||||||||
4. Conclusions
- The real problem today is not whether heavy metals are toxic or not , since we know that they are : but what concentrations are permissible/safe levels in our waters which do not produce harmful effects on users of water and biological life from the waters. Although much work has been done on heavy metal pollutants , there is still a great need for information on influences of metals and their toxicities fully. It is impossible to prevent pollution of environment totally, but metal pollution and toxicity could be minimized by certain precautionary measures like development of adequate environmental control and management programmes and continuous scientific monitoring of our aquatic environment must be built up. It is expected that the experimental data obtained on pollution level from such continuous monitoring will help to reduce pollution threat to aquatic environment.
ACKNOWLEDGEMENTS
- The authors are thankful to SAP Productions for developing and maintaining the paper template.
References
| [1] | McGrath, S.P., Zhao, F.J., and Lombi, E., 2001, Plant and rhizosphere process involved in phytoremediation of metal-contaminated soils, Plant Soil, 232(1/2):207–214. |
| [2] | Schalscha, E., and Ahumada, I., 1998, Heavy metals in rivers and soils of central chile, Water Sci. Technol., 37(8):251–255. |
| [3] | Garbisu, C., and Alkorta, I., 2001, Phytoextraction: A cost effective plant-based technology for the removal of metals from the environment. Biores Technol., 77(3):229–236. |
| [4] | Gisbert, C., Ros, R., De Haro, A., Walker, D.J., Pilar Bernal, M., Serrano, R., Avino, J.N., 2003, A plant genetically modified that accumulates Pb is especially promising for phytoremediation, Biochem. Biophys. Res. Commun., 303(2):440–445. |
| [5] | Wakida, F.T., Lara-Ruiz, D., Temores-Pena, J., Rodriguez-Ventura, J.G. Diaz, C., and Garcia-Flores, E., 2008, Heavy metals in sediments of the Tecate River, Environ. Geol., 54(3), 637-642. |
| [6] | Li, F., Wen, Y.M., and Zhu, P.T., 2008, Bioavailability and Toxicity of Heavy Metals in a Heavily Polluted River, in PRD, China, Bulletin of Environmental Contamination and Toxicology,81(1), 90-94. |
| [7] | Mendiguchia, C., Moreno, C., Garcia-Vargas, M., 2007, Evaluation of natural and anthropogenic influences on the Guadalquivir River (Spain) by dissolved heavy metals and nutrients, Chemosphere, 69(10), 1509-1517. |
| [8] | Gade, L.H., 2000, Highly polar metal—Metal bonds in “early-late” heterodimetallic complexes, Angewandte Chemie-International Edition., 39(15):2658–2678. |
| [9] | Nakamura, K., Tockner, K., and Amano, K. 2006, River and wetland restoration: lessons from Japan, Bioscience, 56(5), 419-429. |
| [10] | Hirsch, R.M., Hamilton, P.A., and Miller, T.L., 2006, U.S. Geological Survey perspective on water-quality monitoring and assessment. Journal of Environmental Monitoring 8(5), 512-518. |
| [11] | Modak, D.M., Singh, K.P., Ahmed, S., and Ray, P.K., 1990, Trace metal ion in Ganga water system, Chemosphere, 21 (1-2):275–87. |
| [12] | Rajaram, T., and Das, A., 2008, Water pollution by industrial effluents in India: discharge scenarios and case for participatory ecosystem specific local regulation, Futures, 40(1):56–69. |
| [13] | Lokhande, R.S., Singare, P.U., and Pimple, D.S., 2011, Toxicity Study of Heavy Metals Pollutants in Waste Water Effluent Samples Collected From Taloja Industrial Estate of Mumbai, India, Resources and Environment, 1(1): 13-19. |
| [14] | Lokhande, R.S., Singare, P.U., and Pimple, D.S., 2011, Quantification Study of Toxic Heavy Metals Pollutants in Sediment Samples Collected from Kasardi River Flowing along the Taloja Industrial Area of Mumbai, India, The New York Science Journal, 4(9), 66-71. |
| [15] | Singare, P.U., 2011, Distribution Behaviour of Trace and Toxic Metals in Soil and Sediment along the Thane Creek Near Mumbai, India, Interdisciplinary Environmental Review, 12(4), 298–312. |
| [16] | Singare, P.U., Lokhande, R.S., and Bhanage, S.V., 2011, Study of water pollution due to Heavy metals in Kukshet lakes of Nerul, Navi Mumbai, India, International Journal of Global Environmental Issues, 11(1), 79–90. |
| [17] | Singare, P.U., Lokhande, R.S., and Jagtap, A.G., 2011, Water pollution by discharge effluents from Gove Industrial Area of Maharashtra, India: Dispersion of heavy metals and their Toxic effects, International Journal of Global Environmental Issues, 11(1), 28–36. |
| [18] | Singare, P.U., Lokhande, R.S., and Pathak, P.P., 2010, Study on Physico-Chemical properties and Heavy Metal Content of the Soil Samples from Thane Creek of Maharashtra, India, Interdisciplinary Environmental Review, 11(01), 38-56. |
| [19] | Singare, P.U., Lokhande, R.S., and Naik, K.U., 2010, A Case Study of Some Lakes Located at and Around Thane City of Maharashtra, India, with Special Reference to Physico-Chemical Properties and Heavy Metal content of Lake Water, Interdisciplinary Environmental Review, 11(01), 90-107. |
| [20] | Singare, P.U., Lokhande, R.S., and Bhattacharjee, S.S., 2013, Analysis of the Heavy metal Pollutants in Sediment Samples collected from Thane Creek of Maharashtra, India, International Journal of Sustainable Society, 5(3), 296-308. |
| [21] | Clesceri, L.S., 1998, Standard methods for the examination of Water and waste water, in Arnold, E., Greenbergy, Eaton, A.D., (Eds.): Collection and Preservation of Samples and Metals, pp.1–27, pp.1–35, pp.3–1, pp.3–21, APHA, AWWA, WEF, Washington DC. |
| [22] | Paar, A. 1998, ‘Microwave Sample Preparation System’ –Instruction Handbook, p.128, Anton Paar GmbH, Austria. |
| [23] | Sachdev, S.L., and West, P.W., 1970, Concentration of trace metals by solvent extraction and their determination by atomic absorption spectrophotometer, Environmental Science and Technology, 4(9), 749–751. |
| [24] | Chen, M., and Ma, L.Q., 2001, Comparison of three aqua regia digestion methods for twenty florida soils, Soil Science Society of American Journal, 65(2), 491–499. |
| [25] | Koukal, B., Dominik, J., Vignati, D., Arpagaus, P., Santiago, S., Ouddane, B., and Benaabidate, L., 2004, Assessment of water quality and toxicity of polluted rivers Fez and Sebou in the region of Fez (Morocco), Environ. Poll., 131 (1), 163-172. |
| [26] | Mohiuddin, K. M., Zakir, H. M., Otomo, K., Sharmin, S., and Shikazono, N., 2010, Geochemical distribution of trace metal pollutants in water and sediments of downstream of an urban river, Int. J. Environ. Sci. Tech., 7 (1), 17-28. |
| [27] | Okafor, E. C., Opuene, K., 2007, Preliminary assessment of trace metals and polycyclic aromatic hydro carbons in the sediments, Int. J. Environ. Sci. Tech., 4 (2) 233 – 240. |
| [28] | McCahon, C.P., Pascoe D., 1989, Short-term experimental acidification of a Welsh stream: toxicity of different forms of aluminum at low pH to fish and invertebrates, Arch. Environ. Contam. Toxicol., 18(1-2):233-42. |
| [29] | Exley, C., Chappell, J.S., and Birchall, J.D., 1991, A mechanism for acute aluminum toxicity in fish, J. Theor. Biol., 151(3):417-28. |
| [30] | Verbost, P.M., Lafeber, F.P., and Spanings, F.A., Aarden, E.M., and Wendelaar Bonga, S.E., 1992, Inhibition of Ca2+ uptake in freshwater carp, Cyprinus carpio, during short-term exposure to aluminum, J. Exp. Zool., 262(3):247-54. |
| [31] | Edmonds, J.S., and Francesconi, K.A., 1993, Arsenic in sea foods: human health aspect and regulations. Marine Pollut., 26(12), 665-674. |
| [32] | Pacyna, J.M., Scholtz, M.T., and Li, Y.F., 1995, Global budgets of trace metal sources. Environ. Rev., 3(2), 145-159. |
| [33] | Gosh, D., Datta, S., Bhattacharya, S. and Mazumder, S., 2007, Long-term exposure to arsenic affects head kidney and impairs humral immune responses of Clarias batrachus, Aquat. Toxicol., 81(1), 79-89. |
| [34] | Gosh, D., Datta, S., Bhattacharya, S., and Mazumder, S., 2006, Perturbation in the catfish immune responses by arsenic: organ and cell specific effects. Comp. Biochem. Physiol., 143C: 455-463. |
| [35] | Liu, S.X., Athar, M., Lippai, I., Waldren, C., and Hei, T.K., 2001, Introduction of oxyradicals by arsenic, implication for mechanism of genotoxicity. Proc. Nat. Acad. Sci. USA, 98(4), 1643-1648. |
| [36] | Datta, S., Saha, D.R., Gosh, D., Majumdar, T., Bhattacharya, S., and Mazumder, S., 2007, Sub-lethal concentration of arsenic interferes with the proliferation of hepatocytes and induces in vivo apoptosis in Clarias batrachus L., Comp. Biochem. Physiol. Part C, 145(3), 339-349. |
| [37] | Sethi, P.K., Khandelwal, D.J., and Sethi, N., 2006, Cadmium exposure: Health hazards of silver cottage industry in developing countries, J. Med. Toxicol., 2(1), 14-15. |
| [38] | Johri, N., Jacquillet, G., and Unwin, R., 2010, Heavy metal poisoning: the effects of cadmium on the kidney, BioMetals, 23(5), pp. 783-792. |
| [39] | Nordberg, G., Nogawa, K., Nordberg, M., and Friberg, L., 2007, Cadmium. In: Handbook on toxicology of metals. Nordberg, G., Fowler, B., Nordberg, M., Friberg, L. editors New York: Academic Press, p. 65-78. |
| [40] | Bernard, A., 2004, Renal dysfunction induced by cadmium: biomarkers of critical effects, Biometals, 17(5), 519-523. |
| [41] | Godt, J., Scheidig, F., Siestrup, C.G., Esche, V., Brandenburg, P., Reich, A., Groneberg, D.A., 2006, The toxicity of cadmium and resulting hazards for human health. J. Occup. Med. Toxicol., 1, 22. |
| [42] | Geller, R., 2001, "Chromium." In:Clinical Environmental Health and Toxic Exposures. Sullivan, J.B., Jr. and Krieger, G.R., editors. 2nd Ed. Lippincott Williams & Wilkins, Philadelphia, PA. |
| [43] | Meditext - Medical Management, 2005, "Chromium Hexavalent Salts." TOMES Information System. Denver, CO: Micromedex, Inc. |
| [44] | Rom, W. N., 2007, Environmental and Occupational Medicine. 4th Ed. by Lippincott Williams & Wilkins. |
| [45] | Favretto, L., Campisi, B., Reisenhofer, E., and Adami, G., 1997, Sewage pollution, Anal. Chim. Acta, 344(3), 251–259. |
| [46] | Bodaly, R. A., Rudd, W. M., and Flett, R. J., 1998, Effect of urban sewage treatment on total and methyl mercury concentrations in effluents, Biogeochemistry, 40(2-3), 279–291. |
| [47] | Tanaka, K., 1977, Photochemical alkylation of inorganic mercury in sewage treatment plant waste waters, Kanagawa-ken Kogai Senta Nenpo 10(1), 198–201. |
| [48] | Goldstone, M. E., Atkinson, C., Kirk, P. W.W., and Lester, J. N., 1990, The behaviour of heavy metals during waste water treatment, Science of the Total Environment, 95(1), 271–294. |
| [49] | Klaassen, C.D., 1996, Casarett and Doull’s Toxicology, The Basic science of poisons, 5th ed.; International Edition, pp. 712-714, 1996. |
| [50] | Barceloux, D.G., 1999, Nickel, Clin. Toxicol. 37(2), 239-258. |
| [51] | Uthus, E.O., and Poellot, R.A., 1996, Dietary folate affects the response of rats to nickel deprivation, Biol. Trace Elem. Res., 52(1), 23-35. |
| [52] | Scott-Fordsmand, J.J., 1997, Toxicity of nickel to soil organisms in Denmark, Rev. Environ. Contam. Toxicol., 148(1), 1-34. |
| [53] | Haber, L.T., Erdreicht, L., Diamond, G.L., Maier, A.M., Ratney, R., Zhao, Q., and Dourson, M.l., 2000, Hazard identification and dose response of inhaled nickel-soluble salts, Regul. Toxicol. Pharmacol. 31(2), 210-230. |
| [54] | Diagomanolin, V., Farhang, M., Ghazi-Khansari, M., and Jafarzadeh, N., 2004, Heavy metals (Ni, Cr, Cu) in the Karoon waterway river, Iran, Toxicol. Lett., 151 (1), 63. |
| [55] | Sunderman, F.W.,JR., Hopfer, S.M., Plowman, M.C., and Knight, J.A., Carcinogenesis bioassays of nickel oxides and nickel-copper oxides by intramuscular administration to Fischer-344 rats, Res. Commun. Chem. Pathol. Pharmacol., 70 (1), 103, 1990. |
| [56] | EPA. 1985. Ambient water quality criteria for lead - 1984. U.S. Environ. Protection Agency Rep. 440/5-84-027. pp.81 Available from Natl. Tech. Infor. Serv., 5285 Port Royal Road, Springfield, Virginia 22161. |
| [57] | Feierabend, J.S., and Russell, A.B., (eds.), 1986, Lead poisoning in wild waterfowl - a workshop. National Wildlife Federation, 1412 Sixteenth St. NW, Washington, D.C. pp.139. |
| [58] | FWS. 1986. Use of lead shot for hunting migratory birds in the United States. Final supplemental environmental impact statement. pp.535 Available from U.S. Fish Wildlife Service, Office of Migratory Bird Management, Washington, D.C. 20240. |
| [59] | Lansdown, R., and W. Yule (eds.). 1986, Lead toxicity. History and environmental impact, Johns Hopkins Univ. Press, Baltimore, Maryland. pp.286. |
| [60] | McDonald, L.J., 1986, Suspected lead poisoning in an Amazon Parrot, Can. Vet. J., 27(3), 131-134. |
| [61] | Sanderson, G.C., and Bellrose, F.C., 1986, A review of the problem of lead poisoning in Waterfowl, Illinois Natural History Survey, Spec. Publ. (SP-04). 1-34. |
| [62] | Griffin, A.E., 1960, Significance and removal of manganese in water supplies. J. Am. Water Works Assoc., 52(10), 1326-1334. |
| [63] | Bean, E.L., 1974, Potable water-quality goals, J. Am. Water Works Assoc., 66(4), 221-230. |
| [64] | Wolfe, R.S., 1960, Microbial concentration of Iron and Manganese in Water with Low Concentrations of These Elements, J. Am. Water Works Assoc., 52(10), 1335-1337. |