Margarete Donovang-Kuhlisch 1, Mike Small 2
1IBM Deutschland GmbH, Gorch-Fock-Str. 4, 53229 Bonn, Germany
2IBM UK Ltd., Meudon Ave, Farnborough Hants GU14 7NB, UK
Correspondence to: Margarete Donovang-Kuhlisch , IBM Deutschland GmbH, Gorch-Fock-Str. 4, 53229 Bonn, Germany.
| Email: |  |
Copyright © 2012 Scientific & Academic Publishing. All Rights Reserved.
Abstract
Collective endeavours, operating in an environment of efficient collaboration and informed decision making in a value network, bear the only effective way to meet the challenges and threats we face in this modern, interconnected world. Enhanced inter-agency and inter-company communication and collaboration has been defined as the capability to deliver information superiority when required to enable agile and informed decision making to underpin effects-based operations: delivering the right effect, at the right time, to achieve the outcome required. Challenges and threats in our modern world are global and multi-faceted requiring complex responses: governments and corporations buoyed by the realization that the interests of both are mutually engage, are pursuing joint corporate social responsibility to make life and business conduct safe and sustainable. One outcome is increasing openness: organisations increasingly publish data and knowledge in open formats and open spaces and(others) provide tools to gain insight from this open and accessible data. This case study summarizes the technological state-of-the-art and points the way how value networks can benefit from these digital society trends.
Keywords:
Linked Open Data, Visual Analytics, Corporate Social Responsibility, Smarter Planet
1. The Problem Space
Collective endeavours(to achieve a specific goal or end-state) require the interaction and coherent cooperation between governmental, non-governmental and commercial organizations. Coherency relies on the continuous and real-time sharing of situational awareness between all participants in the value network. As we move forward into the decade of the “smarter planet”, increasingly instrumented, interconnected and intelligent, data volumes which underpin decision making will double every two years. A large percentage of that data already is accessible freely in the internet e.g. in social networks. The ICT challenge is three-folded: how can relevant data be found, how can it be assured and what insight can be gained?
2. Linked Open Data
Within the semantic web, data is identified and accessed via Uniform Resource Identifiers(URI). Coding, referencing and linkage between data resources can(and should) be done using the Resource Descriptor Framework(RDF, [1]). Linked Open Data(LOD) is defined as the “cloud” of freely accessible data defined and linked via these open standards. Figure 1 depicts one initiative to populate this knowledge base in a W3C community project([2]) and shows the current topology of the included network of open datasets.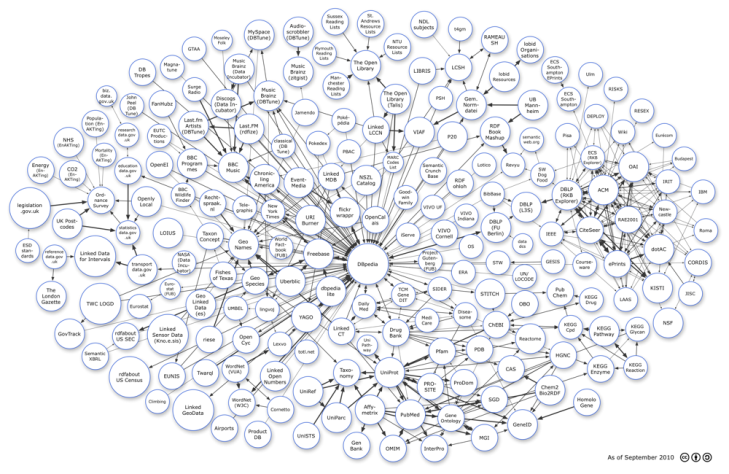 | Figure 1. Linked Open Data – W3C datasets |
2.1. Open Government Data
Open Government Data([3]) is the LOD subset made available by governmental institutions for free and for potentially even commercial use – in and via the internet. Openness in public sector comes in different flavours:Machine readability and technical accessibility: even open standards like “pdf” or “html” are often difficult to interpret. Publishing textual data in descriptive formats like “csv” (comma separated values) or providing application programming interfaces(APIs) to original data sources are preferable options.Free access enables evaluation and experimentation with data and helps to create more and more datasets within LOD.Reuse permitting licensing: open data that is commercially exploited i.e. that is used in chargeable applications or web services offered by third parties can be billed by the original publisher.Discovery: data creation and maintenance(by the owner and publisher) and data consumption(by the public) should be decoupled. Publishing data in a “public data catalogue” using open standards such as Web Service Description Language(WSDL) and Universal Description, Discovery and Invocation(UDDI) are good best practices to ensure data quality and improve the retrieval success of “open data as a service”.Semantics and Linkage: ontologies within and between the open datasets complete the growing knowledge base.
2.2. Open Data Policy
The “Re-Use of Public Sector Information(PSI) Directive”, 2003/98/EC([4]), encourages and strives for extensive publication and opening of open government data – and therefore also recommends a fundamental change of paradigm and policy from the “need-to-know” to the “need-to-share” principle fundamental for network enabled capabilities(NEC) and successful engagements in collective endeavours:Publicity:Old: everything is classified if not explicitly marked publicNew: everything is public by default.Scope:Old: the creator can decide the amount and date of his data to be publishedNew: all data that does not carry security or privacy tags is proactively published.Usage rights: Old: published data is for private information onlyNew: published data can be exploited for any purpose. This includes the analysis and further dissemination of data and derived insight.
3. Corporate Social Responsibility
The Digital Agenda Europe([5]) sets the policy and implementation targets for a unified digital society and an integrated single market within and beyond the member states of the European Union. The European Commission in particular promotes the adoption of Open Data and the realization of the intelligent future internet(FI) of people, things and services(IoPTS). As these political mandates are not specific to Europe and the European Union, the recent IBM Corporate Responsibility Report([6]) acknowledges that more and more the concept of corporate citizenship is realized as an opportunity to create business value:“Organizations today are embracing a more sustainable approach to business – one that takes into account the environmental and societal impact of their activities. By factoring this accountability into their strategy, they implement new ways to source, manufacture and distribute goods in a more sustainable manner, often while simultaneously lowering costs. And, based on more transparent and proactive engagement with employees, consumers and the communities where they operate, organizations are becoming better equipped to create products and services for a smarter planet”.Figure 2 shows a few examples of critical infrastructure domains and their sustainability challenges.Each of these scenarios is truly multi-disciplinary: characterized by facts, measurements and events from different domains. For example, weather, resource availability, human factors and socio-economic behaviour of populations all influence the ecosystems.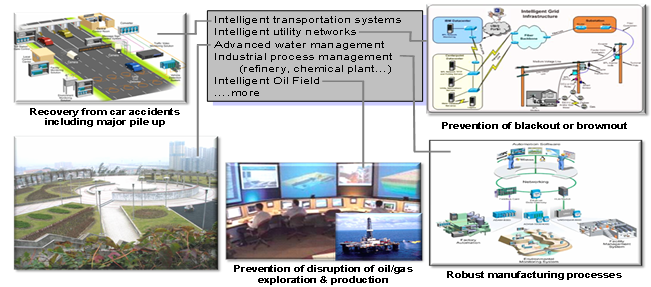 | Figure 2. Sustainability on a Smarter Planet |
 | Figure 3. IBM Cloud-Based distributed Science Research |
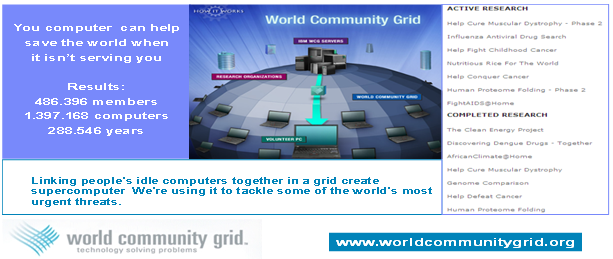
Through the Smarter Planet Initiative, IBM is driving solutions to deliver the social and economic benefits of our ability to exploit information and is already witnessing the convergence of business strategy and citizenship strategy. The issues being addressed as a result, and shown in Figure 2, range from clean water, to safe food, to sustainable and vibrant cities, to smarter work and to empowered communities. These are not a choice of either strategy driving the other; it is the alignment of both. This alignment of citizen and business strategies, is not only a recipe for economic growth, it also enables expanded economic and societal opportunity. Figure 3 depicts the natural and medical science research programs supported by IBM global research programme, which maps the human genome supported by unused computer capacity around the world captured with advanced virtualization and load balancing technologies.But of course, building sustainable ecosystems and protecting and maintaining the interdependent critical infrastructure networks requires enhanced capabilities to detect events, to monitor behaviour, to gather and interpret data and to share, aggregate and fuse the information pieces into actionable intelligence.
4. IBM City Forward
City Forward, launched on December 13th, 2010([7]), is a donation to cities’ and city subsystems’ stakeholders. It is a one-stop shop for elected and appointed officials and citizens of cities for ongoing analysis of city information and the city’s current state. It encompasses an aggregation of global best practices and provides the kind of community knowledge repository which can be further populated by using LOD as raw data input.City Forward is a tool for helping cities or city-like entities such as an airport, become smarter; it provides:Predictive modelling and simulation and decision support for future policyComparison to an ideal smarter city(model)Exploration and visualization tools that allow subject matter experts from academia, government and industry to illustrate ideas and trends and encourage discussions of their validity and potential impactIllustration of a city’s journey via historical snapshots of its dataBest practices information and lessons learned from other geographiesSocial media and collaboration tools to engage citizens in city decision-makingInterrelated and integrated information from sources ranging from real-time social sensors to decennial censuses providing ad hoc situational awareness and a foundation for new insights.The City Forward rationale is to provide tools to create a consolidated source of information to enable city, state, regional or national leaders to collaborate with citizens in priority setting to make their cities smarter. Participation and inclusion of citizens in policy setting is considered not only to be a way of becoming more efficient and effective in a municipality, but also make the city a safer place to live in. Whereas IBM commercial offerings typically focus on operational, tactical analysis, City Forward focuses on analytics and correlation at a high(strategic) level. Potential benefits include:City agencies can cooperate and integrate between themselves and with their citizensCross-views of city subsystems and understanding of interdependencies can be achievedCurrent state analysis across all subsystemsDecision support tools enable cities to assess what is needed to become smarterInvolvement of citizens in priority-setting and policy-makingLearning from other cities’ success storiesPromotion of data transparency and public engagementNew and unexpected insights by using powerful interactive visualization toolsInsight gleaned from analyzing the data can force us to rethink the physical, commercial and governance structures that orchestrate life in citiesOpportunity for “network empowered governance”Ability to simulate scenarios for smarter planningDevelopment of a roadmap towards a smarter cityCollection of useful insight for future decision makingBetter use of scarce resources in tough economic conditionsEncouragement of transparency and accountability of open governmentAccess to newly published datasets(e.g. LOD) and data sourcesValidation of other sources of data.City Forward can be considered a cloud-based showcase for the IBM premier analytics software capabilities as illustrated in Figure 4.Examples for city subsystems are:Government servicesHealthcareTrafficEnergy and utilitiesEducationPublic safetyThis leads to the initial set of data categories shown in Figure 5.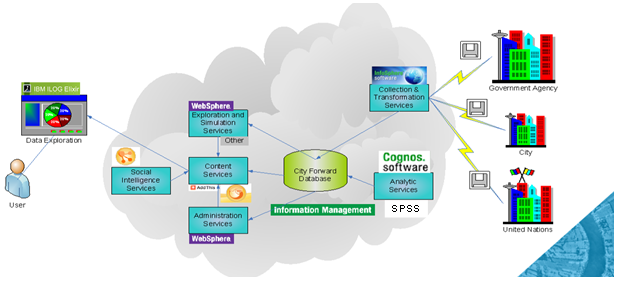 | Figure 4. IBM City Forward Architecture |
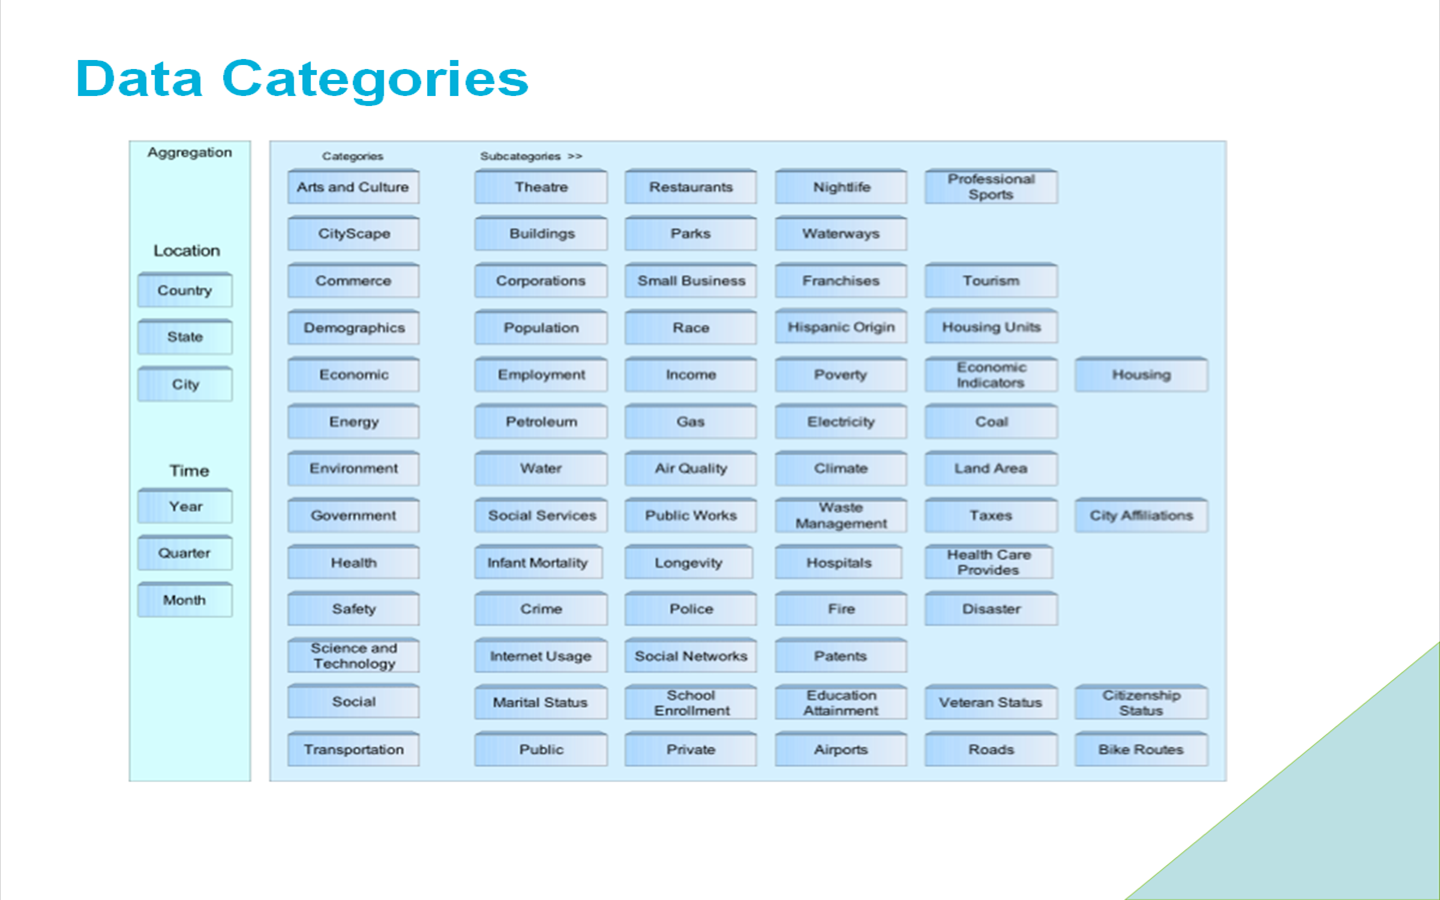 | Figure 5. IBM City Forward Data Categories |
Why is this important? The current explorations listed below speak for themselves – they are the same questions that every government organization is struggling to answer:New York City graduation rates and education costs on the riseAre toll increases reducing traffic congestionNew York bridge and tunnel traffic patternsRecession hits cities in different ways – a look at Baltimore, Chicago, Detroit and PhoenixWill the USA avoid the stagnation of Japan’s lost decadeFood costs and spending behaviour in different citiesWater usage patterns in Chicago counties.
5. Behaviour and Business Analytics Solutions
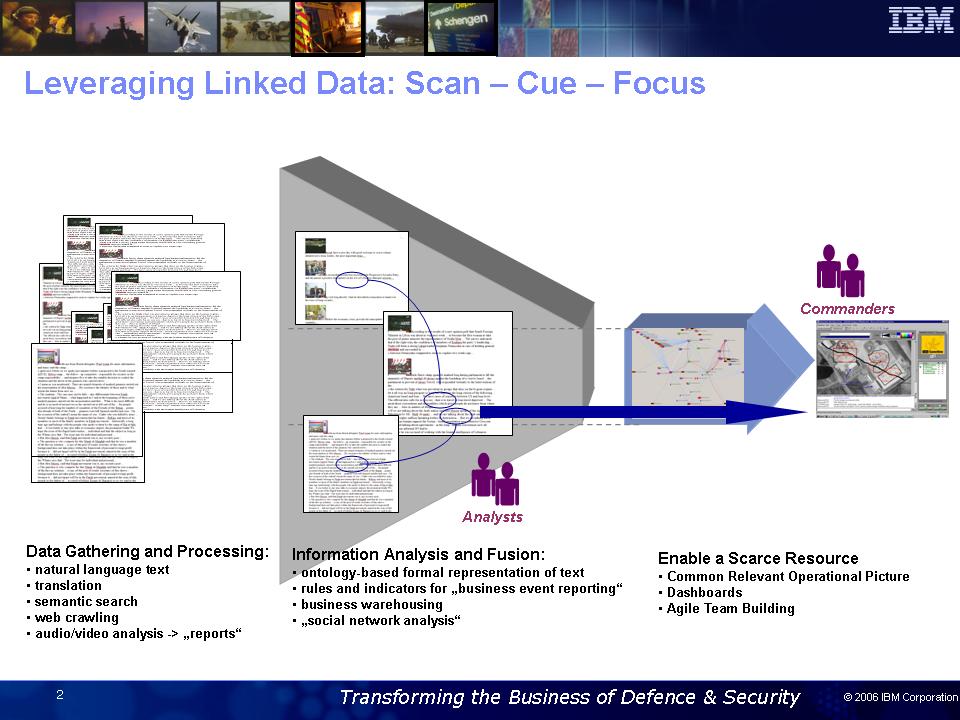
Open platforms like City Forward can only prepare the ground for decision support including human factors and social behaviour analysis – a domain in collective endeavours where communication and collaboration in the value network at hand is most needed.The City Forward knowledge base functions as sensors complementary to corporate business intelligence platforms and contributes to the intelligence aggregation, correlation and fusion process which provides real-time situational awareness in a competitive situation; Figure 6 illustrates the end-to-end process to generate a low-latency operational picture for all parties in the value network – including the use of open data sources such as the internet to provide the decision makers with a complete situational awareness.Whereas Figure 6 depicts the process flow in which different data cleansing and analysis tools are applied, Figure 7 shows why tool like stream computing and recent advances in analytics which understand the importance of links and relationship in vast quantities of information can make such a difference to situational awareness.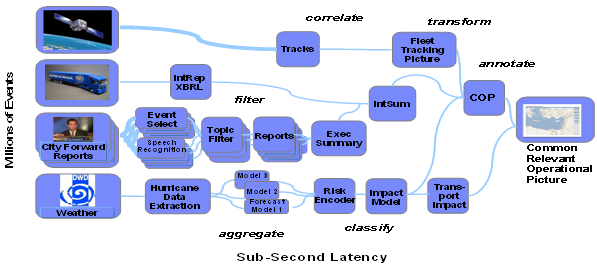 | Figure 6. Situational Awareness Creation using innovative Stream Computing([8]) |
 | Figure 7. Scan – Focus – Cue to enable a scarce Resource |
This methodology generates a bi-folded benefit: more data can be scanned and the data passed on to decision makers is more relevant. This effect cannot be achieved with only one step in the process; it takes the combination of all three:Scan digests vastly greater quantities of information(“raw data”) and such increases the “take”Cue creates and leverages Linked Open Data to ultimatelyenable Focus onto material relevant to commanders.Using the same technologies as in the City Forward cloud, IBM offers a variety of accelerated solutions across the whole value chain from data collection to status visualizations. Examples for intelligence solutions in(semi-) closed networks that can play an important part in collective decision making includeCrime Information Insight for Public Safety and Security: IBM offers a performance measurement solution for law enforcement and policing agencies aiming to gain more insight into their operations. It includes planning support, score-carding, dash-boarding and reporting to maximize effectiveness.Performance Management for Governments who are often data-rich but information-poor. Business analysis can help governments to establish a strategic view of what they want to achieve – independent of reactive or election-driven agenda. Moving towards open government, the envisioned transparency makes performance management critical and potentially provides the citizen clear information against which to measure the performance of their governments.Business Analytics for Smarter Cities: IBM solutions provide municipal government leaders with a data-driven, consistent and real-time framework for defining and achieving strategic goals. By tracking work groups, departmental, agency and government-wide performance against goals, intervening when necessary before an issue becomes critical and continuing to drive toward positive outcomes, city leaders can better manage in agile environments, improving service levels to citizens and enterprises, managing budgets and day-to-day operations while identifying and correcting undesirable and unexpected trends leading to improved outcomes. Crime Prevention and Prediction: many legacy crime information systems are incompatible, silo-like systems making pattern recognition a manual paper-based task. Coupled with tools to extract facts and relationship from unstructured information, IBM SPSS analytics solutions provide the capability to analyze crime data, understand events that trigger and enable crime and better predict upcoming criminal activity to facilitate effective deployment of personnel.
6. Visual Analytics of Spatiotemporal Data
Spatiotemporal data involve geographical space, time, various objects existing in space and multidimensional attributes changing over time, as depicted in Figure 8.This complexity poses significant challenges for analytics; however it also enables the use of the data for many purposes:To study the properties of space and placesTo understand the temporal dynamics of events and processesTo investigate the behaviour of people and objects.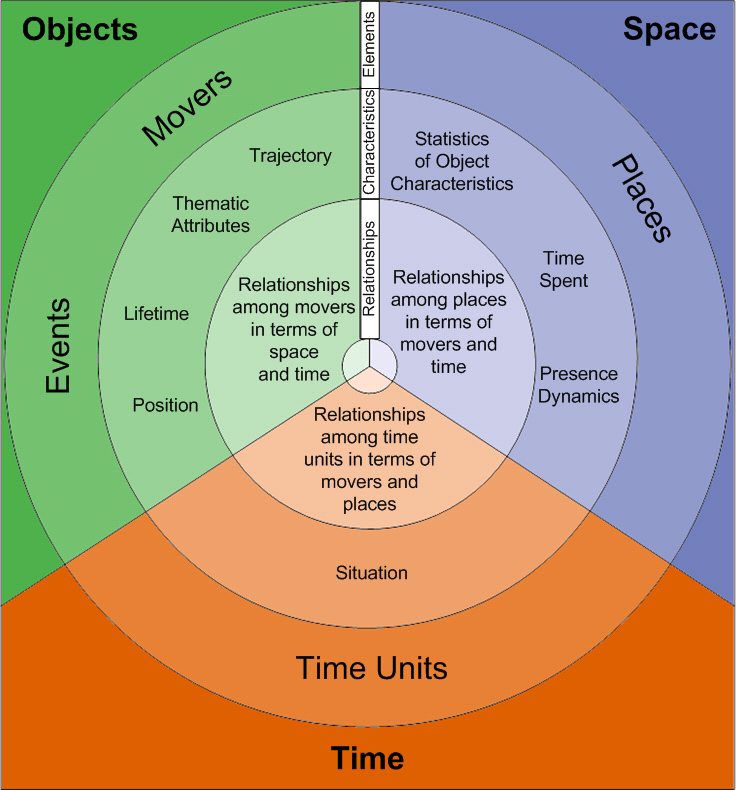 | Figure 8. Dimensions of Spatiotemporal Data |
 | Figure 9. Spatiotemporal Event Analysis |
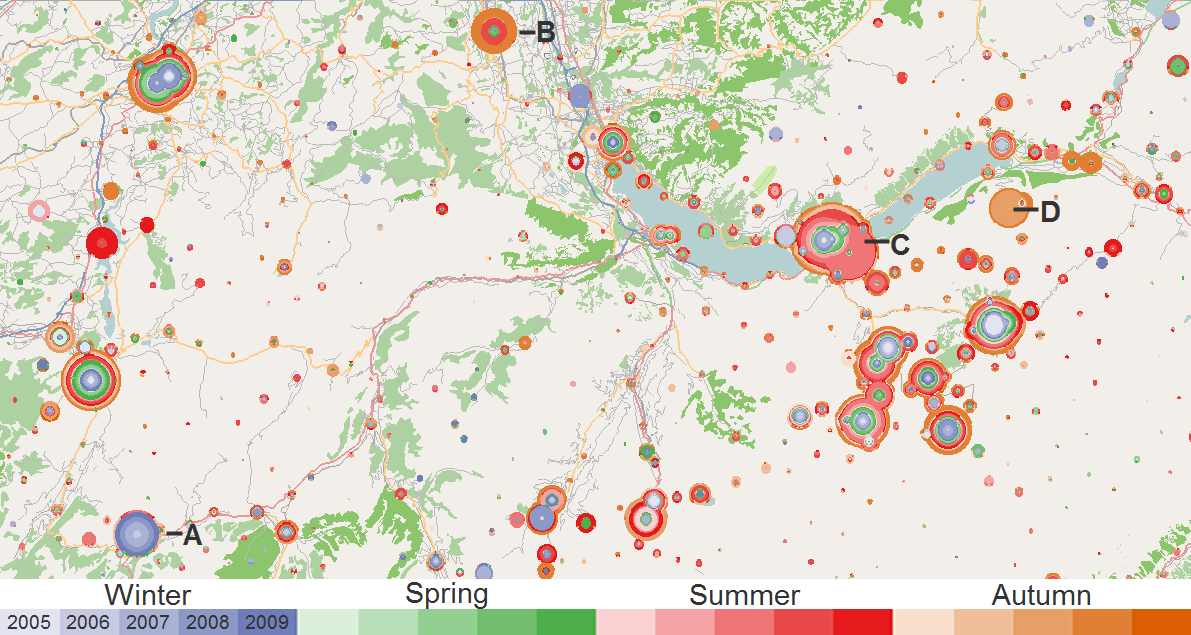
Visual Analytics([9]) is the science of extracting information from large, homogenous, multi-modal data sources. It relies on the smart combination of automatic algorithms and interactive visualization. The objective of IBM research is to develop a web-based platform that enables people to access, explore and analyze information in a visual and intuitive manner:● Consumption and integration of the relevant(LOD) datasets, possibly requiring data curation, semantic mapping and reconciliation● Interactive visualization capabilities of time-variance and geospatial attributes of the datasets● Consumable representation of the underlying data and its complexity; an example is given in Figure 9.This example illustrates the volume of tourist pictures being taken in the Zurich, Switzerland, region and published in Facebook during the various seasons in five consecutive years. Potential business benefits include: Anticipating tourist numbers and planning for accommodation capacityUrban and rural development planningInfrastructure protection conceptualizationEvent planning to maximize impact.Figure 10 gives an overview of the framework bringing the technologies together in business intelligence applications.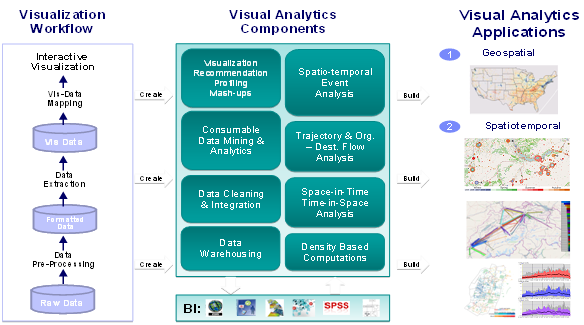 | Figure 10. Spatiotemporal Analysis Framework |
 | Figure 11. European Platform for Intelligent Cities |
7. Experimentation
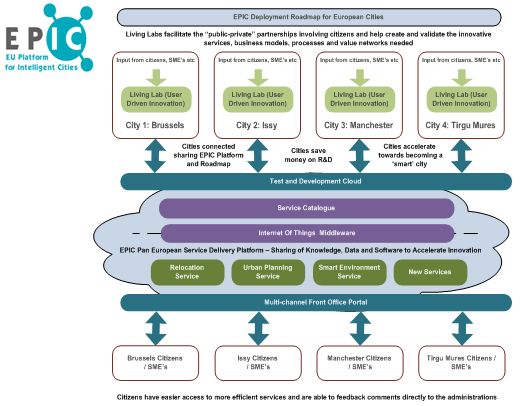
Within the Linked Open Data, Open Government and the Connected Smart Cities([10]) network, several laboratories and test beds are emerging. To facilitate such activities, IBM is offering the Smart Business Test and Development Cloud([11]) enabling distributed communities to share a common infrastructure to host development, test, validation and experimentation of capabilities in a production-like, secure and trust-worthy manner.One example for such experimentation are the smart cities projects funded by the European Commission([12]).EPIC was launched November 1st, 2010, and will build a sustainable cloud- and Government Industry Framework(GIF) enabled SOA foundation for information and web services to be shared and governed in a global environment. This platform could, and should, also be used for experimentation in the area of collective decision making in prototypical value networks and for the establishment of best practices for good governance.
8. Summary
In this paper, we have introduced the emerging concepts and technologies for Linked Open Data and Open Government which will become of increasingly greater importance for the effectiveness of collective endeavours. Intelligence in collective endeavours is a matter of controlled information fusion and sharing of data from a vast variety of sources from different security and trust domains – from open to highly classified. But computing has moved beyond filtering and aggregating information to deliver reports; we are now in an era where computing can make sense of linkages and relationships across data sources and open datasets and point decision makers to relevant information.In a globally-integrated world, corporate social responsibility becomes a major factor for common business growth and prosperity. IBM is taking a leadership role with a comprehensive Smarter Planet initiative.Whereas information and communication technologies are mature, policy and rules for information and capability sharing need to be established for the different mandates of collective endeavours. A test bed for experimentation could, and should be provided to enable “public-private-partnerships” to exploit information better. The benefits are potentially a leap forward in democracies ability to deliver good, open government while securing public safety.
References
| [1] | http://www.w3.org/RDF/, last access: January 2011 |
| [2] | http://esw.w3.org/SweoIG/TaskForces/CommunityProjects/LinkingOpenData, last access: January 2011 |
| [3] | http://opengovernmentdata.org/, last access: January 2011 |
| [4] | PSI-Directive, last access: January 2011 |
| [5] | http://ec.europa.eu/information_society/digital-agenda/index_en.htm, last access: January 2011 |
| [6] | IBM Corporate Responsibility Report, 2009 |
| [7] | http://www.youtube.com/watch?v=DeZ6Sgu2Pu8&feature=youtu.be, last access: January 2011 |
| [8] | http://www-01.ibm.com/software/data/ infosphere/streams/, last access: March 2011 |
| [9] | http://domino.watson.ibm.com/comm/wwwr_seminar.nsf/pages/20100203_PeterBak.html, last access: April 2011 |
| [10] | http://events.forumvirium.fi/smartcities2010/, last access: January 2011 |
| [11] | http://www-935.ibm.com/services/us/igs/cloud-development/, last access: January 2011 |
| [12] | http://www.openlivinglabs.eu/news/eu-supported-smart-city-project-portfolio-future-internet-week-ghent, last access: January 2011 |


 Abstract
 Reference
 Full-Text PDF
 Full-Text HTML