Alile O. M.1, Ujuanbi O.2, Iyoha A.2
1Physics Department, Covenant University, Ota, Nigeria
2Department of Physics, Ambrose Alli University, Ekpoma
Correspondence to: Alile O. M., Physics Department, Covenant University, Ota, Nigeria.
| Email: |  |
Copyright © 2012 Scientific & Academic Publishing. All Rights Reserved.
Abstract
Geophysical survey involving the use of resistivity sounding method was recently carried out to investigate the geoelectrical layers of groundwater resources in Obaretin, Iyanomon and Orhionmwonbor, both in Ikpoba Okha Local Government Area of Edo State, Nigeria. Three vertical electrical sounding (VES) locations were visited in the study area, VES 12 in Obaretin, VES 28 in Iyanomon and VES 14 in Orhionmwonbor. The vertical electrical sounding was done using the Schlumberger electrode array configuration and the linear filter method of interpretation was adopted. A correlation of the interpreted curves with the lithologic log from the borehole sections in the study area suggests that the major lithologic layers penetrated are laterite, clay, sand (sandstone) and sandy clay from basic depth interval as shown by the geoelctric section. The sandstone layer which is the aquifer zone lies between the depth of 59.80m to 85.80m for VES 12, 63.16m to 89.36m in VES 28 and 69.36m to 95.37m for VES 14. Therefore, the depth to water table in the study area has a maximum drill depth within the range of 60m (199.8ft) to 100m (333ft).
Keywords:
Geoelectric, Investigation, Groundwater Resources, Ikpoba-Okha, Edo State
Cite this paper: Alile O. M., Ujuanbi O., Iyoha A., Geoelectrical Investigation of Groundwater Resources at Ikpoba Okha Local Government Area, Edo State, Nigeria, Science and Technology, Vol. 2 No. 1, 2012, pp. 41-46. doi: 10.5923/j.scit.20120201.08.
1. Introduction
The advent of technology has made the quest for water for all purpose in life to drift from ordinary search for surface water to prospecting for steady and reliable subsurface or ground water from boreholes. In Nigeria, presently, boreholes have rescued the citizenry from acute shortage of water.Groundwater is characterized by a certain number of parameters which are determined by geophysical methods such as electrical resistivity methods, seismic methods, magnetic methods, gravity methods etc. But for this research work, the application of electrical resistivity survey method was used. The most usual parameters are the porosity, the permeability, the transmissivity and the conductivity. Electrical resistivity method in geophysical exploration for groundwater in a sedimentary environment has proven reliable (1). Records show that the depths of aquifers differ from place to place because of variational geo-thermal and geo-structural occurrence. (2; 3).The geology of the study area reveals that the entire area is underlain by sedimentary rocks. These rocks are of ages between Paleocene to recent. The sedimentary rock contains about 90 percent of sandstone and shale intercalation. It is coarse grained locally fine grained in some areas, poorly sorted, sub- angular to well rounded and bears lignite streaks and wood fragment (4). The sedimentary rock of the study area constitutes the Benin formation. This has an important groundwater reservoir. Large quantity of water is obtained in a place like Benin City.This paper is centered on geoelectric investigation undertaken in Ikpoba-Okha, a type area of the Benin formation. The aim is to explore the groundwater potential of the area. The superiority of the geoelectric method over others in the groundwater research is showed (5). The ability of the resistivity method to furnish information on the subsurface geology in groundwater studies were showed (6; 7). They attested to the ability of the electrical method to provide information on the depth of fresh and salt water interface. The electrical resistivity methods have been over time successfully utilized in assessing water supply potential in basement aquifers (8). The resistivity method in exploring aquifer boundaries in the plains of Yemen was applied (9). The assessment of the groundwater resources potentials within the Obudu basement area of Nigeria carried out (3).
2. Theory
The fundamental theory behind the resistivity method was expanded (10) and the theory has been adequately covered (11; 12 and 13).The Maxwell’s equation for earth materials having dielectric and magnetic properties was expressed (14), as :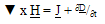 | (1) |
 | (2) |
 | (3) |
 | (4) |
Where 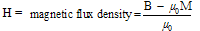 The equation of continuity is obtained by taking the divergence of equation (1)
 But the divergence of a curl is zero
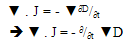 | (5) |
This is so because the order of derivatives with respect to co-ordinate and time can be reversed. Substituting eqn (4) into eqn (5) we have | (6) |
The resistivity method operates in the absence of a field of induction and is based on observations of an electric field maintained by direct current. However, for source free regions of the earth, equation (2) and (6) becomes: | (7) |
 | (8) |
Equation (7) suggests that the electric field strength may be expressed as the gradient of a scalar potential (v): | (9) |
However, Ohm’s law provides the relationship between E and j and it states that the current density is proportional to the electric field strength: This proportionality constant is called conductivity.It must be noted that for an isotropic medium, the conductivity will be a scalar quantity so that J and E will be in the same direction. In general, J and E are not in the same direction because conduction might be easier in one direction rather than another.Such a medium is said to be anisotropic and the conductivity is a tensor of second rank, the subscripts I and j may be any of the X, y or Z spatial directions in a rectangular co-ordinate system. Ohm’s law becomes:J = σŋE or, more fully
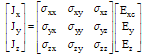 | (10) |
Combining equations (8), (9) and (10) gives a differential equation which is basis of all resistivity prospecting with direct current: | (11) |
In this isotropic case where the conductivity at a point in the ground is independent of direction, equation (11) reduces to Laplace’s equation: | (12) |
Solution to equation (11) and (12) may be developed for a particular model of the earth by selecting a co-ordinate system to match the geometry of the model and by imposing appropriate boundary conditions.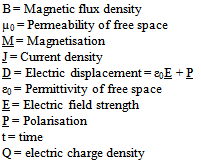
3. Experiment
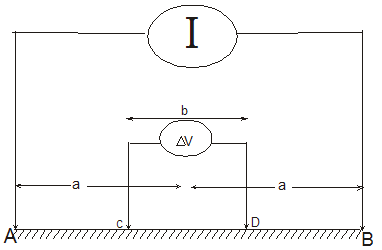
In this research work, the schlumberger array in electrical resistivity survey was adopted. The basic field equipment for this study is the ABEM Terrameter SAS 3000 which displays apparent resistivity values digitally as computed from ohm’s law. Other accessories to the terrameter includes, four metal electrodes, cables for current and potential electrodes, harmers (3), measuring tapes, walking talking or phones for very long spread (15). In this configuration, the four electrodes are positioned symmetrically along a straight line, the current electrodes on the outside and the potential electrodes on the inside. To change the depth range of the measurements, the current electrodes are displaced outwards while the potential electrodes in general, are left at the same position.When the ratio of the distance between the current electrodes to that between the potential electrodes becomes too large, the potential electrodes must also be displaced outwards otherwise the potential difference becomes too small to be measured with sufficient accuracy (16).Measurements of current and potential electrode positions are marked such that AB/2 ≥ MN/2. Where AB/2 = Current electrode spacing and MN/2 = Potential electrode spacingGenerally, the arrangement consists of a pair of current electrodes and a pair of potential electrodes. These are driven into the earth in a straight line to make a good contact with the earth. The current electrode spacing are expanded over a range of values for measurements in the field. The values of AB/2 increases as the measurements progresses while the potential electrodes separations are guided accordingly. The potential electrodes are kept at small separations relative to the current electrodes separations (17). One of the major advantages this method has over other methods is that only the current electrodes need to be shifted to new position for most readings while potential electrodes are kept constant for up to three or four readings (18). During the exploration work (field work) taking a sounding, the ABEM Terrameter SAS 3000 (Self Averaging System) performs automatic recording of both voltage and current, stacks the results, computes the resistance in real time and digitally displays it. (19).From the theory, we have that the potential at C due to A is 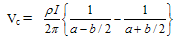 | (13) |
Whereα⇒ midpoint⇒ distance between the current electrodes and station.b ⇒ distance between potential electrodesρ⇒ layer resistivityThe potential at D due to A becomes 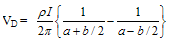 | (14) |
The potential difference dV between the two potentials is therefore given bydV = VC -VD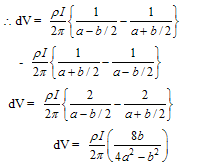 | (15) |
The apparent resistivity value is the product of the geometric factor and the resistance recorded in the resistivity meter. In each station, several soundings and apparent resistivity values will be obtained by expanding the current electrode spacing after each reading as required by Schlumberger array for deeper penetration into the earth and structural responses. The geometric factor, K, for Schlumberger configuration will be used. That is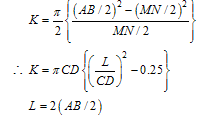 | (16) |
4. Results and Discussion
In Ikpoba Okha LGA, three locations were covered in the area, VES 12 (Obaretin), VES 28 (Iyanomon) and VES 14 (orhionmwonbor). The interpreted results are presented in PLATE I, PLATE II and PLATE III. In VES 12, the VES curves presents an (HK) ( >
> <
< >
> ) type-curve. VES 28 and VES 14, curves also presents an (HK) (
 >
> <
< >
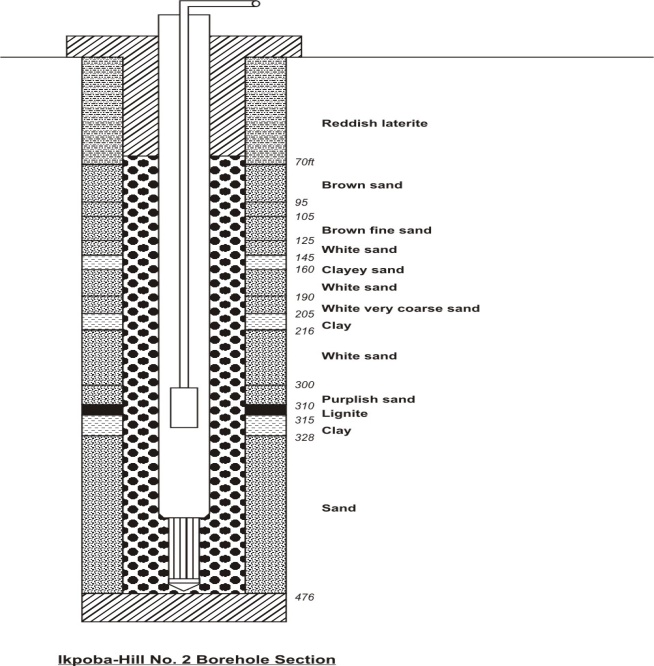
> ) type-curve. Computer interpretation of the curves resolved six (6) geoelectric layers for VES 12, 28 and 14. Geologic interpretation of the geoelectric layers of the three VES are presented in figure (4a, b &c). The aquifer layer was encountered at a depth of 59.80m to 85.80m for VES 12, 63.16m to 89.36m in VES 28. This is in correlation with the borehole data at Iyanomon (fig.1) at depth of 87.89m (290ft). Analyzing VES 14 curve, the curve showed that the interpretation gives a depth of 69.36m to 95.37m. This is in correlation with the depth of 96.67m (320ft) of Ikpoba hill no.2 borehole section (fig. 2).
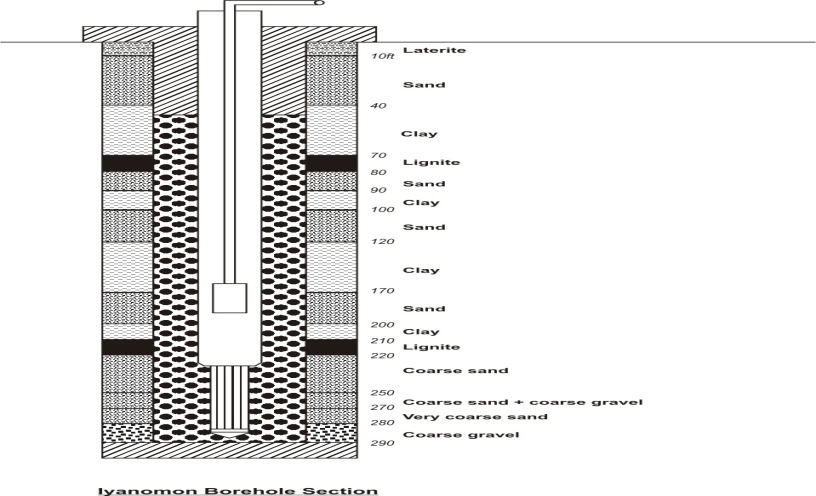 | Figure 1. Iyanomon Borehole Section |
 | Figure 2. Ikpoba-Hill No.2 Borehole Section |
 | Figure 3. Schlumberger Array |
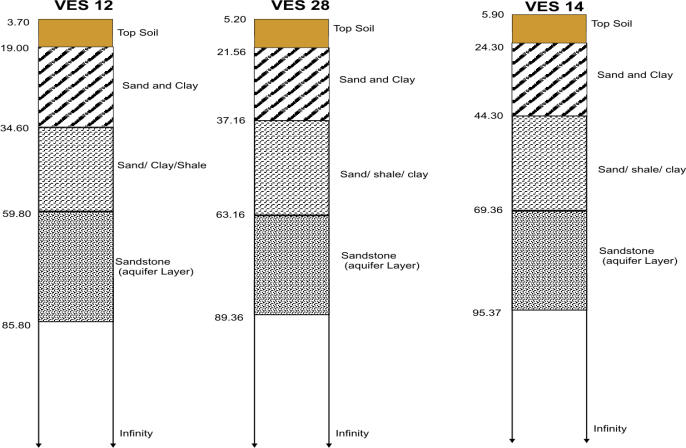 | Figure 4. (a, b, c): Geologic sections of Obaretin, Iyanomon and Orhionmwonbor locations |
PLATE IObserved Ves: 12 L.G.A.: Ikpoba OkhaLocation: Obaretin Weather: HotState: Edo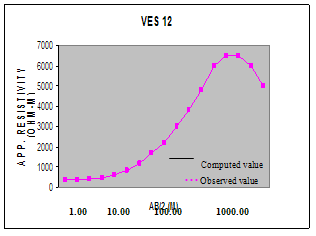 Observed (Field) and Computed (Theoretical) DataModel Parameter
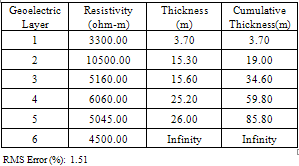 PLATE IIObserved Ves: 28 L.G.A.: Ikpoba OkhaLocation: Iyanomon Weather: HotState: Edo
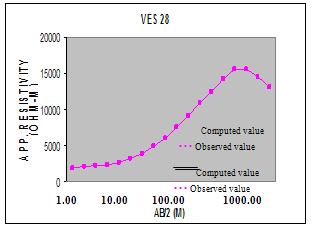
| Observed (Field) and Computed (Theoretical) Data |
|

|

|

| | 1.00 | 1450.64 | 1910.00 | | 1.47 | 1456.23 | 2110.00 | | 2.15 | 1464.37 | 2200.00 | | 3.16 | 1486.27 | 2300.00 | | 4.64 | 1543.77 | 2680.00 | | 6.81 | 1311.35 | 3260.00 | | 10.00 | 1225.45 | 3930.00 | | 14.70 | 1127.14 | 4880.00 | | 21.50 | 956.45 | 6000.00 | | 31.60 | 1923.16 | 7600.00 | | 46.40 | 2535.25 | 9100.00 | | 68.10 | 2867.66 | 10910.00 | | 100.00 | 1556.51 | 12400.00 | | 147.00 | 11640.20 | 14170.00 | | 215.00 | 15983.88 | 15510.00 | | 250.00 | 14564.77 | 15600.00 | | 300.00 | 14315.56 | 14550.00 | | 400.00 | 13877.87 | 13120.00 |
|
|
Model Parameter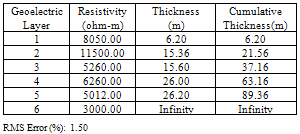 PLATE IIIObserved Ves: 14 L.G.A.: OredoLocation: Orionmwonbor Weather: HotState: Edo
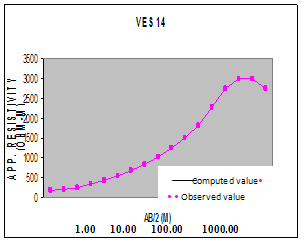
| Observed (Field) and Computed (Theoretical) Data |
|

|

|

| | 1.00 | 340.99 | 180.00 | | 1.47 | 313.01 | 200.00 | | 2.15 | 310.70 | 260.00 | | 3.16 | 364.11 | 347.14 | | 4.64 | 329.95 | 428.70 | | 6.81 | 504.29 | 537.61 | | 10.00 | 639.28 | 671.57 | | 14.70 | 809.63 | 835.02 | | 21.50 | 718.45 | 1024.64 | | 31.60 | 2559.21 | 1250.00 | | 46.40 | 1892.96 | 1491.53 | | 68.10 | 3131.76 | 1812.82 | | 100.00 | 5026.05 | 2263.10 | | 147.00 | 12252.98 | 2740.00 | | 215.00 | 21201.68 | 3005.10 | | 250.00 | 2345.56 | 3000.00 | | 300.00 | 2255.89 | 2750.00 |
|
|
Model Parameters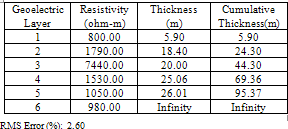
5. Conclusions
This study showed that the Benin formation is an extensive sand unit. The interpretation indicates that the water bearing formation which is the sandstone (sand) layer implied that the area has a great freshwater potential. The study showed that the correlation of the interpreted curves with the lithologic log from the borehole sections in the study area suggests that the major lithologic layers penetrated are laterite, clay, sand (sandstone) and sandy clay from basic depth interval as shown in fig.1 (a&b). The sandstone layer which is the aquifer zone lies between the depth of 59.80m to 85.80m for VES 12, 63.16m to 89.36m in VES 28 and 69.36m to 95.37m for VES 14. Therefore, the depth to water table in the study area has a maximum drill depth within the range of 60m (199.8ft) to 100m (333ft). The study has provided information on the depth to the groundwater and perhaps the thickness of the aquifer unit in Ikpoba Okha, a type area of the Benin Formation. This information will be relevant to the development of an effective water scheme for the study area and possibly beyond other areas underlain by the Benin Formation.
References
| [1] | EMENIKE E.A (2001): Geophysical Exploration for Ground water in a sedimentary environment. Global Journal of pure and applied sciences, Vol 7, No1 January |
| [2] | EKINE A..S and OSOBONYE (1996): Surface Geo-electric sounding for the determination of Aquifer characteristics in parts of Bonny Local Government Area of River State. Nigeria Journal of Physics Vol. 85, pp.93-97 |
| [3] | OKWUEZE E.E (1996): Preliminary findings of the groundwater resource potentials from a regional geo-electric survey of the Obudu basement area, Nigeria Global Journal of Pure and Applied sciences Vol. 2, No. 2, pp. 201-211 |
| [4] | KOGBE C.A. (1989): Geology of Nigeria. Rock View (Nig.) Ltd., Plot 1234, Zaramaganda, Km.8, Yakubu Gowon Way, Jos, Nigeria. First published 1975 |
| [5] | PULAWASKI .B. and KURTH.K. (1977): Combined use of resistivity and seismic refraction methods in groundwater prospecting in crystalline areas. Study Project, Kenya, DANIDA,pp.5-33 |
| [6] | ZOHDY A.A. (1974): Automatic interpretation of schlumberger sounding curves. Geological survey Bulletin1313– EUS Government Printing office Washington, pp.71 |
| [7] | ZOHDY A.A, EATON C.P.& MABEY D.R, (1974): Application of Surface geophysics to groundwater investigation – Tech.Water resources investigation, Washington, U.S Geo/Surveys |
| [8] | CHILTON P.J. AND FOSTER S.S.D, (1995): Hydrogeological and characterization and water supply potentials of basement aquifers in tropical Africa.Hydrogeological Journal,3:36-49 |
| [9] | VAN OVERNEEREN R.A.(1989):Aquifer boundaries explored by geo-electrical measurements in the coastal plains of Yemen: A case of equivalence. Geophysics 54: 38-48 |
| [10] | MAILET, R. (1947): The fundamental equations of electrical prospecting. Geophysics, vol.12, No.4, Pp. 529-556 |
| [11] | KELLER, G.V & FRISCHKNECHT, (1966): Electrical methods in geophysical prospecting. Pergamon, oxford. Pp 517 |
| [12] | GRANT, F.S & WEST, O.F (1965): Interpretation theory in applied geophysics. McGraw-Hill, New York, Pp 583 |
| [13] | BHATTACHARYA, P.K. & PATRA, H.P.(1968): Direct Current geoelectric sounding. Elsevier, Amsterdam. Pp 135 |
| [14] | FEYNMAN, R.P., LEIGHTON, R.H. & SANDS, M. (1965): The Feynman lectures on Physics. Addison Westley reading (3 volumes) |
| [15] | ASOKHIA M.B. (1995): Engineering Geology Services Ltd Lagos, Nigeria |
| [16] | OTTO KOEFOED (1979): Geosounding Principles 1, ESPC-Amsterdam, Oxford, New York |
| [17] | MILSON JOHN (1939): Field Geophysics – a handbook of geophysical society of London. John Wiley & Sons NY, Toronto, Singapore |
| [18] | REINHARD K. FROHLICH (1974): Combined geo- electrical and Drill-hole investigation for detecting fresh-water aquifers in Northern western Missouri. Geophysics Vol. 39, pg. 340-352 |
| [19] | DORBRIN M.D and KING R.F (1976):Introduction to Geophysical prospecting. Mc Graw-Hill. Book, New York pp.630 |
 Abstract
 Reference
 Full-Text PDF
 Full-text HTML