Oluwole. O. O, Adewumi. A. D
Mechanical Engineering Department, University of Ibadan, Nigeria
Correspondence to: Oluwole. O. O, Mechanical Engineering Department, University of Ibadan, Nigeria.
| Email: |  |
Copyright © 2012 Scientific & Academic Publishing. All Rights Reserved.
Abstract
Upper bound solutions to a 4-High reversing aluminium cold-rolling sheet mill was obtained in this work using both analytical and graphical methods. The upper bound method was applied to the rolling of an Al 1200 sheet from 7mm to 0.6mm in six passes. It was observed that both methods were very effective in predicting upper bound load value with the graphical method giving a higher value using input velocity values from industry. However, it was observed that the graphical method becomes very difficult to use when sheet thicknesses become very small.
Keywords:
Upper-Bound Technique, Cold-Rolling, Aluminium Sheet- Mill
Cite this paper: Oluwole. O. O, Adewumi. A. D, Comparative Analysis of Analytical and Graphical Upperbound Solutions for 4-High Reversing Aluminium Cold –Rolling Sheet Mill, Science and Technology, Vol. 2 No. 1, 2012, pp. 30-36. doi: 10.5923/j.scit.20120201.06.
1. Introduction
The upper bound is particularly useful for the study of metalworking processes in which it is essential to ensure sufficient forces are applied to cause the required deformation. This facilitates calculations of the greatest possible load that a press or machine will be called upon to deliver or sustain. They are particularly valuable in plain strain problems. The estimate which this technique provides always exceeds that which is required. It provides an upper bound or an over estimate of the true load required to carry out the task.Exact solutions must be both statically and kinematically admissible. That means they must be geometrically self-consistent as well as satisfying the required stress equilibrium everywhere in the deforming body (Hosford & Caddell, 2007). This method has been used and still being used to estimate upper limit loads for deformation. Paydar et al, 2008 used this for the first time, to analyze the equal channel angular extrusion with circular cross-sections. Perez and Luri(2008) also used this method in the study of the required force for performing the ECAE process, which takes into account correct selection of the channel dies in equal channel angular extrusion which dies he had proposed earlier. Abrinia and Fazlirad (2009) proposed a generalized analytical method to study external shape and calculate pressure and torque for the process of rolling shaped sections. Assempour and Emami (2009) presented two novel numerical procedures to determine upper and lower bounds on the actual collapse load multiplier for plates in bending Khaddam et al, 2011 developed an upper bound solution for axi-symmetric forward spiral extrusion process.The approach taken for estimating the upper bound is based on suggesting a likely deformation pattern, i.e. lines along which slip would be expected to occur for a given loading situation. Then the rate at which energy is dissipated by shear along these lines can be calculated and equated to the work done by an (unknown) external force. By refining the geometry of the deformation pattern, the minimum upper bound can be determined. Frictional forces can be accommodated in this approach. The approach utilises hodographs, which are self-consistent plots of velocity for different regions within a body being deformed; the different regions are assigned by considering how the overall body will deform for a particular deformation process and their relative velocities are estimated by assuming that the applied external force has unit velocity.The upper bound method is based on the computation of the energy consumption in the process, obtained from the flow field in the actual forming process. In case the flow field is not known well, a probable flow field is proposed, and then an analysis is performed for this field. When the energy is known, forming parameters such as the forming load and die pressure can be determined from it. If different velocity fields are tried, the best will be the one that provides the lowest energy consumption. If the assumed velocity field differs from the real velocity field, the computed energy will exceed the real energy consumption. Hence, when the upper bound method is applied, one gets estimates of the forming load and the pressure that are either larger than or, in the best case, equal to the real load and the real pressure. This is why the solution is termed an upper bound (Valberg, 2010)
2. Materials and Methods
The upper bound loads needed to deform a continuously cast aluminium sheet (Al 1200) from 7 mm in different passes to the final thickness of 0.6mm was obtained using analytical and graphical methods. The obtained values were compared with real values obtained from an aluminium sheet rolling mill (Tower Aluminium rolling mills, OTA, Nigeria). The reversible cold rolling mill has a local panel display unit where parameters related to the process could be read and accessed by operators. Parameters such as deforming load (tons), the sheet inlet and outlet thickness (mm), Gap Skew (mm), roll speed (mm/s), calculated gap and Numbers of passes are read- off the display panel.
2.1. Analytical Method
We considered a strip of Aluminium passing through the roll gap between two cylindrical steel rollers of a rolling mill. Deformation work is done on the strip to reduce its thickness to the desired target as it passes through the roll gap. This is achieved by the pressure exerted upon the strip by the upper and lower rolls of the rollers coming in contact with the strip on it lateral sides thereby having an incomplete circular contacts with the strip referred to as the arc of contact. The arc of contacts subtends angles  (known as the angle of contact) with the vertical axis of the roll and the point of entry of the strip into the roll gap. The arcs of contacts produce two arc patterns of tangential velocity discontinuities as illustrated in Fig. 1
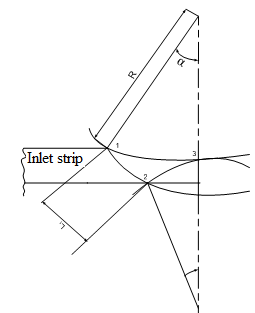 | Figure 1. A Sketch of a strip rolling process showing the angle of contacts |
The following simplifying assumptions were made in employing the upper bound theorem to rolling, (Hosford & Caddell, 2007).I. The material was considered to be homogenous and isotropicII. Strain hardening effect was neglectedIII. Interfaces were assumed to be frictionless i.e. frictional effects neglectedIV. Geometric changes in terms of volume were neglectedV. The material was considered to be rigid-plastic in nature-no elastic deformationVI. A perfect plastic deformation was assumedVII. No attention was paid to satisfying equilibriumVIII. Bauschinger effect was neglectedIX. Assumption of an internal flow fieldX. The rate of which energy is consumed by the flow field in terms of workdone is equated with the rate of external work.
2.1.1. Analytical Calculation & Formulation
Below is the rolling process sketch showing maximum reduction.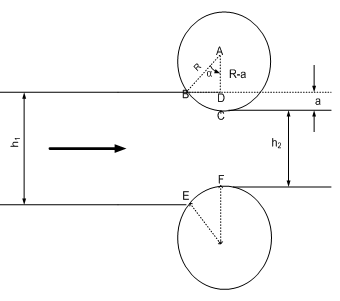 | Figure 2. A sketch showing the geometric relationship in a cold rolling process |
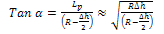
R= radius of the roll,  = angle of contact of the upper roll. From triangle ABC in fig 2, we haveThe arc BC in fig 2 is taken to be approximately equal to Lp in linear form (Udomphold, 2007).I.e.
  (length of the arc of contact)From the triangle ABC,
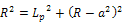 | (1) |
Take  Where
Where change in strip thickness,
  = Initial strip thickness,
  final strip thickness
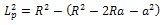 | (2) |
 | (3) |
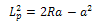
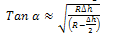
Since  is much smaller than
  we can ignore
 , i.e.
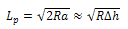 | (4) |
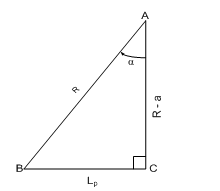 | Figure 3. The triangle ABC formed in the rolling process diagram |
From triangle ABC in fig. 3 | (5) |
 | (6) |
Recall;  therefore
 | (7) |
Since  is very small compared to R
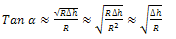 | (8) |
From the rolling diagram in fig. 2, the rate external workdone (W) by the rotating roller is a function of the Torque and angular velocity. Analysing the kinetics of the roller;Also, W=Torque (T) *angular velocity (ω) - for rotating bodiesTherefore, Rate of External Workdone by the roller
 | (9) |
But Torque = Force ×angular displacement,  and
and 
 | (10) |
Taking 
 | (11) |
where, | (12) |
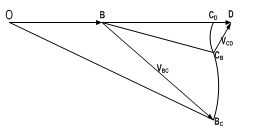
A hodograph (velocity diagram) is drawn to show velocity discontinuities in the strip during the deformation process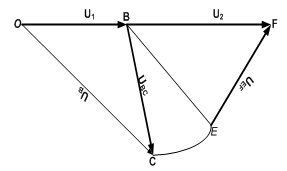 | Figure 4. the hodograph of the cold rolling mill |
It can be de deduced from the hodograph that;Rate of Internal Workdone = Where,
  = the yield Stress at pure shear (shear yield strength)Arc BC = Shear discontinuity arc pattern due to the upper roll (L1)Arc EF = Shear discontinuity arc pattern due to the lower roll (L2)UBC= velocity discontinuity due to BC (U)UEF= velocity discontinuity due to EF (V)Since Aluminium A1200 was used at the industry where real life data was obtained, we make use of the shear Yield Strength (K) of A1200. The value of K for A1200 was obtained using the Von-Misses yield yield criteria stated in equation 13.
 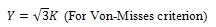 | (13) |
Where Y= Tensile Yield Strength (YS) of aluminium A1200. The Yield Strength of aluminium in tension ranges from 15 - 45 MPa. This greatly depends on the grade of the Aluminium. The Aluminium A1200 has a Tensile Yield Strength 25MPa. ( 2011).Rate of Equating External Workdone = Rate of Internal Workdone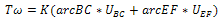 | (14) |
 | (15) |
 | (16) |
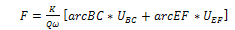
Equation (16) is the upper bound model generated using the analytical method of approach. F= Force calculated from equation (16) using Von Misses criterion 
2.2. Graphical Approach
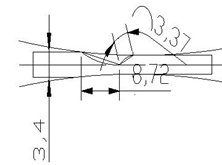
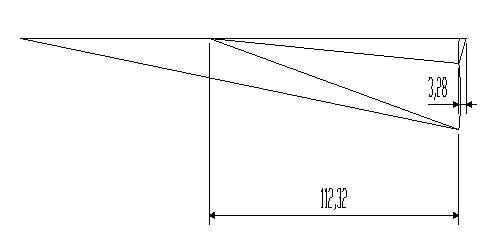
Unlike the analytical method of force estimation using the upper bound theorem, the graphical method is more tasking. The rolling process is schematically shown in Fig. 5 using the real life industrial values obtained from Tower Aluminium rolling mills, Ota, Nigeria. The diagram showing the first pass in the rolliong process was drawn to scale using AutoCAD(R) 2007 drawing software. 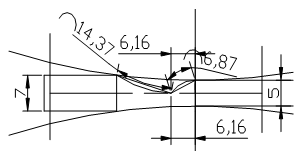 | Figure 5. Process diagram showing the deformation region of the 1st pass drawn to scale |
Using the SLF diagrams produced by Oluwole and Olaogun (2011), two discontinuities were sufficient to ensure that material in contact with the roll rotates with it. Since rigid body motion prevails at the entry and exit sides, to construct the discontinuities, arc BC and CD are drawn.CD is drawn tangentially to the roll exit while intersecting the strip principal axis PQ at 45⁰. The chord of arc CD is inclined to the horizontal at point D. It is advisable to draw arc CD before BC because there are more details for the location of CD than BC. From the diagram showing details for a particular pass and other related data from the tabulated values, the corresponding hodograph can be drawn. The assumed shape of the hodograph is shown in Fig.7.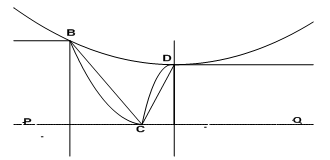 | Figure 6. Diagram showing schematic of top symmetrical portion of Fig.5 |
 | Figure 7. The hodograph (velocity diagram) |
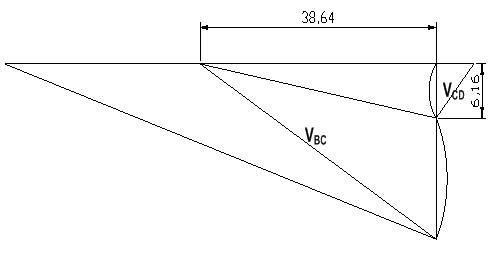 | Figure 8. the constructed velocity diagram (hodograph) for the first pass shown fig. 5 |
From the hodograph shown in Fig.7, OB represents the inlet strip velocity U1, BD represents the outlet strip U2, VBC represents the velocity discontinuity of arc BC, VCD represents the velocity discontinuity of arc CD, CD is the point where arc CDCB is drawn, CDCB represent arc CD and CBBC represent arc BC.U1 used is the value obtained from the industry while U2 is obtained from the relation | (17) |
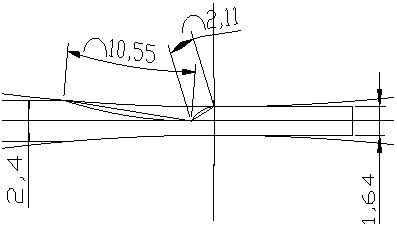
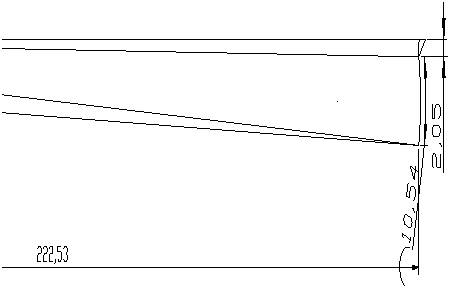
(A simple relation considered when the lateral spread in breath is neglected). CBD forms 45⁰ with the horizontal vector representing U2.Based on this, the deformation regions and the corresponding hodographs for passes 2-4 (Figs.9-14) were drawn to scale using AutoCAD(R) 2007.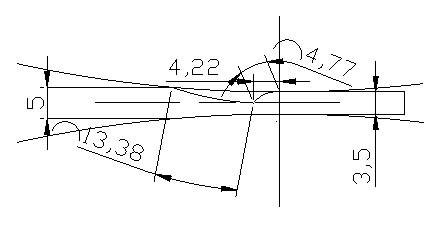 | Figure 9. Diagram showing the deformation region of the 2nd pass |
 | Figure 10. The corresponding velocity diagram (hodograph) for 2nd pass |
 | Figure 11. Diagram showiationg the deformn region of the 3rd pass |
 | Figure 12. The corresponding velocity diagram (hodograph) for the 3rd pass |
 | Figure 13. Diagram showing the deformation region of the 4th pass |
 | Figure 14. The corresponding velocity diagram (hodograph) of the 4th pass |
2.2.1. Calculations and Formulations for the Graphical Method
The process diagram drawn to scale for each pass gave the details of some of the parameters required to establish an upper bound model employed in this method.The following parameters or variables were obtained from the real life values to draw the process diagram and in constructing the corresponding hodograph for each pass.hi = initial strip thicknesshf = final strip thicknessU1= inlet strip velocityr = radius of the roll.The following parameters were obtained from the hodograph constructed for each pass.UBC = velocity discontinuity of arc BCUCD = velocity discontinuity of arc CDLb = BC = length of arc BCLd = CD = length of arc CDFrom the rolling process, it can be deduced that the rate of external workdone W2 is  | (18) |
 =torque, ω= angular velocity of the roll.Recall that,
  | (19) |
Let  , radial distance and line of action the torque
 | (20) |
Therefore, | (21) |
Also, the rate of internal energy E2 dissipation along the discontinuities based on Von Misses criterion can be given as  | (22) |
For the deformation caused by 2 rolls, we have | (23) |
Since BC = Lb and CD 
 | (24) |
Equating the rate of internal energy dissipated to the external workdone i.e. W2 = E2, we have | (25) |
 | (26) |
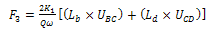 | (27) |
K1 remains the Shear Yield Stress of Al according to Von-Misses Yield criterion defined in equation 12. F3 is the force exerted on the sheet under roll and is the deforming force calculated with the upper bound model developed.Equation (27) represents the upper bound model developed from the hodograph shown in Fig.6 using the graphical approach. Using input values from the process diagrams of the passes and their corresponding hodographs, solution to each pass was obtained.
3. Results and Discussion
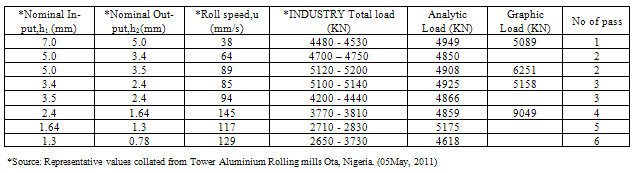
Table 1 shows comparative load values obtained for Al 1200 sheet cold rolling from both analytical and graphical method of analyses and comparing with industry values. Two values were obtained for second and third passes from industry to show variations in load values applied for approximately same rolling reductions which suggested that high load values are applied at times during the rolling passes and variations in rolling speed by operators at will in order to meet production schedules.Figs. 1 shows a plot of the mean values of the Total Load (real life values) obtained from the industry and the calculated Loads. Values obtained from graphical method were the highest and way above the analytical method. Also, operator vagaries did not affect values obtained by graphical method as the input speed influenced graphical values. However, values obtained by analytical and graphical values showed upper bound values for the rolling passes. Graphical method becomes useful when reasonable rolling speeds are selected. In terms of ease of calculation, the analytical method was easier to evaluate for any reduction in thickness but the graphical method became difficult to draw as the rolling thickness became very small. This method of obtaining solution to cold rolling employed in this research work is expected to yield the upper limit of deformation pressure or load.From Table 1, it is obvious that values of the load estimated in each pass for plastic deformation of Al 1200 sheet in a cold rolling process using the analytical method of the upper bound technique considering the Von Misses criterion gave load values higher than those obtained from industry. The 2nd and 3rd passes where some estimated values were lower than the industrial values could be seen as exceptional cases as it was noticed that the values of these passes from the industry were exceptionally higher than values obtained for similar pass with approximately same reductions. Table 1. Load values obtained for Al 1200 sheet cold rolling process
 |
| |
|
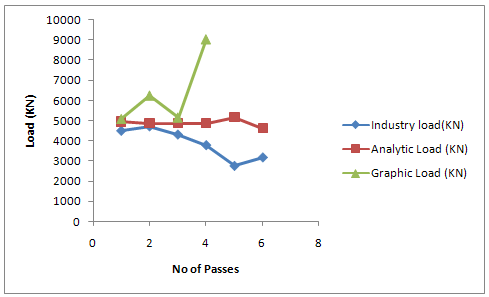 | Figure 1. Plot of Mean Total Load and calculated Loads against number of roll pass |
4. Conclusions
Both analytical and graphical methods of obtaining the upper bound loads for a 4-High reversing aluminium cold-rolling sheet mill has been studied. Both methods gave upper bound loads (in comparison with values obtained from an Aluminium rolling mill) with the graphical method being way higher than the analytical method. The variations between both methods is attributed to the nuances of operators to unilaterally vary rolling speeds and loads in order to meet up with production targets. The analytical method was observed to be easier to handle as the graphical method becomes difficult to obtain as rolling thicknesses get very small. The upper bound model developed for the cold rolling of Aluminium sheet in this research work can be applied in the rolling mill industries for cold rolling process of sheet metals. This implies that an upper bound model developed for a particular bulk deformation process can be employed for use in similar processes in various industries. The hodograph (velocity diagram) developed can be used for research work on material flow studies and strain effects for materials under loading.
References
| [1] | Abrinia. K, Fazlirad. A(2009) Three-dimensional analysis of shape rolling using a generalized upper bound approach Journal of Materials Processing Technology,209(7)3264-3277 |
| [2] | Alu Select. (Assessed Nov. 22 ,2011) ‘Mechanical Properties of Al 1200’ Aluminium http://aluminium.matter.org.uk /aluselect/09_mech_browse.asp? |
| [3] | Assempour.A, Emami. M.R (2009) ‘ Journal of Materials Processing Technology, 209(5),2270-2276 |
| [4] | Hosford W.F. and Caddell R.M. 2007. Metal forming mechanics and metallurgy. 3rd Edition. Cambridge University Press. |
| [5] | Khoddam.S, Farhoumand.A, Hodgson.P.D(2011) Upper-bound analysis of axi-symmetric forward spiral extrusion ,Mechanics of Materials,43(11),684-692 |
| [6] | Oluwole.O.O and Olaogun. O (2011) ‘Slip Line Field Solutions For Second Pass In 4-High Reversing Cold Rolling Sheet Mill’ Engineering, SCIRP, USA. (Accepted paper) |
| [7] | Paydar.M.H, M. Reihanian.M, Ebrahimi. R, Dean.T.A, Moshksar .M.M(2008)An upper-bound approach for equal channel angular extrusion with circular cross-section Journal of Materials Processing Technology, 198(1-3)48-53 |
| [8] | Pérez. C. L, Luri. R(2008)Study of the ECAE process by the upper bound method considering the correct die design Mechanics of Materials, 40(8)617-628 |
| [9] | Udomphol T. 2007. Rolling of metal. A point presentation at Sunraree University of Technology. Retrieved 23 June, 2011 from http://www.sut.ac.th/ engineering/metal/pdf/MetForm /03_Rollingofmeta.pdf. |
| [10] | Valberg S.H, 2010. Applied Metal Forming including FEM Analysis. Cambridge University Press. |
 Abstract
 Reference
 Full-Text PDF
 Full-text HTML