-
Paper Information
- Next Paper
- Paper Submission
-
Journal Information
- About This Journal
- Editorial Board
- Current Issue
- Archive
- Author Guidelines
- Contact Us
Science and Technology
p-ISSN: 2163-2669 e-ISSN: 2163-2677
2012; 2(1): 1-7
doi: 10.5923/j.scit.20120201.01
Estimation of Coda Wave Attenuation Quality Factor from Digital Seismogram Using Statistical Approach
 Abstract
 Reference
 Full-Text PDF
 Full-Text HTML
Jwngsar Brahma
School of Petroleum Technology, Pandit Deendayal Petroleum University, Gandhinagar, 382007, India
Correspondence to: Jwngsar Brahma , School of Petroleum Technology, Pandit Deendayal Petroleum University, Gandhinagar, 382007, India.
| Email: |  |
Copyright © 2012 Scientific & Academic Publishing. All Rights Reserved.
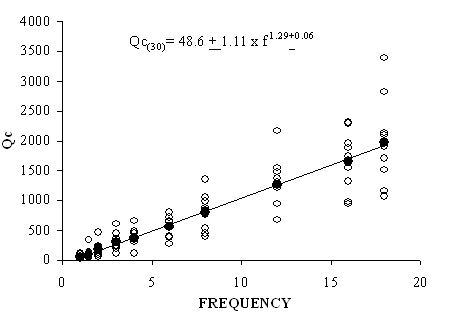
The main objective of the paper is to estimate seismic wave attenuation from the decay rate of coda wave amplitudes of digital seismogram of local earthquakes (epicentral distance < 100 km) following statistical approach. Three earthquake events have been selected for estimation of coda wave attenuation quality factor (Qc). The coda wave of 9 seismograms from 3 local earthquakes recorded digitally by three seismic stations in the region have been analyzed for this purpose at ten central frequencies (1, 1.5, 2, 3, 4, 6, 8, 12, 16 and 18Hz) and three lapse time windows of 20, 30 and 40 seconds duration. Single backscattering model proposed by Aki (1969) and extended by Aki and Chouet (1975) and Sato (1977) is employed to determine Qc values. The mean values of the estimated Qc vary from 31+12 (at 1Hz) to 1974+211 (at 18Hz) for 20 seconds coda window length. For 30 seconds coda window length Qc vary from 46+16 (at 1Hz) to 1977+ 256(at 18Hz). Similarly for 40 seconds coda window length Qc vary from 97+ 22 to 2552 +312. It is observed that Qc value for the study area is frequency dependent and increase with increase in frequency. Moreover the observed Qc values increase with increasing lapse time at all frequency bands. The estimated Qc values show a frequency dependent relationship of the form Qc=Qof n, where Q0 is Qc at 1Hz and n represents degree of frequency dependence. The frequency dependent empirical attenuation relationship for 20, 30 and 40 seconds window lengths are obtained as Qc = 21.49+1.17 f 1.48+0.08, Qc = 48.6+1.11 f 1.29+0.06 and Qc = 88.86+1.12 f 1.19+0.06 respectively.
Keywords: Earthquake, Seismogram, Coda Waves, Central Frequency, Epicentral Distance, Local Earthquake
Cite this paper: Jwngsar Brahma , "Estimation of Coda Wave Attenuation Quality Factor from Digital Seismogram Using Statistical Approach", Science and Technology, Vol. 2 No. 1, 2012, pp. 1-7. doi: 10.5923/j.scit.20120201.01.
Article Outline
1. Introduction
- Attenuation is one of the fundamental properties of seismic waves from which the material and physical conditions in the Earth’s interior can be inferred (Aki, 1980). The decay of seismic wave amplitude with distance defines the attenuation of the medium. Seismic attenuation is usually considered to be a combination of two mechanisms – intrinsic absorption and scattering loss. As seismic wave propagate through the Earth’s interior and finally arrives at seismic stations on the surface, its energy (amplitude) decays due to conversion of elastic energy to heat or other forms of energy (intrinsic attenuation) as well as energy redistribution in the heterogeneities present in the lithosphere (scattering). The measurement and interpretation of elastic wave attenuation is important for studying the medium through which seismic wave propagates.Attenuation of seismic wave is described by a dimensionless parameter called the quality factor Q (Knopoff, 1964) that expresses the wave amplitude decay that occurs when a wave propagates through a medium the inverse of thequality factor (Q-1) is known as the attenuation factor, which is proportional to decay of amplitude with passages of time or source- receiver distance. The attenuation quality factor (Q) is a combination of intrinsic quality factor, Qi and scattering quality factor Qs. There are various methods to estimate the attenuation quality factor of seismic wave in a region. It is difficult to measure attenuation from a high frequency seismogram using a deterministic approach, because large number of parameters is required to adequately explain a high frequency seismogram. In order to overcome this difficulty Aki (1969) initiated the application of a statistical approach to study of high frequency seismic waves. All portions of a seismogram cannot be treated entirely statistically, because their characters are determined by a particular nature of the path between the source and station (Aki, 1969). Aki (1969), developed a model for the rate of coda decay and suggested that the seismic coda waves of local earthquakes are backscattered body waves from numerous randomly distributed heterogeneities in the earth’s crust and may be treated by a statistical method. The longer the wave travels the greater the variety of heterogeneities they encountered. The later portions of a seismogram therefore may be considered as a result of some kind of averaging over many samples of heterogeneities, thus suggesting a statistical treatment in which a small number of parameters characterize the average properties of the heterogeneous medium (Aki and Chouet, 1975). One of the most promising means of studying seismic scattering and attenuation in the crust and lithosphere is analysis of the coda of local earthquake (Aki, 1969). Coda is the end part of a seismogram of locally recorded earthquake following the body and surface waves containing a very complex and gradually decaying signal. The coda wave amplitude on a seismogram is explained by two backscattering models (Aki and Chouet, 1975). The first is the single scattering model, according to which waves are backscattered S waves and generated when S wave encounters different heterogeneity present in the propagating media. This model assumes that the scattering wave field is weak and does not produce secondary scattering when it encounters another scatterer. The law of energy conservation is violated because of oversimplification of this model. This model assumes that earthquake source and the seismic station are located at the same point in an unbounded, homogenous, and isotropic medium containing a random but uniform spatial distribution of heterogeneities. This model was further modified by Sato (1977), considering a finite distance separating the source and receiver.The second model is the multiple scattering models (Aki and Chouet, 1975; Gao et al., 1983a), which assumes secondary scattering and consider the seismic energy transfer as a diffusion process. Aki (1969) suggested that coda Qc-1 is more closely related to intrinsic rather than scattering attenuation. Within the frame work of the single scattering theory Qc-1 represents an effective attenuation, including the contribution of both intrinsic and scattering loss ( Akinci et al., 2000). Several authors (e.g. Aki and Chouet, 1975; Sato, 1977; Rautian and Khalturin, 1978; Hermann, 1098; Roecker et al., 1982; Frankel, 1991; Woodgold, 1992; Gupta, 1998) observed that the coda wave model of Aki (1969), extended by Aki and Chouet (1975) and Sato (1977) is the easiest way to estimate the attenuation, backscattering and source spectrum. In the present study, Qc is estimated following single scattering model of Aki and Chouet (1975) extended by Sato (1977). The events used in this study are listed in Table 1. Qc is measured as a function of frequency using the digital waveform data of local earthquakes. A study is made of elastic wave attenuation to develop an attenuation relationship. The coda Qc values are calculated for different lapse time windows of coda envelope to investigate the lapse time dependence of Qc as well as the possibility of depth dependence of seismic attenuation.
2. Data
- In this study, we selected only 3 earthquakes given in the Table 1 recorded by local seismic network during the three local seismic stations namely Tezpur (TZR), Dokmok (DMK) and Seijusa (SJA).The broadband seismic stations are equipped with CMG-3T / CMG-3ESP seismometer (3-component) and REFTEK 72A series data acquisition system. The sampling rate of the signal is 100 samples per second. The locations of the seismic stations as well as the epicenters of the earthquake events are shown in Figure 1. The selection of the data set is made on the basis of the following criteria:year 2001. These events are recorded by i. Epicentral distance of the events less than 100 kmii. Higher signal to noise ratio.iii. Clear record of coda waveOut of two horizontal components of seismograms only one component is utilized for this purpose for which S-wave arrival is earlier compared to the other. Total 9 horizontal component seismograms are selected for this purpose. The hypocentral parameters of the selected events are listed in Table 1.
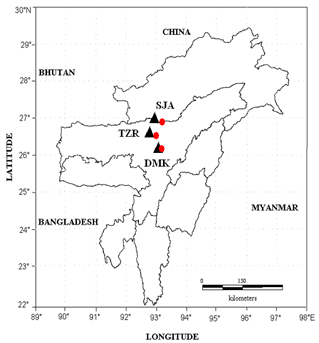 | Figure 1. Figure showing location of 3 earthquakes (Red balls) used in the present study and the recording seismograph stations (black triangles) namely Tezpur (TZR), Dokmok (DMK) and Seijusa (SJA) |
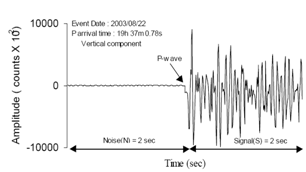 | Figure 2a. shows the original seismogram and two time windows (2 sec before and after P arrival) used in the evaluation |
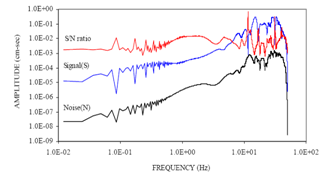 | Figure 2b. Shows the corresponding frequency spectra designated as Noise (N)[black], Signal (S)[blue] and S/N ratio [red] |
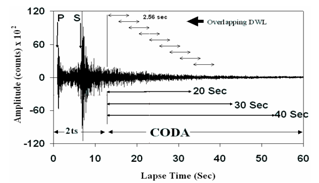 | Figure 3. Figure showing a digital seismogram recorded by DMK seismic station. Different coda window length used in this study are shown along with the discrete window length of 2.56 sec used for smoothening the coda envelope by calculating RMS values of coda wave amplitudes with a sliding window of half of the discrete window length i.e. 1.28 seconds |
3. Method and Data Analysis
- The coda Q method was introduced by Aki(1969) and has been extended by different researchers e.g. Aki and Chouet (1975), Sato (1977) and Rautian and Khalturin (1978). We have utilized the single back scattering model developed by Aki (1969) and extended by Aki and Chouet (1975) and Sato (1977) for estimation of coda wave attenuation quality factor, Qc. This model is based on the following assumptions:According to Aki (1969), Aki & Chouet (1975) and Sato (1977), the time dependence of root mean square coda wave amplitude, A(ω,t), on a bandpass-filtered seismogram can be written as
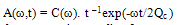 | (1) |
 | (2) |
 | (3) |
 | (4) |
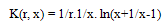
 | Figure 4 (a). Shows an example of original and band pass filtered seismogram (event no. 2 in Table 1) of a local earthquake recorded by the DMK (Dokmok) station and (b) Shows the plot of ln [ A(r, ω,t)/ [K(r,x)] vs. t, the lapse time for 30 sec coda window |
4. Results and Discussion
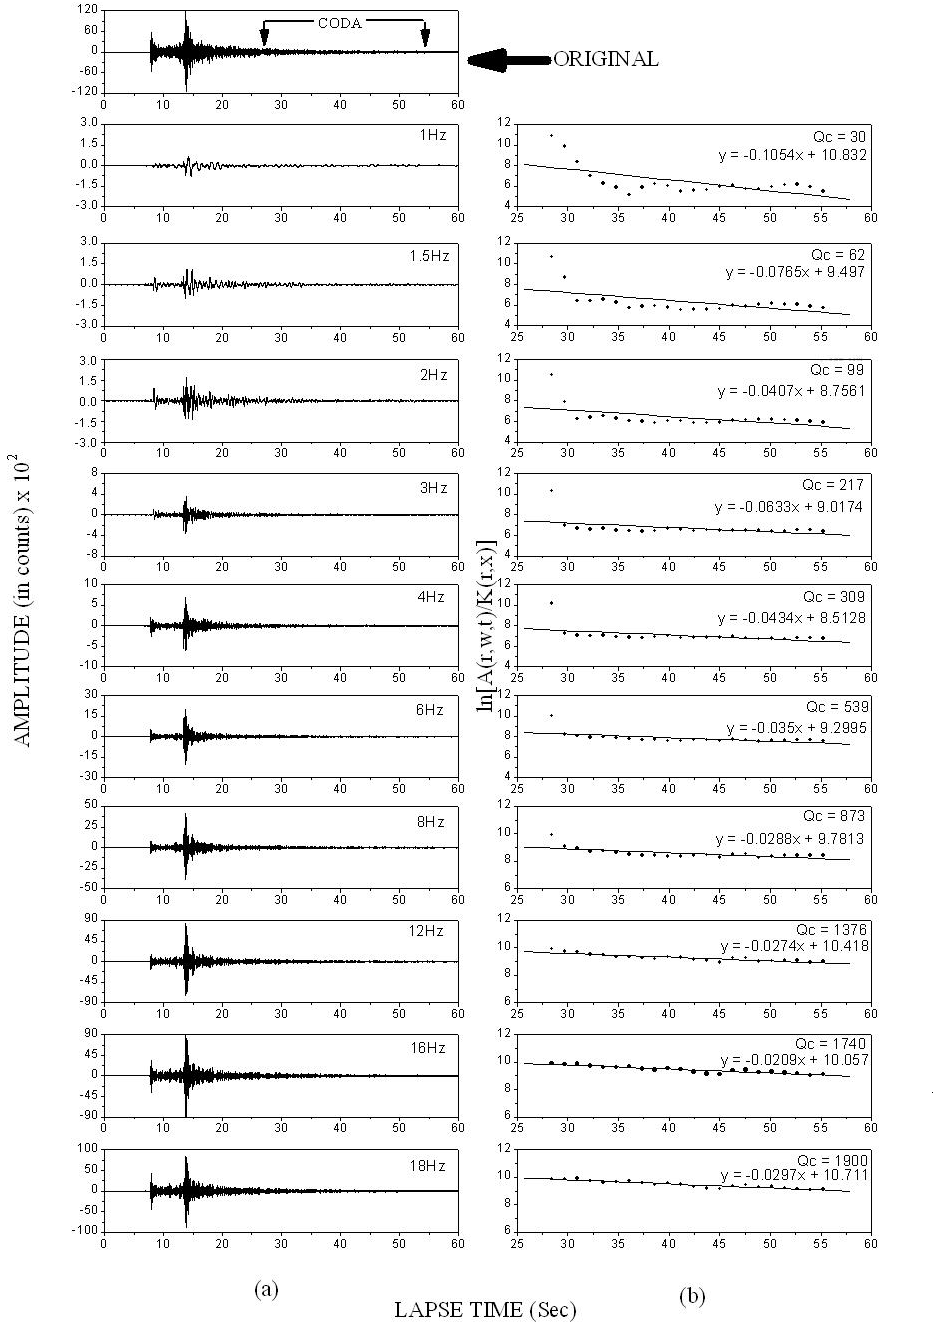
- The Qc values are estimated filtering the coda waves of 9 waveforms in frequency band centered at 1, 1.5, 2, 3, 4, 6, 8, 12, 16 and 18Hz for lapse time window length of 20, 30 and 40 seconds. Total 270 Qc measurements are obtained for 20, 30 and 40 seconds coda window length estimated from the linear regression of the ln[A(f, t)/K(r, x)] vs t plot. The Qc values for all lapse time and frequency ranges are listed in Table 3a, Table 3b and Table 3cThe Qc measurements estimated from 20 sec coda window length vary from 7 to 92 at frequency 1Hz and 562 to 5492 at 18Hz. The distributions of Qc values with frequency are shown in Figure 5a. The mean value of Qc observations (filled circles) using 20 seconds coda window length for all the stations are also shown in the Figure 5a which vary from 31 + 14 at 1Hz to 1974 + 209 at 18Hz. It is observed from the general trend (Figure 5a) that Qc values follows a power law of the from Qc = Q0fn, where Q0 is the quality factor at 1Hz and n is the frequency dependent coefficient. For 20 seconds coda window Q0 and n are 21.49+1.11 and 1.48+0.08 respectively and we obtain the frequency dependent attenuation relation as Qc = 21.49 + 1.11 f 1.48+0.08.For 30 sec coda window length Qc measurements vary from 14 to 115 at frequency 1Hz and 1065 to 3400 at 18Hz. The distributions of Qc values with frequency are shown in Figure 5b. The mean value of Qc observations (shown by dark filled circles in Figure 5b) vary from 46 + 22 at 1Hz to 1977 + 225 at 18Hz. The empirical attenuation relationship for 30 seconds coda window length is obtained as Qc = 69.92 + 1.11 f 123+0.058.
| |||||||||||||||||||||||||||||||||||||||||||||||||||||||||||||||||||||||||||||||||||||||||||||||||||||||||||||||||||||||||||||||||||
| |||||||||||||||||||||||||||||||||||||||||||||||||||||||||||||||||||||||||||||||||||||||||||||||||||||||||||||||||||||||||||||||||||
| |||||||||||||||||||||||||||||||||||||||||||||||||||||||||||||||||||||||||||||||||||||||||||||||||||||||||||||||||||||||||||||||||||
 | Figure 5a. Shows the distributions of Qc values with frequency for coda window lengths 20 seconds |
 | Figure 5b. Shows the distributions of Qc values with frequency for coda window lengths 30 seconds |
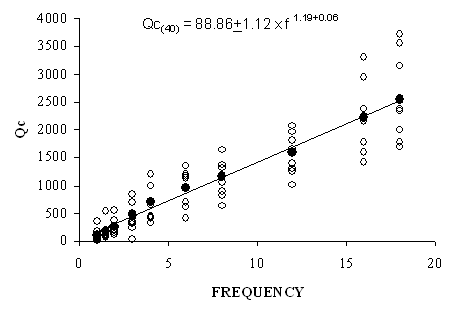 | Figure 5c. Shows the distributions of Qc values with frequency for coda window lengths 40 seconds |
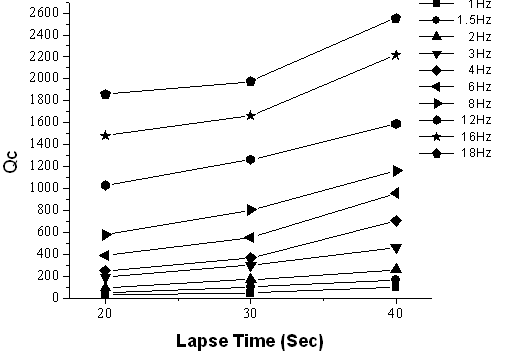 | Figure 6. Figure showing the variation of Qc values with lapse time of coda window length |
5. Conclusions
- This study suggests that Qc values are frequency dependence in the media through which it propagates. The value of frequency dependence n (> 1) suggests that the media is not homogeneous. Since the media is non-homogeneities, intrinsic and scattering mechanism takes place causing the attenuation of the coda wave amplitudes. Attenuation decreases with depth may indicating that deeper part of the earth’s crust is comparatively homogeneous than the upper most crust.
ACKNOWLEDGEMENTS
- Hearty thanks to Dr. Debajit Hazarika, Scientist – B, Wadia Institute of Himalayan Geology, Dehradun for the intensive support in data analysis and interpretation. I extent my thanks to all the Teaching staff of the Department of Mathematical Science, Tezpur University, Tezpur for their valuable support during my works. I would like to thank the Director, School of Petroleum Technology, Gandhinagar for his support in this work. Finally special thanks to all my family members for their valuable support in my works.
References
| [1] | Frankel, A., McGarr, A., Bicknell, J., Mori, J., Seeber, L., Cranswick, E., 1990. Attenuation of high-frequency shear wavesin the crust: measurements from New York State, South Africaand Southern California: J. Geophys. Res. 95, 17441–17457 |
| [2] | Aki, K. (1969). Analysis of seismic coda of local earthquakes as scattered waves: J. Geophys. Res. 74, 615–631 |
| [3] | Aki, K. (l973). Scattering of P waves under the Montana Lasa: J. Geophys. Res. 78, 1334-1246 |
| [4] | Aki, K. (1980). Attenuation of shear-waves in the lithosphere for frequencies from 0.05 to 25 Hz: Phys. Earth Planet. Inter. 21, 50–60 |
| [5] | Aki, K., and Chouet, B. (1975). Origin of coda waves: Source, attenuation andscattering effects: J. Geophys. Res. 80, 3322–3342 |
| [6] | Aki, K. and Richards, P. (1980). “Quantitative Seismology - Theory and Methods” Vols. 1 and 2, W. H. Freeman, San Francisco |
| [7] | Al-Shukri, H. J. and Mitchell, B. J. (1990). Three dimensional attenuation structure in and around the New Madrid seismic zone: Bull. Seismol. Soc.Amer., 80, 615-632 |
| [8] | Benites, R., Aki K., and Yomogida, K., (1992). Multiple scattering of SH waves in 2-D media with many cavities: Pure Appl. Geophys. 138, 353–390 |
| [9] | Benites, R. A., Roberts, P. M., Yomogida K., and Fehler, M. (1997). Scattering of elastic waves in 2-D composite media I. Theory and test: Phys. Earth Planet Inter., 104, 161-173 |
| [10] | Berteussen, K. A. (1975). Crustal structure and P-wave travel time anomalies at NORSAR: J. Geophys. 41, 71-84 |
| [11] | Biswas, N. N., and Aki, K., (1984). Characteristics of coda waves, Central and south central Alaska,:Bull. Seismol. Soc. Am. 74, 493–507 |
| [12] | Capon, J. (1974). Characterization of crust and upper mantle structure under LASA as a random medium, Bull. Seismol. Soc. Am. 64, 235-266 |
| [13] | Capon, J., and Berteussen, K. A. (1974). A random medium analysis of crust and upper mantle structure under NORSAR: Geophys. Res. Lett. 1, 327-328 |
| [14] | Fang, Y., and Müller, G. (1996). Attenuation operators and complex wave velocities for scattering in random media: Pure Appl. Geophys. 148, 269–285 |
| [15] | Fehler, M., Roberts, P., and Fairbanks, T. (1988). A temporal change in coda wave attenuation observed during an eruption of Mount St. Helens: J. Geophys. Res. 93, 4367–4373 |
| [16] | Fehler, M., Hoshiba, M., Sato, H., and Obara, K. (1992). Separation of scattering and intrinsic attenuation for the Kanto-Tokai region, Japan, using measurements of S-wave energy versus hypocentral distance: Geophys. J. Int.108, 787–800 |
| [17] | Flatté, S. M., and Xie, X.-B. (1992). The transverse coherence function at NORSAR over a wide range of separations: Geophys. Res. Lett. 19, 557-560 |
| [18] | Flatté, S. M., and Wu, R.-S. (1988). Small-scale structure in the lithosphere and asthenosphere deduced from arrival-time and amplitude fluctuations at NORSAR: J. Geophys. Res. 93, 6601-6614 |
| [19] | Frankel, A., and Clayton, R. W. (1986). Finite difference simulations of seismic scattering: Implications for the propagation of short-period seismic waves in the crust and models of crustal heterogeneity: J. Geophys. Res. 91, 6465–6489 |
| [20] | Frankel, A., and Wennerberg, L. (1987). Energy-flux model of seismic coda: Separation of scattering and intrinsic attenuation: Bull. Seismol. Soc. Am. 77,1223–1251 |
| [21] | Gazdag, J., and Sguazzero, P. (1984). Migration of seismic data by phase-shift plus interpolation: Geophysics, 49, 124-131 |
| [22] | Got, J. L., Poupinet, G., and Fréchet, J. (1990). Changes in source and site effects compared to coda Q−1 temporal variations using microearthquakes doublets in California: Pure Appl. Geophys. 134, 195–228 |
| [23] | Gusev, A. A., and Abubakirov, I. R. (1996). Simulated envelopes of nonisotropically scattered body waves as compared to observed ones: another manifestation of fractal heterogeneity: Geophys. J. Int., 127, 49-60 |
| [24] | Hartse, H., Phillips, W. S., Fehler, M. C., and House, L. S. (1995). Single-station spectral discrimination using coda waves: Bull. Seismol. Soc. Am. 85, 1464–1474 |
| [25] | Hoshiba M. (1993). Separation of scattering attenuation and intrinsic absorption in Japan using the multiple lapse time window analysis of full seismogram envelope: J. Geophys. Res. 98, 15809–15824 |
| [26] | Jackson, D. D., and Anderson, D. L. (1970). Physical mechanisms of seismic wave attenuation: Rev. Geophys. Space Phys. 8, 1–63 |
| [27] | Kawahara, J., and Yamashita, T. (1992). Scattering of elastic waves by a fracture zone containing randomly distributed cracks: Pure Appl. Geophys. 139, 121–144 |
| [28] | Kikuchi, M. (1981). Dispersion and attenuation of elastic waves due to multiple scattering from cracks: Phys. Earth Planet. Inter. 27, 100–105 |
| [29] | Igor B. Morozov (2011), Temporal variations of coda Q, an attenuation-coefficient view: Physics of the Earth and Planetary Interiors 187 (2011) 47–55, |
| [30] | doi:10.1016/j.pepi.2011.04.012 |
| [31] | Xie, J., 2010. Can we improve estimates of seismological Q using a new ‘‘geometrical spreading’’ model? Pure Appl. Geophys. 167, 1147–1162, doi: 10.1007/s00024-010-0188-8 |
| [32] | Xie, J., Fehler, M., 2009. Comment on ‘Thirty years of confusion around ‘scattering Q’?’ by Igor B. Morozov, Seismol. Res. Lett., 80, 646–647 |
| [33] | Morozov, I. B., Zhang, C., Duenow, J. N., Morozova, E. A., Smithson, S., 2008. Frequency dependence of regional coda Q: Part I. Numerical modelling and an example from Peaceful Nuclear Explosions: Bull. Seism. Soc. Am., 98, 2615–2628, doi: 10.1785/0120080037 |
| [34] | Carcolé, E., Ugalde, A., 2008. Formulation of the multiple non-isotropic scattering process in 2-D for nonspherical source radiation,: Geophys. J. Int., 174, 1037–1051 |
| [35] | Cormier, V. F. (2011). Seismic viscoelastic attenuation, in: Gupta, H. K. (Ed.), Encyclopaedia of Solid Earth Geophysics: Springer, doi: 10.1007/978-90-481-8702-7, 1279–1289 |
| [36] | Greenberg, R. (2009). Frequency dependence of tidal Q: Astron. J., 698, L42–L45 |
| [37] | Mitchell, B. (2010). Prologue and invitation to participate in a forum on the frequency dependence of seismic Q: Pure Appl. Geophys. 167, 1129, doi 10.1007/s00024-010-0180-3 |
| [38] | Morozov, I. B. (2008). Geometrical attenuation, frequency dependence of Q, and the absorption band problem: Geophys. J. Int., 175, 239–252 |