-
Paper Information
- Next Paper
- Previous Paper
- Paper Submission
-
Journal Information
- About This Journal
- Editorial Board
- Current Issue
- Archive
- Author Guidelines
- Contact Us
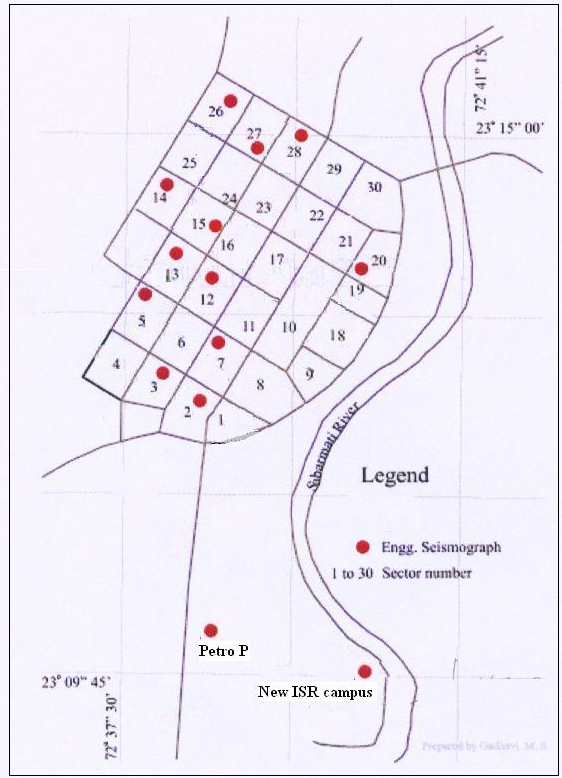
Science and Technology
p-ISSN: 2163-2669 e-ISSN: 2163-2677
2011; 1(1): 17-23
doi: 10.5923/j.scit.20110101.03
Seismic Site Characterization Using Shear Wave Velocities of Gandhinagar City, Gujarat, India
 Abstract
 Reference
 Full-Text PDF
 Full-Text HTML
Jwngsar Brahma
School of Petroleum Technology, Pandit Deendayal Petroleum University, Gandhinagr, 382007, India
Correspondence to: Jwngsar Brahma , School of Petroleum Technology, Pandit Deendayal Petroleum University, Gandhinagr, 382007, India.
| Email: |  |
Copyright © 2012 Scientific & Academic Publishing. All Rights Reserved.
The recent devolvement in geophysical methods in particular Multi-channel Analysis of Surface Wave (MASW) technique is widely used for determining the 1D and 2D shear wave velocity of the subsurface materials. Though there are three types of MASW technique, only the data acquisition, data processing and inversion of active MASW technique are discussed in this paper. An attempt has been made to measure the shear wave velocities and hence site characterization using active MASW technique of the Gandhinagar City for engineering application. The active MASW survey consists of 24-channel Geode Seismograph with 24 geophones of 4.5Hz capacity, sledge hammer of 10kg with switch, hammer plate, and supporting software is used for the survey of Gandhinagar City. The survey points have been selected in such a way that the result represents the soil characteristics of the entire site; here the receivers are placed in linear array. Here Surfseis software is used for the data analysis. The Surfseis is designed to generate Vs of either 1D or 2D format using a simple three steps procedure: preparation of a Multichannel record, dispersion-curve analysis and inversion. The shear wave velocities (Vs) of Gandhinagar City increases with depth from 250 m/s to 450 m/s and the harmonic mean (Vs30) of Vs is in the range 250 m/s to 350 m/s up to 30 meter depth. The soil condition of Gandhinagar City is stiff soil and can not possess liquefactions.
Keywords: Earthquake, Seismic Waves, MASW, SASW, Engineering Seismograph
Cite this paper: Jwngsar Brahma , "Seismic Site Characterization Using Shear Wave Velocities of Gandhinagar City, Gujarat, India", Science and Technology, Vol. 1 No. 1, 2011, pp. 17-23. doi: 10.5923/j.scit.20110101.03.
Article Outline
1. Introduction
- The Indian sub-continent is highly prone to multiple natural disasters including earthquakes, which is one of the most destructive natural hazards with the potentiality of inflicting huge loss to lives and property. Earthquakes pose a real threat to India with 59% of its geographical area vulnerable to seismic disturbance of varying intensities including the capital city of the country. Almost the entire Northeast region, Northern Bihar, Himachal Pradesh, Jammu & Kashmir and some parts of Kutchch are in seismic zone V, while the entire gangetic plain and some parts of Rajasthan are in seismic zone IV. India has experienced some of the most intense earthquakes in the world and is also one of the most earthquake prone countries in the world. Data from 1897-1991 shows that an average of three earthquakes of magnitude 6.0 or more occur in India every year and the high degree of seismic vulnerability of the country poses a real threat to the millions of its people.The historical Shillong earthquake of magnitude 8.7(Mw) was occurred in the year of 1897, 12 June. About 1.600 people death and various structures are completely damage.Again in the year of 1950, August 15 another earthquake of magnitude 8.7 (Mw) was occurred which is known as Assam earthquake. About 1,526 people death and many structures were totally damaged. These two historical earthquakes reached the highest intensity scale X. Therefore entered NE states are kept in the seismic zone V. During those historical earthquake people observed that, most of the people death due to the collapsing the man made structure. In the span of last 15 years, India has experienced six earthquakes of moderate intensity. Although moderate in intensity, these earthquakes caused considerably high degree of losses to human life and property, which highlights the vulnerability of the population and infrastructure to earthquakes and the inadequacy of preparedness measures in the country. The Lattur earthquake of 1993 and the Bhuj earthquake of 2001 which caused extensive damage to lives and properties further highlighted the need to focus upon long-term seismic mitigation and preparedness in order to reduce the human and economic losses due to earthquakes. However, the September 1993 earthquake that struck Maharashtra State in Central West India that claimed nearly 12,000 lives, was not a particularly strong event, but caused such devastation because of other factors. Another earthquake also struck Central India in May 1997, but fortunately not on such a devastating scale. The 26th January Bhuj Earthquake was the most devastating one which scaled very high in terms of loss of life and property. 13,805 human lives were lost, and over 1, 67,000 persons were injured in the earthquake. This earthquake is the first major earthquake to hit an urban area of India in the last 50 yrs.During the historical earthquakes and recent earthquakes people observed that most of the losses and deaths occurred due to the man made structures. Therefore people say that “Earthquake does not kill the people but man made structures kill the people”. Now a day people realized that, to minimize the damage and the death we should designed our structure according to their dynamic properties and soil conditions. Therefore the seismic study of a region becomes very important for urban development of a country. Many geoscientists are using many seismic methods to study the soil characteristics from last decay. Multi-channel Analysis of Surface Waves (MASW) is one of the techniques to estimate the shear wave velocities (Vs) and soil characteristics of a region. To design a perfect master plane city, we have to prepare the microzonation map of that region according to their soil conditions. In the modern world people prepare the MASW technique to estimate the shear wave velocities (Vs) and soil characteristic of a region. In the MASW technique the data acquisition and data processing are very easy and less time consuming as compare to the other seismic methods. The output of the MASW technique is also good and the survey also less expensive as compare to the other seismic method. We can analyze the shear wave velocity (Vs) and soil characteristics of a region up to 30 meters depth, up to which depth the analysis of geological condition of a region is necessary of building foundation. Since the technique is easy to collect and processing the data, less expensive and good output, therefore the study of this technique is very important in the modern world. Here in this paper the Multi-channel Analysis of Surface Waves (MASW) technique and its applications are discussed, to estimate the shear wave velocities (Vs) and soil characteristics of the Gandhinagar City. In this paper 14 sites of the Gandhinagar city are considered for the survey and used active source and the Common Midpoint (CMP) method as used in the reflection survey for data acquisition. Taking these surface waves data from the 14 sites, the shear wave velocities (Vs) are estimated and hence harmonic mean (Vs30) of Vs is calculated up to 30 meters depth of the Gandhinagar city. The Seismodule Controller software is used for data acquisition and SurfSeis software is used for data analysis.Dynamic behavior of soil has been evaluated from the shear wave velocity, which is an important parameter for seismic site characterization and determination of shear modulus. A dynamic property at low strain level for site soil layer has been determined using shear wave velocity from MASW technique. The shear wave velocity as obtained from the MASW technique has been used to evaluate shear modulus for the soil. The seismic site characterization for calculating seismic hazard is usually carried out based on the near surface shear wave velocity values. The average shear wave velocity for the 30m depth of soil is referred to as VS 30 .The average shear wave velocity of the upper 30m (VS 30) should be computed in accordance with the following expression
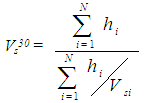 | (1) |
2. Study Region
- Gandhinagar lies 72037ʹʹ30ʹE to 72041ʹʹ15ʹE longitude and 23009ʹʹ45ʹ N to 23015ʹʹ00ʹN latitude and lies on banks of the Sabarmati River, Gandhinagar is known as second planed city in India after Chandigarh. Gandhinagar is divided in 30 sectors, whose total area is 57 square kilometres and total population is 1, 32,000, which is the capital of Gujarat, west central India. Major tourist attraction of Gandhinagar is the famous Akshardham temple, other attraction are Children Park, Sarita Udyan, Indroda Park and Capital Complex. The major places in Gandhinagar are Info City, Suman Tower etc. The satellite image of the Gandhinagar City is shown in the following Figure 1. The city Gandhinagar is situated in tectonically controlled, 50km wide Cambay Basin, which is characterized by two north-south trending faults named as East Cambay Fault (lying close to Gandhinagar) and West Cambay Fault. Some small earthquakes in the historical past are listed to have felt at Ahmedabad that might have occurred along East Cambay fault or even as far way as Kachchh. The West Cambay fault is relatively more active. A maximum magnitude of 6 can be assigned along these faults. The basin is fill up with huge thickness of Tertiary and Quaternary sediments constituting alluvial plains of Mainland Gujarat. Thickness of Quaternary sediments within the basin is changing from 250-400m. Thickness of these sediments subsurface of Gandhinagar City is expected to be around 250m. The sediments are mainly Aeolian origin. The detail soil classification of Gandhinagar city is given in the Table 2. Lithological logs divulge the presence of alternating argillaceous and aranaceous layers near surface, which mainly consists of loose sand and slit distinguished by calcrete lenses. Thickness of loose sand is varying from 3-10 m whereas calcreate are 1-2m thick.Though, terrain is significantly flat slight undulations in the area away from Sabarmati River are result of Aeolian active whereas ravines in proximity to river bank are result of distinctive river dynamics.
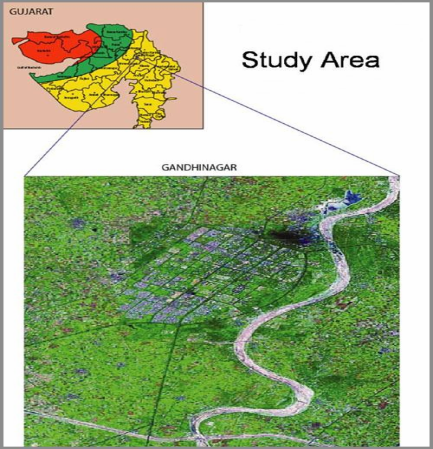 | Figure 1. Satellite image of the Gandhinagar City. |
3. Data Acquisition
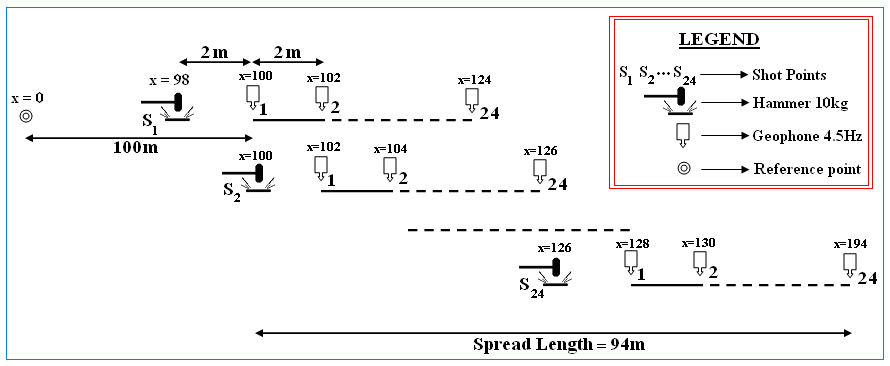
- Data was acquired at 14 sites in Gandhinagar area as shown in the following Figure 3, Gujarat, India using standard CMP roll along technique to achieve a continuous shot gather. At each location 24 shots were taken at 2m shot interval along the profile. For every shot 24 channel data has been recorded (Figure 2). Vertical staked three impact of 10kg hammer on a square plate was used as a source. Seismodule Controller Software (SCS) of Geometrics Inc., USA was used to acquire the data. Twenty four single 4.5 Hz geophones spaced 2m apart along the profile line responded to frequency from 5-60 Hz in a 24 channel seismic shot gather. At all the location 2m geophone interval with 2m near offset was used. Acquisition parameters geometry of MASW was selected to optimize the image of subsurface layers. Depth of interest was 30m below ground level.The complete profile picture of the survey is shown in figure 4 and the acquisition parameters used for the MASW survey are shown in the Table. 5. The source to nearest receiver offset at 2m and source to farthest receiver offset was 48m.This recording geometry provided the optimum spread and characteristics for examining subsurface layers up to 30m. The locations of the MASW survey of Gandhingar are shown in the Figure 3.
|
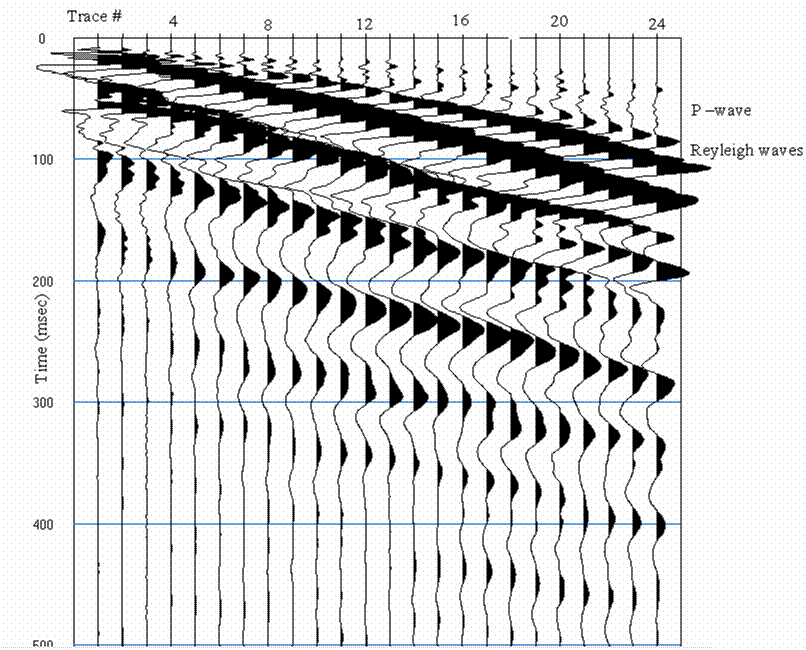 | Figure 2. A twenty four channel shot gather |
 | Figure 3. The locations of the Engineering Seismograph survey for MASW technique |
 | Figure 4. Layout of the MASW survey profile in at Gandhinagar city |
4. Data Analysis and Result
- The shear wave velocities (Vs) are calculated by dispersion analysis of surface wave ie Rayleigh waves using SurfSeis software. The shear wave velocities (Vs) can be calculated from the rayleigh wave velocities by the relation, shear wave velocity =
 × [Rayleigh wave velocity]. Once the shear wave velocities (Vs) are calculated, then we can calculate the harmonic mean of shear wave velocities (Vs30). Once the Vs30 is calculated then we can characterizes the soil conditions of the region up to 30 meter depth The shear wave velocities (Vs) of different sectors/ location of the Gandhinagar city with corresponding RMS error are shown in the following [Figure 5 (a) to 5(n)]. The values of Vs30 of different sectors/ location of the Gandhi agar city are given in the Table 3.
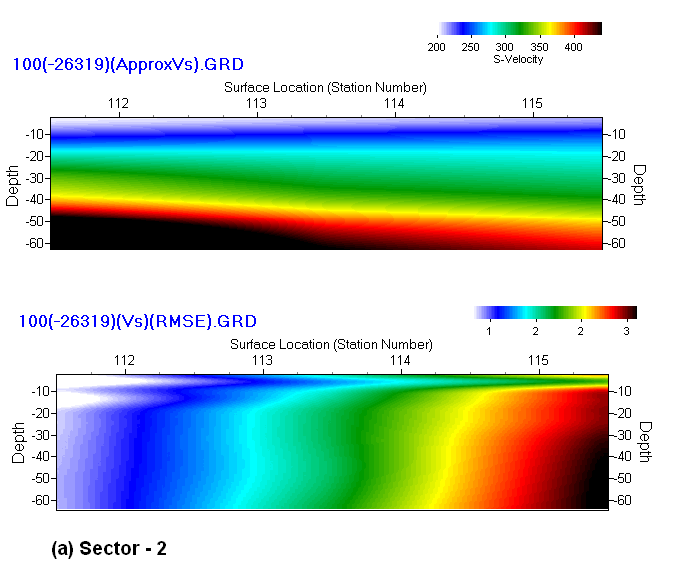 | Figure 5(a). The shear wave velocities (Vs) with corresponding RMS error of sector – 2 |
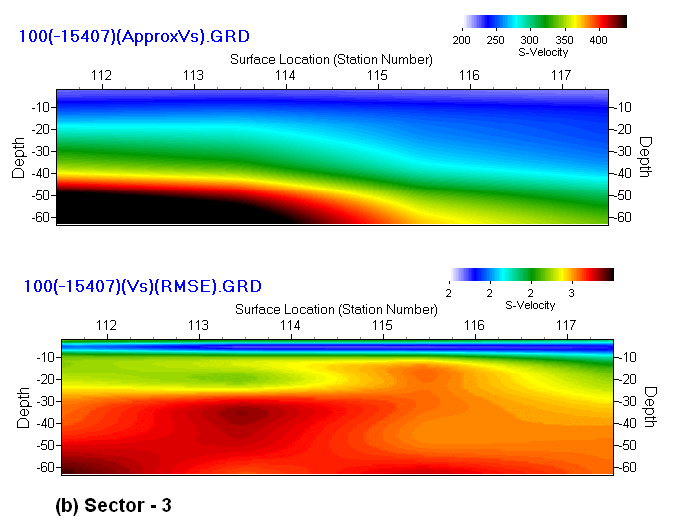 | Figure 5(b). The shear wave velocities (Vs) with corresponding RMS error of sector – 3 |
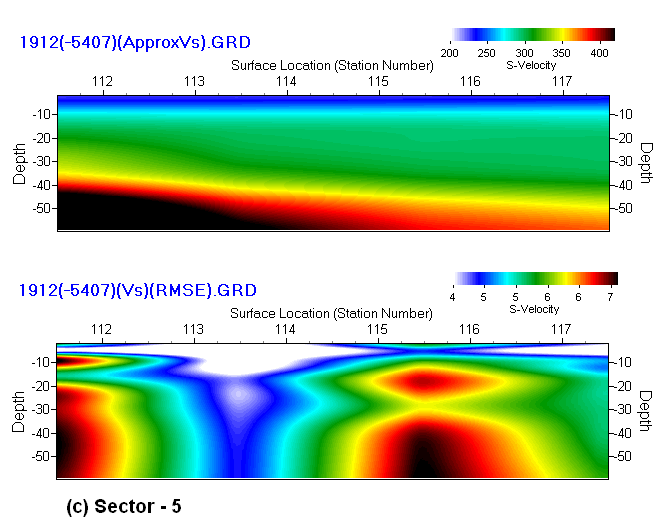 | Figure 5(c). The shear wave velocities (Vs) with corresponding RMS error of sector – 5 |
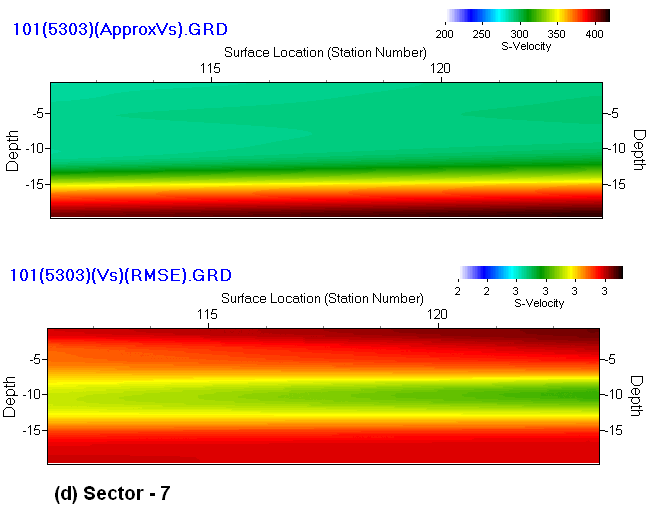 | Figure 5(d). The shear wave velocities (Vs) with corresponding RMS error of sector – 7 |
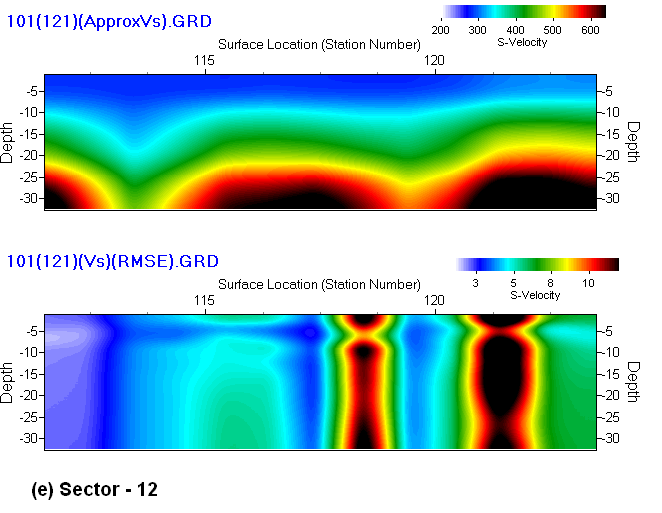 | Figure 5(e). The shear wave velocities (Vs) with corresponding RMS error of sector – 12 |
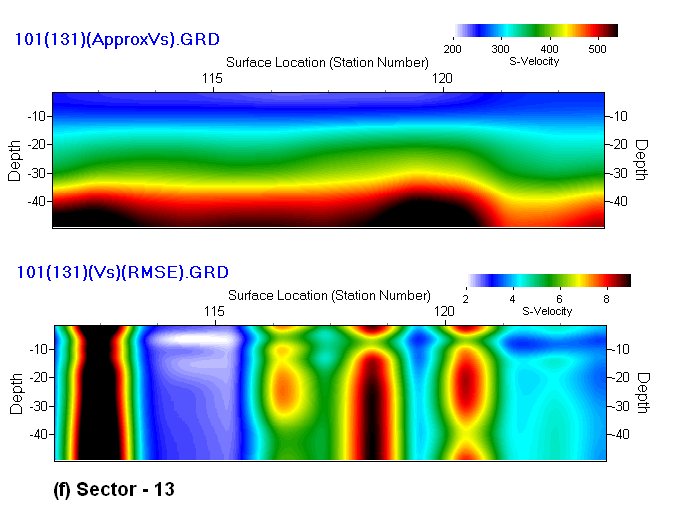 | Figure 5(f). The shear wave velocities (Vs) with corresponding RMS error of sector – 13 |
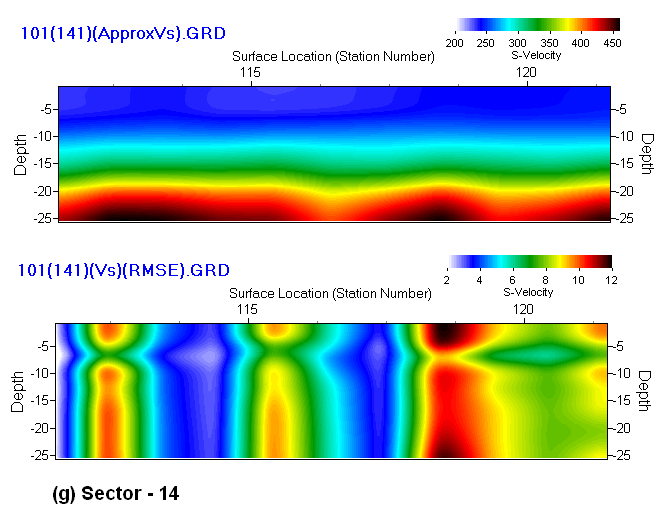 | Figure 5(g). The shear wave velocities (Vs) with corresponding RMS error of sector – 14 |
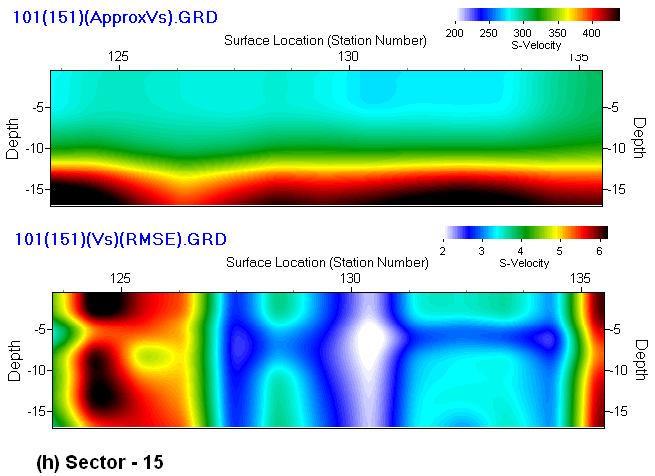 | Figure 5(h). The shear wave velocities (Vs) with corresponding RMS error of sector – 15 |
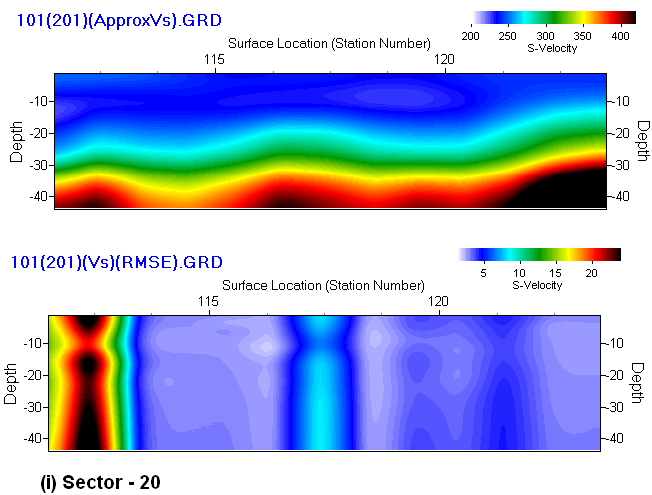 | Figure 5(i). The shear wave velocities (Vs) with corresponding RMS error of sector – 20 |
 | Figure 5(j). The shear wave velocities (Vs) with corresponding RMS error of sector – 26 |
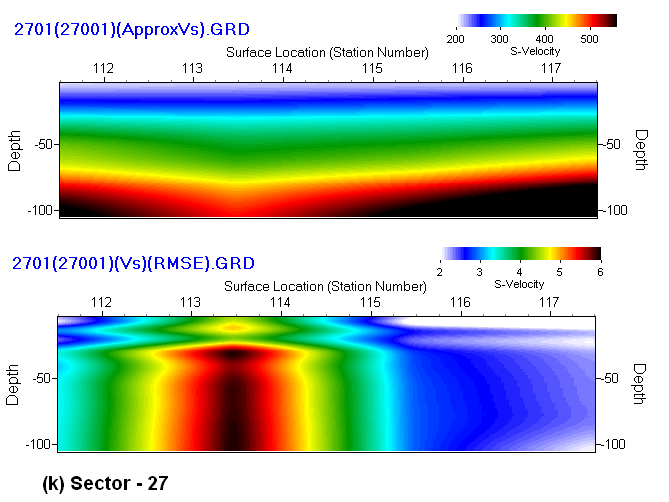 | Figure 5(k). The shear wave velocities (Vs) with corresponding RMS error of sector – 27 |
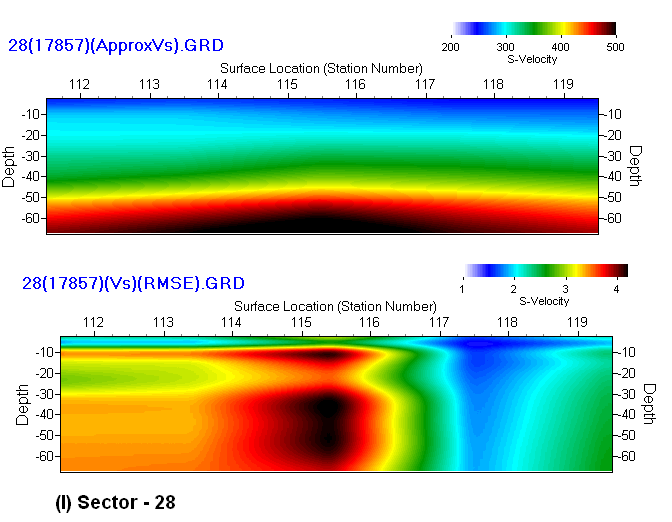 | Figure 5(l). The shear wave velocities (Vs) with corresponding RMS error of sector – 28 |
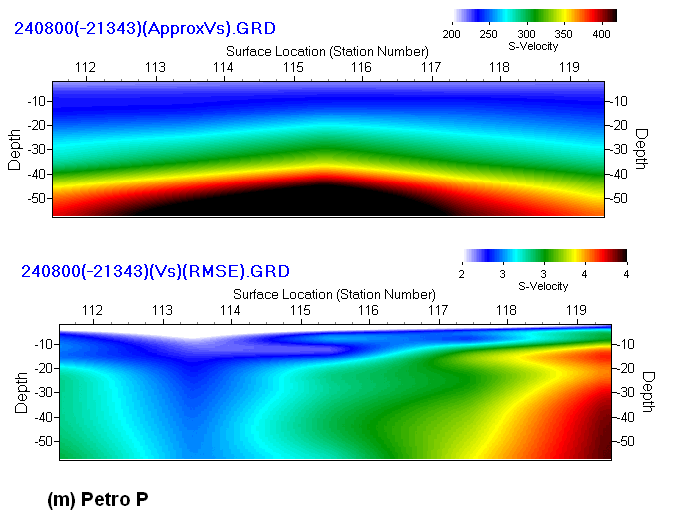 | Figure 5(m). The shear wave velocities (Vs) with corresponding RMS error of Petro P |
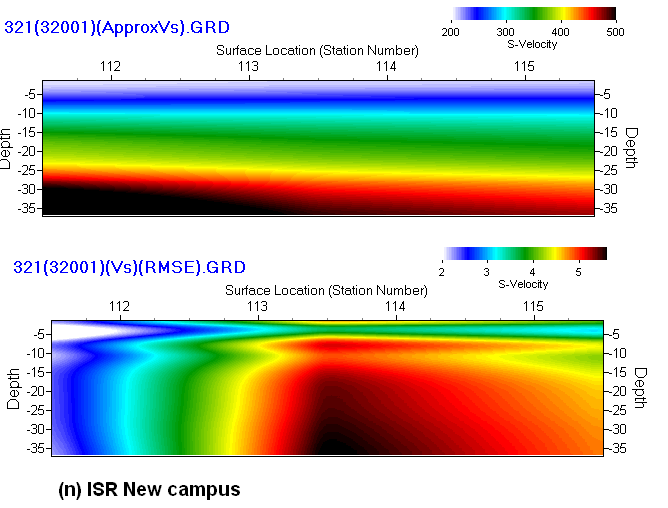 | Figure 5(n). The shear wave velocities (Vs) with corresponding RMS error of ISR campus |
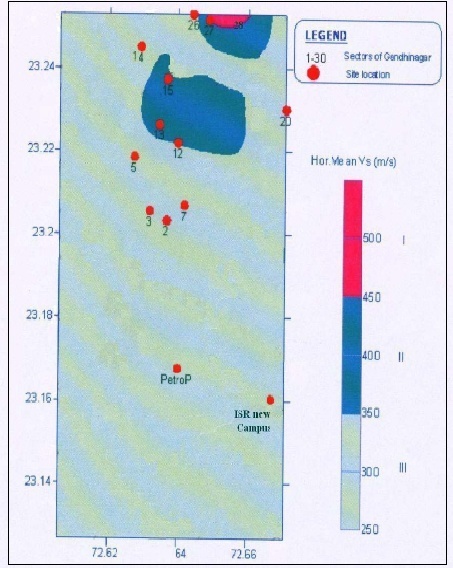 | Figure 6. Seismic Hazard Zoning of Gandhinagar Based on Vs30 up to 30 meter depth |
|
5. Conclusions
- The Vs30 of the Gandhinagar city is found in the range 250 to 350 m/sec broadly and two patches are found that more than 350 to 450 m/sec velocity. In Gandhinagar there is a 1 meter thick silt top layer below which fine to coarse grained sand layer exist. It is inferred that soil does not possess liquefaction potential as water table is 80 meter depth even near the Sabarmathi river basin. From mechanical property test it is inferred that Gandhinagar area has good bearing capacity soil. The MASW technique is a fast economical and useful in defining the microzonation which is essential and seismic mitigation.
ACKNOWLEDGEMENTS
- Hearty thanks to Dr. B.K. Rastogi, DG, Institute of Seismological Research, Gandhinagar for the opportunities giving me to work in this challenging topics. I extent my thank to all the scientific staff of Institute of Seismological Research, Gandhinagar for their valuable support during my works. I would like to thank the Director, School of Petroleum Technology, Gandhinagar for his support in this work. Finally special thanks to all my family members for their valuable support in my works.
References
| [1] | McMechan, G.A., and Yedlin, M.J., 1981, Analysis of dispersive waves by wave field transformation: Geophysics, 46, 869-874. |
| [2] | Miller, R.D., Xia, J., Park, C.B., and Ivanov, 1999, Multichannel Analysis of Surface Waves to map bedrock, The Leading Edge, 18(12) , 1392-1396. |
| [3] | Park, C.B., Miller, R.D., and Xia, J., 1999, Multichannel Analysis of Surface Waves (MASW): Geophysics, 64, 800-808. |
| [4] | Park, C.B., Xia, J., Miller R.D.,, 1998a, Ground roll as a tool to image near-surface anomaly: 68th Ann. Internet. Mtg., Soc Expl. Geophysics Expanded Abstracts, 874-877.. |
| [5] | Xia, J., Miller, R.D., and Park, C.B., 1999 Estimation of near-surface velocity by inversion of Rayleigh waves, Geophysics, 64,691-700. |
| [6] | Park, C.B., Miller, R.D., and Xia, J., 2001, Offset and resolution of dispersion curve in multichannel analysis of surface waves (MASW): Proceeding of the SADEEP 2001, Denver, Colorado, and SSM-4. |
| [7] | Claerbout , J.F, 1985, Fundamentals of geophysical data processing: Blackwell Scientific publication, California 274 pp. |
| [8] | Dobrin, M.B., and Savit , C.H., 1988, Introduction to geophysical prospecting , 4th edition : McGraw-Hill, Inc., New York, 867 pp. |
| [9] | Tokimastu, K., Tamura, S., and Kojima , H., 1992 , Effect of multiple modes on Rayleigh wave dispersion characteristics : Journal of Geotechnical Engineering , American Society of Civil Engineering , V. 118,no. 10, 1529-1543. |
| [10] | Sheriff, R.E., and Geldart , L.P., 1982, Exploration Seismology, Volume -1: Cambridge University Press, 253 pp. |
| [11] | Xia, J., Millar, R.D., Park, C.B., 2000, Advantages of calculating shear wave velocity from surface waves with higher modes: SEG, expanded Abstracts. |
| [12] | Bullen, K.E., 1963, An introduction to the theory of seismology: Cambridge University press. |
| [13] | Nazarim, S. and Desi, M.R., 1993, Automated surface waves method: Field testing: Journal of Geotechnical Engineering, Vol. 119, p1094-1111. |
| [14] | Park, C.B.,Xia, J.,and Millar, R.D., 1998b, imaging dispesion curves of surface waves on multi-channel record: 8th Ann. Internatinal Mtg., Soc. Expl. Geophys., Expanded Absrtact, 1377-1380. |
| [15] | P.Anbazhagan and T.G. Sitharam, 2008, Site characterization of Bangalore using a geophysical methd: Geotechnical and Geophysical Site Characterization – Huang & Mayne (ends) © 2008 Taylor & Francis Group, London |
| [16] | P.Anbazhagan and T.G. Sitharam, 2008, Site Characterization and Site Response Studies Using Shear Wave Velocity: JSEE: Summer 2008, Vol. 10, No. 2 |
| [17] | A. K. Mahajan and Nitesh Rai, 2011, Using MASW to map depth to bedrock underneath Dehradun fan deposits in NW Himayala: Current Science, Vol. 100, No.2, 25 January 2011. |
| [18] | Anbazhagan and T.G. Sitharam,2008, Seismic microzonation of Bangalore, India: J. Earth Syst. Sci. 117, S2, November 2008, pp. 833–852 |
| [19] | Dr D Neelima Satyam and Dr K S Rao, 2008, Seismic Site Characterization in Delhi Region using Multi channel Analysis of Shear wave Velocity (MASW) Testing: 2008 EJGEVol. 13, Bund. L |