-
Paper Information
- Next Paper
- Previous Paper
- Paper Submission
-
Journal Information
- About This Journal
- Editorial Board
- Current Issue
- Archive
- Author Guidelines
- Contact Us
Science and Technology
p-ISSN: 2163-2669 e-ISSN: 2163-2677
2011; 1(1): 7-16
doi: 10.5923/j.scit.20110101.02
Aqueous Two Phase Systems for the Recovery of Biomolecules – A Review
 Abstract
 Reference
 Full-Text PDF
 Full-Text HTML
Selvaraj Raja , Vytla Ramachandra Murty , Varadavenkatesan Thivaharan , Vinayagam Rajasekar , Vinayagam Ramesh
Department of Biotechnology, Manipal Institute of Technology, Manipal, Karnataka, 576104, India
Correspondence to: Selvaraj Raja , Department of Biotechnology, Manipal Institute of Technology, Manipal, Karnataka, 576104, India.
| Email: |  |
Copyright © 2012 Scientific & Academic Publishing. All Rights Reserved.
Aqueous two phase system (ATPS) is a liquid – liquid extraction method which employs two aqueous phases having applications in the field of biotechnology for the separation and purification of biological materials such as proteins, enzymes, nucleic acids, virus, antibodies and cell organelles. This review discusses the basic principles of ATPS, the factors affecting partitioning, optimization by design of experiments and the recent applications like extractive fermentation, membrane supported liquid – liquid extraction and aqueous two phase floatation. A comparative study between ATPS and other conventional methods is also discussed. The emphasis is given to PEG/salt two-phase systems because of the low cost of the system.
Keywords: Aqueous Two Phase System, Binodal Curve, Tie Line, Mabs, Waste Water, DOE, MEMEX, ATPF
Cite this paper: Selvaraj Raja , Vytla Ramachandra Murty , Varadavenkatesan Thivaharan , Vinayagam Rajasekar , Vinayagam Ramesh , "Aqueous Two Phase Systems for the Recovery of Biomolecules – A Review", Science and Technology, Vol. 1 No. 1, 2011, pp. 7-16. doi: 10.5923/j.scit.20110101.02.
Article Outline
1. Introduction
- Downstream processing of biomolecules usually encompasses four stages namely, recovery, isolation, purification and polishing (RIPP). Among these four steps, purification step itself makes up more than 70% of the total downstream processing costs[1]. The conventional methods of purification of biomolecules involve several steps of unit operations and hence are usually expensive. In each step, some quantity of target molecule is lost resulting in a big overall loss[2]. Aqueous two phase system (ATPS) is an alternative method for separation of biomolecules which reduces number of steps and thus reduces the overall cost[3]. It is a liquid – liquid extraction method which makes use of two aqueous phases. The two aqueous phases consists of two water-soluble polymers or a polymer and a salt. It is a potential technique that has applications in the field of biotechnology for the separation and purification of biological materials such as proteins, enzymes, nucleic acids, virus, antibodies and cell organelles. The simple process and low cost of phase forming materials allow this method for large-scale purification also[4]. In this review, the emphasis is given to PEG/salt two-phase systems because of the low cost of the system[5].
2. Aqueous Two Phase Systems
- Aqueous two phase partitioning of biomolecules is a well established process which was first introduced by Albertsson[2]. It has many advantages like simple and benign technique (presence of more than 80% water in both phases), rapid separation with little denaturation (volatile organic components are not used), rapid mass transfer (low interfacial tension), selective separation (affinity partition) and easy scale up[2]. Therefore, ATPS has been applied in several fields of biotechnology such as recovery of proteins, enzymes, biopharmaceuticals and extractive fermentation. In general, there are two major types of ATPS available, viz., polymer/polymer (e.g Polyethylene glycol/Dextran) and polymer/salt (e.g Polyethylene glycol/phosphate) system. It is formed by mixing two different water-soluble polymers or one water-soluble polymer and salt in water. When the limiting concentrations are exceeded, two immiscible aqueous phases are formed[2]. The limiting concentrations depend on the type of phase forming components and on the pH, ionic strength and temperature of the solution.Polyethylene glycol (PEG) is used as one of the phase forming polymers in ATPS because it is available at low cost and forms a two-phase system with other neutral polymers as well as salts. In addition to these, PEG can significantly enhance the refolding of proteins to recover the activity[6]. The selection of ATPS depends on the type of biomolecule and economic considerations. Because of the high cost and high viscosity of the polymer/polymer system, the aqueous two phase polymer/salt systems are preferred over the polymer/polymer systems. Hence this review considers only ATPS based on polymer/salt systems. Moreover, polymer/salt systems have larger differences in density, greater selectivity, lower viscosity, lower cost and the larger relative size of the drops[7]. Phosphates and sulfates are the commonly used salts in polymer/salt ATPS. But this leads to high phosphate and sulfate concentration in the effluent streams and hence an environmental concern. Nowadays, use of citrate salts as a phase forming component with PEG is preferred since citrate salts are biodegradable and nontoxic[8].
2.1. Phase System and Properties
- ATPS has a unique phase diagram under a particular set of conditions such as pH and temperature[9]. The phase diagram provides information about concentration of phase forming components required to form a two-phase, the concentration of phase components in the top and bottom phases, and the ratio of phase volumes. In Fig. 1, the binodal curve TCB divides a region of component concentrations that will form two immiscible aqueous phases (above the curve) from those that will form one phase (below the curve). The three systems X, Y and Z differ in their initial compositions and in the volume ratios. However, they all have the same top phase equilibrium composition (TPEG,TSalt) and the same bottom phase equilibrium composition (BPEG, BSalt). This is because they are lying on the same tie-line (TB), whose end points determine the equilibrium phase compositions and lie in a convex curve called as the binodal curve. This curve represents the separation between the two immiscible phases.The binodal data is required for the design of ATPS extraction processes and development of models that predict partitioning of biomolecules.
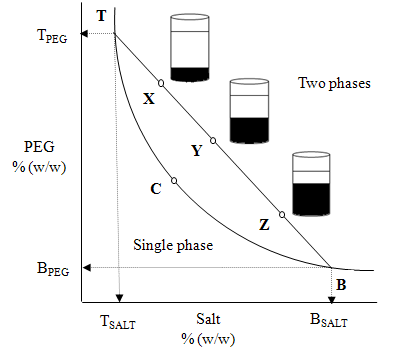 | Figure 1. Binodal curve. In the figure, TCB = Binodal curve, C = critical point, TB = Tie line, T = composition of the top phase, B = composition of the bottom phase, and X, Y and Z = total composition of ATPS. |
 where V and ρ are the volumes and densities of the top (t) and bottom (b) phases and XB & XT are the segment lengths of the tie line as shown in Fig.1.TLL and the slope of the tie-line (STL) can be related to the equilibrium phase composition as follows:
  | (1) |
 | (2) |
2.2. Correlations for Binodal Curve and Tie-Lines
- In order to understand the partitioning of biomolecules, the composition of the two phases should be known. There are several correlations available to represent the liquid – liquid binodal data of the PEG/salt systems and a few are listed in Table 1.
|

 | (3) |
 | (4) |
2.3. Batch Extraction
- One of the simplest procedures of this technique is the one-step batch extraction. The phase system is prepared and the mixture to be separated is added. After mixing, phase separation is accomplished either by settling under gravity or by centrifugation. The phases are separated and analyzed or used to recover the separated components of the initial mixture. As shown in Fig. 2, the target product (e.g. biomolecule) should be concentrated in one of the phases and the contaminants in the other. In many cases, recovery and concentration of product with yields exceeding 90% can be achieved using a single extraction step. When single-stage extraction does not give sufficient recovery, repeated extractions can be carried out in a chain or cascade of contacting and separation units[16]. The liquid partitions into two phases, each containing more than 80% water. When a crude biomolecules are added to these mixtures, biomolecules and cell fragments partition between the phases; by selecting appropriate conditions, cell fragments can be confined to one phase as the target biomolecule partitions into the other phase. The partitioning of biomolecules between phases mainly depends on the equilibrium relationship of the system. The partition coefficient is defined as,
 | (5) |
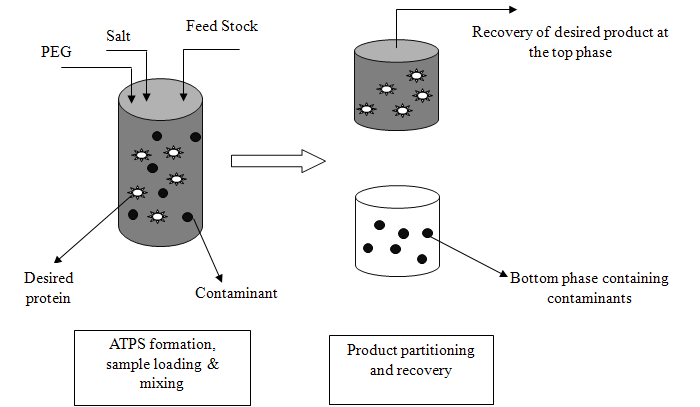 | Figure 2. Batch Extraction. |
 | (6) |
 | (7) |
 | (8) |
 | (9) |
3. Factors Affecting Partitioning of Biomolecules in ATPS
- Partition coefficients of biomolecule are important in the design of an extraction process employing ATPS. Several approaches have been explored to assess the most important parameters determining partitioning behavior using simplified expressions obtained by grouping the various contributing factors. According to Albertsson[2], the partition coefficient K is a function of several interacting properties and can be expressed by the equation,
 | (10) |
3.1. Molecular Weight of Polymer
- The molecular weight (MW) of the polymer used influences the partitioning of proteins. The higher the molecular weight of the polymers, the lower is the polymer concentration required for phase separation. As polymer concentration increases, differences in density, refractive index, and viscosity between the phases increase. Binodal curves shift towards the origin with the increase in PEG molar mass[17]. In PEG/Salt system, the partitioning of biomolecules is governed by volume exclusion effect (polymer-rich) and salting-out effect (salt-rich). The systems with high concentration or high molecular weight polymer and high salt concentration will result in partitioning of biomolecules at the inter phase due to the influence of both volume exclusion and salting out effect[18]. In PEG/Salt systems, the increase in K may be because of the following: • If the MW of PEG is lower, the interfacial tension is lower between the two phases which increases K[19].• If salt concentration is high, the ionic strength increases in the bottom phase which improves biomolecule partition to the top phase.• If the PEG concentration is high, number of polymer units involved in the bio-molecular partitioning also increases and hence more biomolecules partition into the PEG phase due to hydrophobic interaction between the biomolecule and PEG[20].
3.2. pH
- The pH of the system affects the partitioning because it may alter the charge of the solute or it may alter the ratio of the charged molecules. The net charge of the protein depends on whether the pH is greater than pI (negative), lesser than pI (positive), or equal to pI (zero). Several researchers reported that at higher pH, the negatively charged biomolecule prefers the top phase and partition coefficient increases. It may be because of the electrostatic interactions between the biomolecule and PEG units[21]. Moreover, the change in pH affects the phase composition which in turn affects the partitioning behavior. The two phase area expands with an increase in temperature and pH. The binodal curves become more asymmetric and close to origin with an increase in molecular weight[13].
3.3. Presence of Neutral Salts
- The presence of neutral salts such as NaCl does not drastically affect the liquid-liquid equilibrium data of ATPS. But high salt concentration (greater than 1M) alters the phase diagram[2]. The presence of NaCl in ATPS alters partition coefficient because of the differential distribution of the salt ions between the phases. The added salt contains ions with different hydrophobicities. The hydrophobic ions force the partitioning of their counter ions to the more hydrophobic phase and viceversa[12]. The salting-out effect forces the biomolecules to move from salt-rich phase to the PEG-rich phase[22].
3.4. Surface Properties of Biomolecules
- A linear relationship was developed between the hydrophobicity of the proteins and partition coefficient by [21,23,24]
 | (11) |
 | (13) |
 | (14) |
4. Instrumentation for ATPS
- The construction of the binodal curve, determination of the phase composition and the physical properties of the aqueous phases of the ATPS can be obtained through the use of a number of sophisticated analytical tools including Atomic Absorption Spectroscopy (AAS), Flame Atomic Absorption Spectrometer (FAAS), HPLC, size exclusion chromatography, flame photometer etc., (Table 2.)
|
5. Optimization of ATPS
- It is well known that the recovery of biomolecules from a mixture by ATPS is influenced by a number of factors such as phase components and their concentration, TLL, pH, temperature, and sample concentration. In order to optimize ATPS, many number of experiments have to be conducted which is laborious and increases the overall cost. Moreover, the conventional method of optimization of a process is by “one variable at a time (OVAT)” in which significant factors of the process are identified and later they are altered by keeping all other factors constant. This OVAT is inefficient because it involves many experiments that are time consuming and laborious.
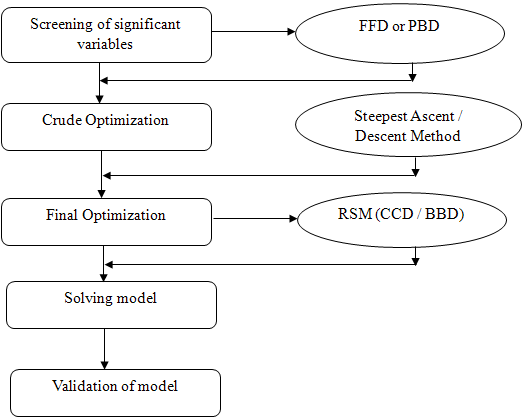 | Figure 3. General steps in DOE. |
5.1. Screening
- The first step is the screening of significant process variables (factors, k) that affect the response (yield or purification factor). This is done by two methods viz., two-level full factorial design (FFD) and Placket – Burman design (PBD). In these methods, all the factors are fixed at only 2 levels, high (+) and low (–). In FFD, 2k number of experiments is carried out at different combinations of the factors. For example, if number of factors k = 2, then the number of experiments to be conducted is 22 = 4 at (–,–), (+,–), (–, +) and (+, +) combinations. Even though no single pair of conditions is replicated, the main effect of each factor is measured at 2 levels of the other factor. This hidden replication in this factorial design increases the accuracy of the results. Moreover, it is possible to find out the interaction effect among the factors in this design. If the number of factors is more, the number of experiments in full factorial design (2k) will be more. Therefore, fractional factorial designs (2k-1, 2k-2 and 2k-4) are introduced, in which the number of total experiments are reduced to ½, ¼ and ⅛ of full factorial design. Another extensively used screening method is the PBD, which is the irregular fractions of 2k designs and is constructed with increments of 4 runs. It is possible to study six factors using a PBD with only 12 runs in contrast to FFD which requires 64 runs[37]. Since the number of experiments is reduced drastically in PBD, it is majorly used as a screening experiment. The significant factors are analyzed by calculating the main effects of each factor and from ANOVA table.
5.2. Crude optimization
- The next step is to find out the optimum level of these screened significant factors. First, it is necessary to make sure that we are near the optimal region. It is done by checking the curvature of the model by addition of few center point experiments to the screening design (FFD or PBD). If significant difference is present between the average response of the screening design experiments and center point experiments, curvature exists. It implies that the response is in the vicinity of the optimum and can be moved on to the final optimization phase. If there is no difference (no curvature) then the response is far away from the optimum, in which case steepest ascent (if the objective is to maximize the response) or steepest descent (if the objective is to minimize the response) experiments are performed to reach the general vicinity of the optimum[36].Steepest ascent/descent experiments are used to determine the direction of the experiment. These experiments have to be started at the center point of the screened significant design factors and the levels of the each factor are increased or decreased with respect to their magnitude of the main effect. This step input size is determined by the researcher based on process knowledge or practical considerations. These experiments have to be conducted until no further increase in response is observed. The maximum response point of these experiments can be taken as general vicinity of the optimum. These points serve as the center points for the final optimization phase.
5.3. Final Optimization
- The final optimization is done by response surface methodology (RSM). It is used to design and collect the experimental data which allows fitting a quadratic equation for smoothing and prediction of the response. Using regression analysis, the best equation for description of the data is selected and the response is examined via surface or contour plots. There are two types of RSM viz., Central Composite Design (CCD) and Box Behnken Design (BBD). CCD is a kind of FFD to which a few center points and star points (α) are added. The value of α is calculated by fourth root of total number of factorial points.BBD has two advantages over the CCD, • Less number of experiments, for example, for k = 3, total number of experiments in CCD is 20 and just 15 in BBD. • Factor levels are only 3 in BBD as compared to 5 in CCDThe results of these methods are used to fit a full quadratic model and are analyzed by regression analysis.
5.4. Solving the Model
- The quadratic equation obtained from the previous step has to be solved analytically or visualized pictorially (contour plots/surface plots) to find the optimum values. Statistical software (MINITAB, MATLAB etc.,) can also be used to solve these equations. This gives the optimum level of each factor which maximizes the response.
5.5. Validation of the Model
- To validate the model, experiments should be conducted by using the optimum values found in the previous step. The model is valid, if the difference between observed response and actual response is less. All the above steps have been sequentially demonstrated by Ying et al.[38]. They have evaluated the recovery of elastase from Bacillus sp. EL31410 by using an ATPS composed of PEG/phosphate system. As a first step, they used a 22 FFD with four center points. From the ANOVA table, both PEG and phosphate concentrations were significant. The PEG concentration had a positive main effect and phosphate had a negative main effect. The difference in response between the two level points and center points were not significant (no curvature) which indicated that steepest ascent method was necessary to reach the vicinity optimum. In the steepest ascent method, a new set of experiments were conducted to reach the optimum domain by increasing PEG concentration and decreasing salt concentration till there was no further increase in response. The maximum recovery was 85.7% and this experimental condition was further optimized by a CCD method. This yielded a quadratic equation which was solved to give the optimal conditions of 23.1% (w/w) PEG 2000 and 11.7% (w/w) KH2PO4-K2HPO4 with a recovery of 89.5%. In order to validate these results, experiments were conducted at these PEG/phosphate concentrations and they obtained a recovery of 89.9%. These results showed that the model was adequate. Table.3 shows the list of ATPS optimized by DOE.
6. Applications of ATPS
- ATPS has been successfully used to recover various biomolecules like proteins, enzymes, aminoacids, antibiotics, plasmids, DNA and nano particles. Nowadays ATPS is extensively used for valuable biopharmaceuticals such as monoclonal antibodies, growth factors and hormones. Recently, researchers[57-62] have recently explored the possibility of using ATPS as an alternative to the existing chromatography methods to purify biopharmaceuticals. It also finds applications in novel techniques like extractive fermentation, membrane supported ATPS (MEMEX) and aqueous two phase floatation (ATPF). All these applications are briefly discussed in the following sections.
6.1. Purification of Monoclonal Antibodies
- Recently, ATPS has been used for the partial purification of mAbs[58-62]. Rosa et al.[58] have shown the wide perspectives for the large scale application of ATPS as the first step in the purification of therapeutic monoclonal antibodies. They have optimized the method of partitioning of IgG from Chinese Hamster Ovary (CHO) using PEG 6000/phosphate system by response surface methodology. An ATPS composed of 12% PEG, 10% phosphate, 15% NaCl at pH 6 gave a recovery of 88% in the upper phase and a PF of 4.3. In another work[59], the same researchers have evaluated an integrated process of ATPS, HIC, and SEC for the purification of IgG from CHO cell supernatant. An ATPS composed of PEG 3350/ citrate, at pH 6, allowed the recovery of IgG with a 97% yield, and 72% protein purity. It was possible to obtain 100% pure IgG with 90% yield by SEC polishing step.
6.2. Extractive Fermentation
- One of the applications of ATPS in integrated bioprocessing is the extractive fermentation or in situ product recovery which was developed to avoid end-product inhibition. It is a technique which involves the combination of ATPS as the first step of the removal of a product from the fermentation broth simultaneously during its production. Since the product is removed continuously, the end-product inhibition can be avoided. Recently, Chavez-Santoscoy et al.[63] employed ATPS for the insitu recovery of β-carotene and lutein from Synechocystis sp. PCC 6803. They found out that PEG/phosphate was not suitable for the recovery since the salt inhibited cell growth. Therefore, by using PEG/Dextran system, it was possible to recover β-carotene 95.9% in top phase and lutein 77.4% in bottom phase. The cells also partitioned to the top phase and hence a subsequent biomass removal from the top phase by means of microfiltration or centrifugation was needed. A list of extractive fermentation using ATPS is shown in the following Table 4.
|
|
6.3. Membrane Extraction Coupled with ATPS
- Another recent application of ATPS which combines the membrane extraction and ATPS is the membrane-supported liquid-liquid extraction, known as MEMEX. In contrast to the conventional ATPS, the phase separation is not needed in MEMEX. Riedl et al.[69] has investigated this technology for the extraction of BSA and lysozyme. They extracted BSA and lysozyme using an MEMEX system consisting of an ATPS (PEG/Phosphate), a surfactant Tween-20 (to increase the distribution coefficient and start the extraction process) and a hydrophobic membrane (Liqui-Cel X40). Since phase separation is not required, it can even be operated as a continuous multi-stage extraction process. From this investigation it is clear that ATPS can replace some of the conventional downstream processing methods.
6.4. Aqueous Two Phase Floatation
- Recently, a novel technique, ATPF was introduced by Bi et al.[70] which combines the principles of ATPS and solvent sublation (SS) to separate penicillin G from fermentation broth. Solvent sublation is a method of adsorptive bubble separation technique. In this method the surface active compounds in aqueous phase are adsorbed on the bubble surfaces of an ascending gas stream. The adsorbed compounds are then collected in an organic layer placed on the top of the water column. In the ATPF method, the surface active compound is first dissolved in a salt solution and then it is mixed with PEG to form ATPS. A gas stream is passed through this system which forms bubbles that float to the top of the aqueous phase where they come into contact with PEG-rich phase. The surface active compound is adsorbed on the bubble surface and dissolves in the PEG layer (Fig 4).
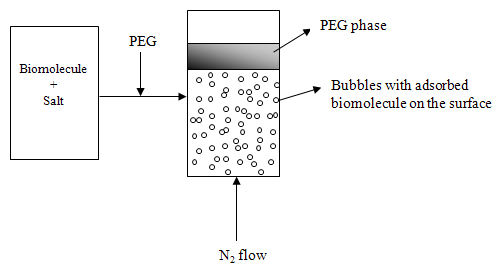 | Figure 4. ATPF system for the removal of biomolecules |
6.5. Recovery of Valuable Biomolecules from Wastewater
- ATPS is nowadays used to recover valuable biomolecules from waste water[72-74]. The waste water from food, pharmaceutical, tannery, dairy, fish and poultry industries contain a lot of biomolecules and they can be recovered. If not, they increase disposal problems like increase in BOD/COD levels. Saravanan et al.[72] studied the recovery of proteins from tannery wastewater using an ATPS composed of 20.81% PEG 4000/ 20.95%MgSO4, 1M NaCl at pH 8 and succeeded with 82.68% recovery to the top phase. The same researchers have also investigated[73] the recovery of tannery waste water proteins with PEG/sulfate salt and concluded that PEG 6000/sodium sulfate system was the best one compared to PEG6000/ammonium sulfate. In this case they were able to recover 92.75% of soluble proteins from waste water.Recently, Rao et al.[74] used an ATPS composed of PEG/PAA to recover glycosaminoglycans (GAGs) from tannery wastewater. From this study, they found out that PEG4000/PAA system of 54.7% TLL, pH 8 and temperature 20°C was better and recovery was 91.5%. From the above research works, it is evident that ATPS can be used as a recovery method for the separation of biomolecules from waste water.
7. Comparison of ATPS with Other Processes
- ATPS offers many advantages over conventional methods and a few comparative studies are reported in the literature. Trindade et al.[75] showed the possibility of substituting the time-consuming two-step precipitation procedure by a simple ATPS extraction. They purified a plasmid DNA vector using a PEG/ammonium sulfate ATPS which was integrated with hydrophobic interaction chromatography (HIC). Nitsawang et al.[4] compared the purification of papain from wet Carica papaya latex between a two-step salt precipitation and PEG/ammonium sulfate ATPS. Using this system, they obtained a higher recovery (88%) and purity (100%). But these parameters were only 49% and 89% using the two-step salt precipitation method and demonstrated that ATPS was the better method.In a study by Aguilar et al.[76], the number of unit operation steps was decreased from 7 to 4 by using an ATPS composed of PEG1450/phosphate for the partial purification of penicillin acylase (PA) produced by a recombinant strain of E. coli. They compared ion exchange chromatography (IEC) and ATPS and concluded that the purification of PA with ATPS was cost effective with high enzyme recovery (97%). Naganagouda et al.[3] compared Aspergillusoryzae α-galactosidase purification in ATPS with ion exchange chromatography. A reduction of unit operations with a higher enzyme recovery (87.71%) was obtained from the ATPS process compared with that from the multi-step chromatography process. From the above investigations, it is clear that ATPS can serve as an alternative method over conventional separation processes.
8. Conclusions and Future Scope
- As evident from this review, PEG/Salt ATPS offers a very simple, benign and powerful method for the recovery of various biomolecules. However, the use of large amounts of phase forming chemicals in large scale is a major concern for the industry. Only a few reports[76-78] are available to reuse the phase forming chemicals. Therefore investigations should be done to addressthese issues. In addition, the high salt concentration used in ATPS creates waste disposal problem which leads to environmental concerns[9]. Nowadays use of salts like citrate (biodegradable) and ammonium carbamate, (volatile) are encouraged. Because of its high selectivity, biocompatibility, easy scale-up and possibility of continuous operation mode, ATPS can be used as a promising technique to purify biopharmaceuticals instead of conventional separation methods. Recent investigations suggest that ATPS is a potential method to recover valuable biomolecules from waste water. ATPS process parameters can be optimized by DOE, which allows a rapid evaluation of effect of different parameters and their interactions. The integrated downstream processing like extractive fermentation, MEMEX, ATPF will gain interest in the near future since the number of steps is significantly decreased which reduces the overall cost.