-
Paper Information
- Paper Submission
-
Journal Information
- About This Journal
- Editorial Board
- Current Issue
- Archive
- Author Guidelines
- Contact Us
Journal of Safety Engineering
p-ISSN: 2325-0003 e-ISSN: 2325-0011
2023; 12(1): 1-12
doi:10.5923/j.safety.20231201.01
Received: May 1, 2023; Accepted: May 26, 2023; Published: Jun. 12, 2023

Safety Improvement on Indian Highways
 Abstract
 Reference
 Full-Text PDF
 Full-text HTML
Chenchu Murali Krishna1, Amarjit Singh2, 3, 4, Kumar Neeraj Jha1
1Department of Civil Engineering, Indian Institute of Technology Delhi, New Delhi, India
2Department of Civil Engineering, University of Hawaii at Manoa, Honolulu, USA
3Honorary Faculty Member, Department of Civil Engineering, Indian Institute of Technology Guwahati, Guwahati, India
4Cooperating Graduate Faculty, Department of Public Administration, University of Hawaii at Manoa, Honolulu, USA
Correspondence to: Chenchu Murali Krishna, Department of Civil Engineering, Indian Institute of Technology Delhi, New Delhi, India.
| Email: |  |
Copyright © 2023 The Author(s). Published by Scientific & Academic Publishing.
This work is licensed under the Creative Commons Attribution International License (CC BY).
http://creativecommons.org/licenses/by/4.0/

Road safety is a critical issue in India, with high rates of road traffic accidents resulting in fatalities and injuries. Despite several policies and programs being implemented by the government, the problem continues to persist due to various implementation challenges. Therefore, it is essential to develop a comprehensive framework that relies on reliable data and involves multiple stakeholders to implement solutions in a coordinated manner. This study reviews the existing literature on Highway Traffic Accidents and analyses the road traffic accident situation in India. The study focuses on identifying the main causes of accident and the different types of accidents that occur on Indian roads. It explores the existing policies and programs in place to tackle road safety and analyses their effectiveness. To enhance road safety and prevent accidents, the study provides guidelines and recommendations that can be implemented by the government, private sector, and civil society. The recommendations cover areas such as infrastructure, vehicle safety standards, driver education, and enforcement of traffic laws. In conclusion, this study undertakes a comprehensive analysis of the road traffic accident situation in India and offers practical recommendations to enhance road safety. The implementation of these recommendations will require the involvement of multiple stakeholders and a coordinated effort to create a safer road environment in India.
Keywords: Accident Fatalities, MoRTH, Guidelines, Traffic Injuries, Government Initiatives, Driver Behavior
Cite this paper: Chenchu Murali Krishna, Amarjit Singh, Kumar Neeraj Jha, Safety Improvement on Indian Highways, Journal of Safety Engineering, Vol. 12 No. 1, 2023, pp. 1-12. doi: 10.5923/j.safety.20231201.01.
Article Outline
1. Introduction
- As per the Ministry of Road Transport & Highways’ annual report on road accidents in India for 2021, there has been an increase of approximately 12.6% in the number of road accidents, with 412,432 incidents reported compared to 366,138 in 2020. However, the number of fatalities resulting from these accidents has increased by around 16.89% during the same period, with 153,972 deaths reported in 2021 compared to 131,714 in 2020. The data indicates that, on average, 422 people lose their lives daily in 1,130 road accidents. Additionally, the report shows that there were at least 18 fatalities in 47 accidents every hour during the given period. The accident severity, estimated as the number of fatalities per 100 incidents, increased from 36 in 2020 to 37.3 in 2021.According to the report, speeding and using mobile phones while driving are significant causes of road accidents. Speeding was found to be responsible for 74.4% of all road accidents and 72.2% of deaths while using cell phones caused nearly 2000 accidents and over 1040 deaths. The study identified Chennai as the city with the most accidents, with 5,034 accidents in 2021, followed by Delhi, with 4,720 accidents. Jabalpur, Indore, and Bengaluru were the three cities on the list. Among the states, the highest number of road accidents belonged to Tamil Nadu, accounting for 13.1% of the total, followed by Uttar Pradesh, Karnataka, and Madhya Pradesh.The report also reveals that cities with a large population experienced a higher number of road accidents, with 16.3% of all accidents and 9.9% of accident-related deaths occurring in the 50 cities with populations exceeding one million. Interestingly, newer vehicles were involved in a higher number of accidents, with vehicles aged between 0-5 years accounting for 30.7% of accidents and those between 5-10 years accounting for 28.2%. Additionally, speed bumps caused almost 6,000 accidents, leading to 2,263 deaths, while potholes were responsible for 3,625 accidents, resulting in 1,481 fatalities [1].
1.1. Indian Road Scenario
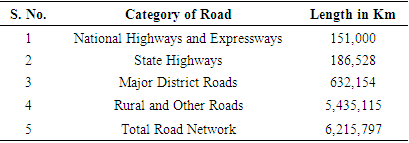
- India’s road network in 2023 is 6.37 million kilometres1 and is responsible for transporting most of the goods and passengers in the country. The growth in road transportation has been facilitated by improved connectivity between cities, towns, and villages. Almost 90% of passenger traffic and 65% of freight in India is transported through roads. As a result, the country’s automobile industry and road freight movement are rapidly expanding.The transport infrastructure sector in India is expected to grow at 17 per cent in real terms in 2021 and grow at a Compounded Annual Growth Rate (CAGR) of 8.2 per cent through the year 2027, thereby becoming the fastest-expanding component of the country’s infrastructure sector. The construction of highways reached 13,327 km during FY 2020-21, with an all-time high average pace of 37 km per day. The Ministry constructed 5835 km in 2021-22, with a construction pace of 28.64 km per day [2].The number of vehicles in the country is increasing by 12% annually. Table 1 provides information on the length of roads in India, categorised by their types. The national highways constitute only 2.1% of the entire road network in the country. Despite this, they are responsible for more than 40% of the total road traffic.
|
1.2. Road Accident Scenario in India
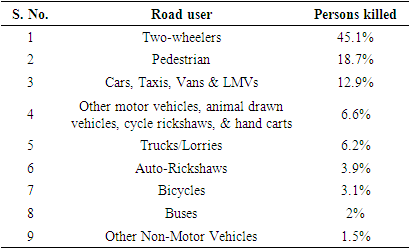
- The 2021 report on road accidents in India provided information on the number of persons who died in such accidents, categorised by their use of the road. This data is presented in Table 2.
|
1.3. Need of the Study
- According to recent national reports, India’s top 10 million plus populous cities were responsible for 43.13% of road accident deaths over five years from 2017 to 2021. Of all the reported accidents that year, 37% occurred in urban areas, while the remaining 63% occurred in rural areas. Fatal accidents were more common in rural areas, accounting for 69.2% of cases (a total of 47,235 persons), while urban areas accounted for 30.8% (106,737 persons). This highlights the need for improved road safety measures in rural areas, especially on National and State Highways where accidents and fatalities are most prevalent.
2. Literature Review
- Road accidents and injuries are significant issues that require government authorities’ attention [5]. In their study, they focused on Patna City, analysing the factors that contribute to road accidents. The research shows that road users’ socio-economic background and humanitarian aspects are crucial factors in road accidents. Pedestrian accidents and fatalities are highest among people aged between 18 and 60, the economically active social group, which accounts to what would be expected. The analysis of road accidents in Patna City reveals that public transport, mainly buses, poses the most significant risk, followed by trucks and three-wheelers. The most accident-prone locations are the national highway and its bypass through the city [5]. In Kolkata, Chakraborty and Roy (2005) developed models based on secondary data to estimate future accidents in the city. Their analysis included four major parameters: accident fatality rate, accident fatality risk, accident severity index, and accident risk. These models have the potential to measure the effectiveness of safety improvements in the city [6].In-depth accident investigations and data collection programs could be successfully developed in newly motorising countries in Asia, with modifications to meet local traffic conditions and the environment. This was demonstrated in a study by Swastik Narayan et al. (2013), who analysed a sample of 71 fatal accidents and found that head-on collisions were the most common type of accident, and motorised two-wheelers (M2Ws) were the most affected. M2W riders mainly received head and chest injuries, while chest and abdominal injuries were more common among car occupants. The study highlights the importance of collecting real-world accident data in India and developing countries to develop effective accident mitigation methods, rather than importing practices from motorised countries that may be inapplicable and ineffective in Asian countries [7].
3. Study and Analysis of Road Safety in India
- In this chapter, the methodology for recording and reporting data has been explained in brief. Further, an attempt has been made to analyse and interpret the available accident data.
3.1. Recording of the Crashes
- The primary source of national traffic accident data is the annual reports published by the National Crime Record Bureau (NCRB) [8] and the Ministry of Road Transport and Highways (MoRTH) [1], called Road Accidents in India. These reports gather information from police stations all over the country. The data collection process is explained briefly as follows:a. When a road accident happens, they create a First Information Report (FIR) per Indian law with the local police station, to record the incident.b. Once an FIR is filed, the contents of the FIR cannot be modified, save by an order from the High Court or the Supreme Court of India allowing the modification.c. Once the investigation is complete, a case file containing information about the accident is prepared. The person responsible for the accident is charged according to the relevant sections of the Motor Vehicle Act and the Indian Penal Code.
3.2. Reporting of the Crash Data Analysis
- Police stations collect statistical information on road traffic accidents within their jurisdiction and report this data to the district crime records bureau. The district bureau then consolidates the data and sends it up to the state crime records bureau. Finally, the National Crime Records Bureau (NCRB) compiles all the data from various state bureaus to generate statistics representing the entire country’s road traffic accident data.
3.3. National Fatality Rates
- The graph in Figure 1 displays the official record of road traffic accident fatalities and fatalities per 100,000 people in India from 1970 to 2020, according to NCRB [8]. The number of deaths in 2020 was 8.7 times higher than 1970, representing an average annual growth rate of 6%, compared to a population growth rate of 2%2 and a motor vehicle growth rate of 10.1%3. Further, the fatality rate per one lakh population in 1970 was 23.204 times higher than in 2020, with an average annual growth rate of 3.9%. Despite minor declines in fatalities at specific points, it is observed that the correlation between motor vehicle crash rates and economic downturns exists. It has been acknowledged that reduced economic growth rates lead to decreased motor vehicle crash rates. This can be attributed to several reasons, as the International Traffic Safety Data and Analysis Group noted in 2015 [9].
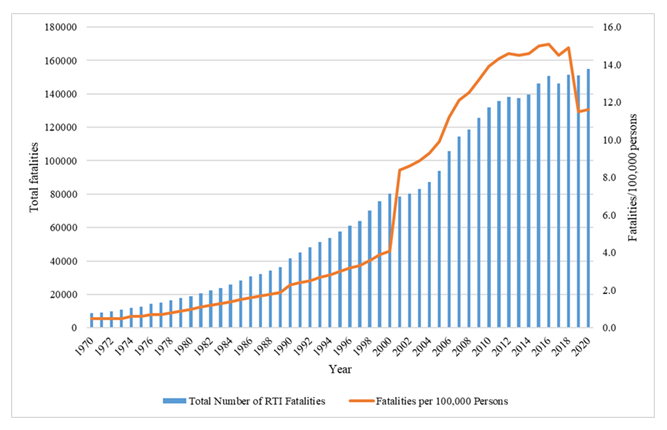 | Figure 1. The number of RTI fatalities and fatalities per 100,000 persons in India [10] |
3.4. Traffic Crashes on Indian Highways
- Figure 2 shows the percentage of fatalities and road length for different types of roads in India. Despite only 2.1% of the total road length, highways account for 36.4% of all fatalities. The highest number of fatalities per kilometre of the road is on expressways at 3.08 per year, followed by national highways at 0.72 per year. The relatively high number of deaths on national highways is due to the significant traffic they carry at high speed. However, it is impossible to compare exposure rates directly without information on the distance travelled by vehicles on each highway category. Expressways have a shorter length of only 4,067 km, but the high death rate of 0.55 per kilometre per year is a cause for concern.
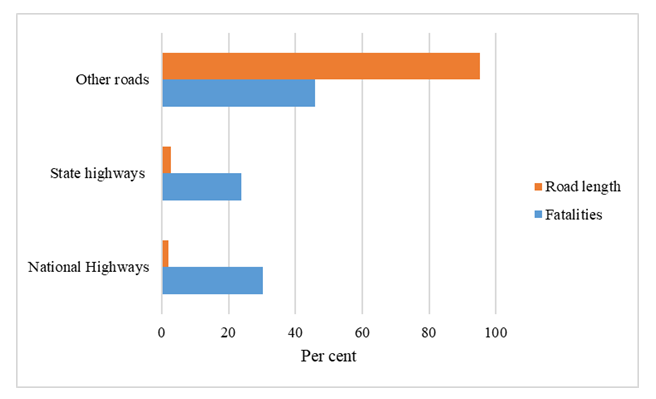 | Figure 2. The number of fatalities on various road types and the proportion of road length in road type [1] |
3.5. Modal Share of Road Traffic Injuries Fatalities
- The information in Figure 4 displays various statistics regarding fatalities of individuals using the road, sourced from MoRTH (Transport Research Wing, 2021) [1], WHO (2021), Hsiao, M. et al. (2013) [11], and Transportation Research and Injury Prevention Centre (TRIPP), IIT Delhi (2021) [10]. The data from MoRTH and WHO reports are based on information gathered from police records. Hsiao et al. (2013) based their estimates on a survey of 1.1 million Indian households that reported 122,000 road traffic injury (RTI) deaths. Meanwhile, TRIPP Centre’s estimate is derived from analysing police records obtained from eight cities [10]. Figure 3 shows the fatality rate per year per kilometre for different types of roads, such as national highways, state highways, and other roads. Among all the roads, compared to national highways and state highways, other roads, such as major district roads, village roads, and local roads, have the highest fatality rate of 40.5% of all fatalities.
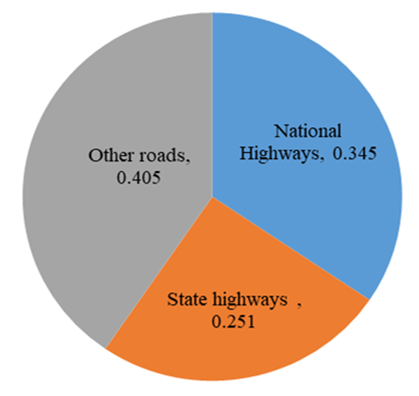 | Figure 3. The fatality rate per kilometer of road per year for different types of roads [1], [10] |
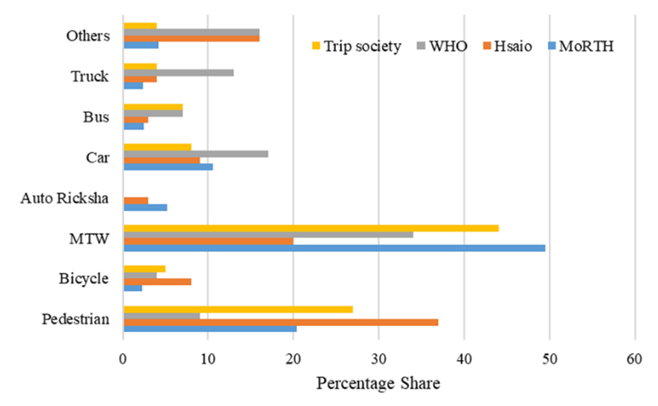 | Figure 4. Estimates of the proportion of fatalities among different road (adapted from MoRTH (Transport Research Wing, 2021 [1]; Hsiao, M. et al. (2013) [11] and TRIPP Society, IIT Delhi (2021) [10]) |
3.6. Age Distribution for Accidents
- Figure 5 shows the gender-wise age comparison of road accident deaths for 2021. The total number of males and females killed was 133,025 (86.4%) and 20,947 (13.6%). According to Figure 5, the highest number of accidents occurs among individuals aged 25 to 35, who constitute the working-age population involved in various activities. Notably, the number of accidents in the 18 to 45-year-old driver age group is highest; males killed was 91,583 and females killed was 12,554. This difference can be attributed to factors such as reckless driving, lack of awareness, and maturity among younger drivers [12]. The difference is probably most explained by the fact that the maximum number of people in India belong to the 18-25 age group.
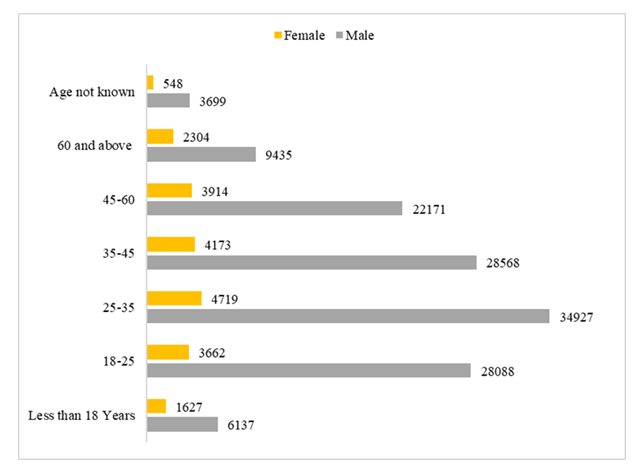 | Figure 5. Distribution of accidents based on gender-wise age [1] |
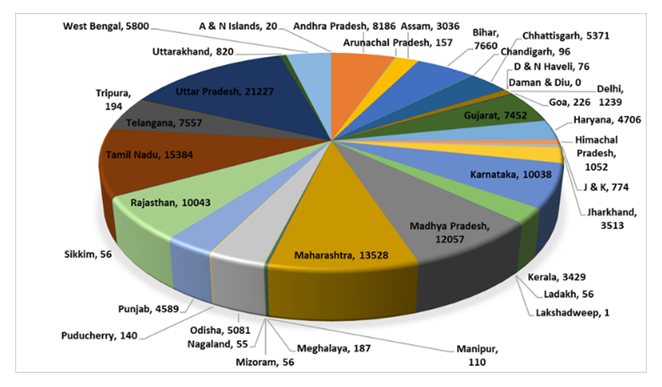
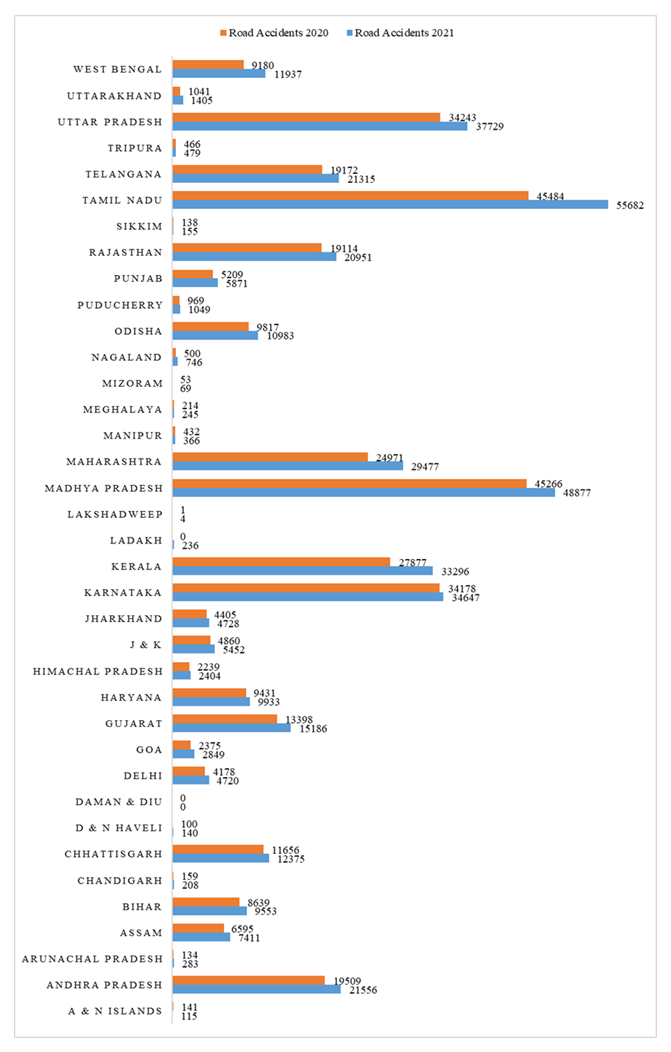
3.7. State-Wise Analysis
- Figures 6 and 7 illustrate the distribution of total number of road accidents and total number of fatalities, respectively, across different states in India during the year 2021. The total number of accidents rose from 366,138 in 2020 to 412,432 in 2021, representing an average rise of 12.6% over the same period in the previous year. The overall number of fatal accidents rose from 131,714 in 2020 to 153,972 in 2021, representing an average rise of 16.9% over the previous year.
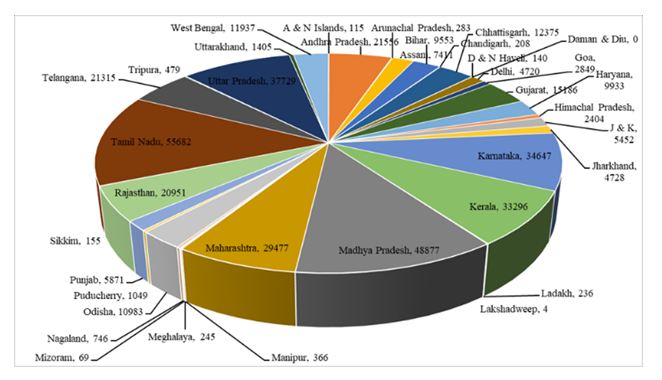 | Figure 6. State-wise distribution of accidents [1] |
 | Figure 7. State-wise distribution of Accident fatalities data [1] |
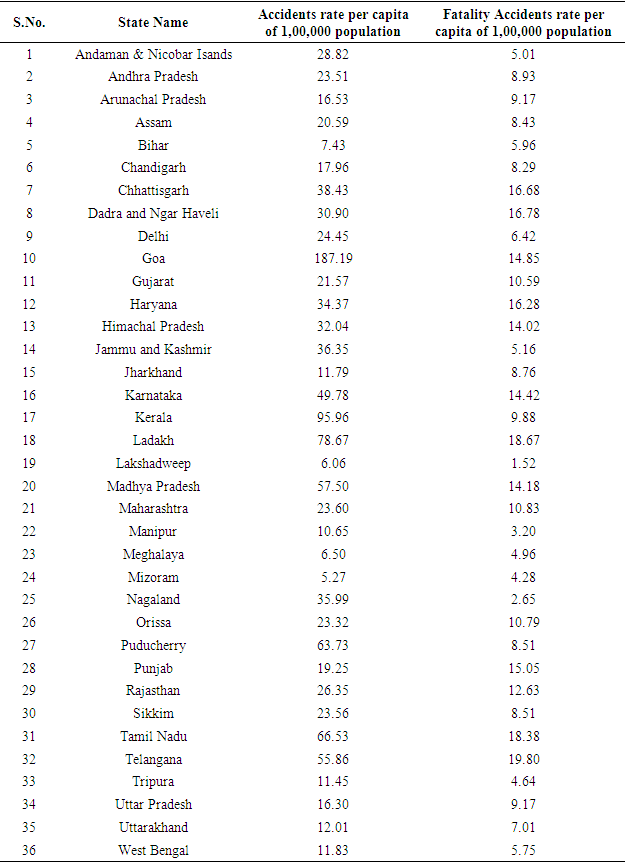
 | Figure 8. The state-wise accident rate per 10,000 km of the road network for the years 2021 and 2020 [1] |
|
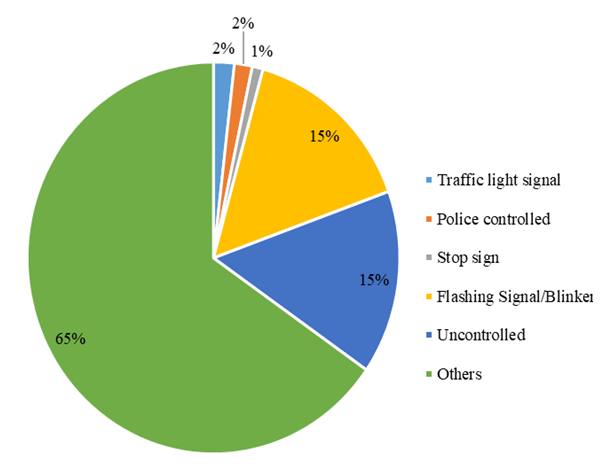
3.8. Accidents Analysis Based on the Junction and Traffic Control
- Figure 9 captures the accidents based on the level of traffic control. The maximum number of accidents (15%) occurred in uncontrolled and flashing signal/blinkers areas, such as locations where traffic signals or traffic lights are not present or not functioning properly [10]. Figure 9 shows that about 65 per cent of the accidents occurred in the “Others” category. Interestingly, flashing signals/blinkers are the most significant occurrence points for accidents after uncontrolled areas. A possible explanation for the high percentage of accidents occurring at traffic signals may be the lack of driver discipline in obeying the signals resulting in crashes between vehicles approaching from different directions.
 | Figure 9. Distribution of road accidents based on traffic-controlled areas [1] |
4. Guidelines for Road Safety
4.1. General
- This section offers a large set of guidelines for improving road safety, considering factors such as feasibility, impact, cost, and public acceptance. While some guidelines may be challenging to implement, they can be evaluated carefully and then adopted. Some of the road safety guidelines proposed are given in below in this section [13]:
4.2. Guidelines for Safe Traffic System Design
- Most road traffic fatalities and severe injuries are preventable, as the risk of injury in a crash is often predictable and many effective countermeasures are available. The main goal in creating road traffic systems is to offer secure, eco-friendly, and affordable transportation. To ensure the safety of pedestrians and cyclists, it is common practice to prohibit their access to motorways while prohibiting motor vehicles from entering pedestrian areas. Further, prioritising high occupancy vehicles on the road network is essential for a safe traffic system. In addition, road safety is an integral aspect of road design during the planning stage. And, by giving preference to vehicles with many passengers over those with few, the distance travelled by private motorised transportation can be reduced, lowering the risk of accidents.
4.3. Guidelines for Reducing Risk through Transport Policies
- The strategies that aim to decrease the risk exposure in road safety are often neglected. However, these strategies can have a significant impact as the underlying factors determining risk exposure are crucial. For example, reducing the amount of motor vehicle traffic through better land use, creating efficient networks that align the quickest and safest routes, promoting lower-risk modes of transportation, and imposing restrictions on motor vehicles, their users, or road infrastructure can all help reduce risk exposure.
4.4. Guidelines for Planning Safe Road Networks
- Efficient road networks can reduce the risk of crashes by providing short and direct routes that are also safe. This can be achieved through route management techniques, such as improving travel conditions on desired routes to decrease travel times, modifying conditions on undesired routes to increase travel times, or redirecting traffic. To plan for safe road networks, it is crucial to classify the roads based on their primary functions and set appropriate speed limits accordingly. Additionally, improving the layout and design of roads can encourage better usage and contribute to safer travel. But this can all be moot if there are no funds available to make these changes.
4.5. Guidelines for Creating Safety Features in Road Design
- • Roads with higher speeds, such as expressways, motorways, and multi-lane divided highways, have limited access and are designed to accommodate faster speeds. This is achieved through features such as large-radius horizontal and vertical curves; “forgiving” roadsides, conceived to permit drivers deviating from the travel lane to recover their paths with quick resilience; entry and exit junctions separated from non-motorised traffic such as bicycles, bullock carts and pedestrians; and median barriers that separate traffic moving in opposite directions.• In rural areas, single-lane carriageways have various roads that accommodate slow-moving traffic and vulnerable road users. There are separate lanes for overtaking and for vehicles waiting to turn across oncoming traffic. Median barriers are another great way to avoid head-on crashes while occupying very little roadway footprint. Road hazards are highlighted for night driving through better lighting at junctions and roundabouts. Improvements in vertical alignment, speed limit signs posted frequently, speed limit signs posted at sharp bends, and removing as many roadside hazards as possible, such as utility poles, trees, and various types of random structures are also recommended.• Access roads in residential areas are typically designed to ensure vehicles travel at very low speeds. Physical measures that enforce these speed limits are often put in place to encourage compliance with these speed limits. The speed limit on these roads is typically around 30 km/h, although in some cases, lower limits may be required.• Developing connected and convenient networks of pedestrian and cyclist routes and public transportation options can provide safer travel options for vulnerable road users, such as pedestrians and bicyclists. By ensuring the availability of such routes, the risk of accidents can be minimised, making it a safe and reliable mode of transport for them.
4.6. Guidelines for Creating Safety Features in Road Design
- Road safety is a primary concern anywhere, particularly regarding collisions between vehicles veering away from the pavement and thus hitting objects on the roadside, such as utility poles, trees, and road signs. To counter this problem, it is essential to design protective roadside measures that include the following provisions:• avoid placing dangerous objects near the road • create a clear zone alongside the road• design roadside objects to be more forgiving in case of collisions • install barriers to absorb impact energy, and • improve vehicle design to protect occupants in the event of a collision with roadside objects.
4.7. Guidelines for Safety Audits of New Highway Projects
- Before implementing new transportation projects, it is essential to conduct area-wide safety impact assessments to evaluate the potential negative impacts on the surrounding network. Afterwards, road safety audits should be conducted at different project stages, including during the feasibility study, the preliminary design, and the detailed design phases. These audits ensure that safety principles are integrated into the project design and identify any necessary modifications to prevent accidents. Safety audits should again be conducted before the highway is made operational, and again in 3-6 months after its opening to ensure its continued safety and effectiveness.
4.8. Guidelines for Remedial Action at High-Risk Crash Sites
- Low-cost road and traffic engineering measures refer to physical modifications made to improve roadway system safety that is affordable, efficient, and quick to implement. Such measures include installing skid-resistant surfacing, adding central islands, enhancing lighting, signs, and markings, modifying junctions by installing small roundabouts, improving signals, or updating signs and markings. These measures aim to reduce the risk of accidents and are highly cost-effective.These low-cost road and traffic engineering measures can be implemented at specific high-risk locations, such as a dangerous bend or intersection. They can also be applied to a particular route section where the overall risk is higher than average. The objective is to target areas where accidents are more likely to occur and introduce cost-effective measures there to improve road safety.
4.9. Guidelines to Encourage People to Use Safe Modes of Travel
- Compared to other modes of road travel, bus and train travel is often safer, measured simply by the number of accidents incurred by bus and rail. Hence, to further improve safety and encourage the use of public transport, measures can be taken, such as enhancing mass transit systems, including expanding routes and improving ticketing procedures, reducing the distance between stops, and improving the safety and comfort of vehicles and waiting areas. Coordination between different modes of travel, such as aligning schedules and tariffs, can also be improved. Other measures such as allowing bicycles on board trains, ferries, and buses, having “Park and Ride” facilities for cars near public transport stops, improving taxi services, are already used in many places. However, it is found that increasing fuel taxes and other pricing reforms to discourage private car use in favour of public transport is not effective overall.
4.10. Guidelines for Pedestrian and Bicyclist Safety
- While everyone on the road is at risk of accidents, vulnerable road users, such as pedestrians and two-wheelers, face a higher risk of injury or death than four-wheel vehicle occupants, particularly in countries like India, where traffic is more mixed and intense. To improve the safety of such road users, specific measures should be taken, such as:• Banning free left turns at all signalised junctions to give pedestrians and cyclists a safe time to cross the road.• Enforcing speed limits of 50 km/h on arterial roads and 30 km/h in residential areas by using dead-end streets, speed breakers, mini roundabouts, and police monitoring. • Enhancing the visibility of bicycles by fixing reflectors on all sides in yellow, white or orange colours.
4.11. Guidelines for Improving Vehicle Safety
- The following measures are recommended to improve vehicle safety and reduce road traffic crashes:• Ensure that all motor vehicles, regardless of origin, meet the safety standards set in advanced countries, including providing essential safety equipment like seat belts.• Continuously improve vehicle safety by investing in research and development.• Advertise vehicles responsibly by emphasising their safety features.• Use intelligent vehicle technology and new advancements to improve road safety by equipping vehicles with exposure, crash avoidance, injury reduction, and automatic post-crash collision warning and avoidance systems. For instance, the data compression of GNSS (Global navigation satellite system) information enhances autonomous vehicles’ communication efficiency and accuracy with other vehicles and infrastructure [14].
4.12. Guidelines for Improving Vehicle Safety Inspection
- Currently, the fitness tests of motor vehicles are based on visual inspection, which can result in subjective evaluations by inspecting officers. These prescribed tests are not very useful and are more of a routine exercise. However, due to the increasing number of road accidents and environmental pollution, it is necessary to focus on inspecting vehicles already in use. Therefore, the Ministry plans to implement a well-designed Inspection and Certification system across the country to ensure that motor vehicles are properly inspected for all safety features, such as light indicators, brake lights, tire pressure, and ensuring that any defects are fixed before they are allowed to operate on the roads. In addition, the safety inspector must take the car for a test drive before issuing the safety certificate, which must be valid only for one year.
4.13. Guidelines for Enforcing Rules and Regulations
- Effective enforcement is an essential component of road safety. The following guidelines are recommended for enforcement:• Penalties for traffic violations should be severe enough to deter offenders.• Penalties for offenders should be applied quickly and efficiently.• Use automated speed enforcement technologies such as speed cameras and overhead balloons.• Heavy goods and public transport vehicles must be equipped with speed governors.• High and sustained enforcement levels are necessary to maintain the perceived risk of being caught.• Enforcement efforts should target specific risk behaviours and locations to increase their effectiveness.• Publicity campaigns can increase the effectiveness of enforcement measures. However, they should not be relied on alone to change road user behaviour.
4.14. Guidelines for Setting and Enforcing Alcohol Impairment Laws
- Alcohol and substance consumption and driving is a significant causes of road accidents in India, and in perhaps every country where alcohol and substances are not banned. Both scientific studies and national road safety programs acknowledge the need for practical measures to decrease alcohol-related crashes and injuries. Some of the measures are:• Establishing blood alcohol concentration limits at 0.08% of blood volume.• Implement minimum drinking-age laws that prohibit purchasing or consuming alcoholic beverages below a certain age.• Conducting random breath tests and sobriety checkpoints.• Imposing severe penalties on drivers who exceed the permissible alcohol limits.
4.15. Guidelines for Motorcycle Helmets
- Standards have been established in various regions to specify the performance requirements for crash helmets. The effectiveness of these standards is based on crash injury research findings. Developing low-cost, comfortable helmets and enhancing local manufacturing capacity in India is very desirable. To ensure safety, there must be laws mandating the use of helmets. It has been recommended that when purchasing a motorcycle, the procurement of an approved helmet should be mandatory or at least encouraged, particularly in low-income countries.
5. Recommendations
- In this article, attention has been placed on adopting innovative solutions using disruptions in technology and learning techniques to improve the overall spectrum of problems ranging from severe accidents and fatality rates to traffic congestion. The following recommendations open new avenues of research about cost vs. benefit analysis in the Indian context.
5.1. Recommendations for Expressways and Highways
- The fatality rate per km of expressways and highways is highest among the different categories of roads. The combination of higher speeds, more traffic, limited access, road design, and driver behaviour can all contribute to a higher fatality rate per km on expressways and highways compared to other types of roads. General causes of traffic accidents include mostly driver behaviour issues, spelled out in “Common Causes” (2023, March 16) [12]. Hence, special attention must be paid to expressways and highways. To reduce the fatality rate per km, the following measures need to be taken:1. High-quality steel fencing should be provided on the edges of the expressway throughout its length to prevent unauthorised entry of pedestrians, local vehicles, and animals.2. Access to the expressways should be strictly regulated, wherein vehicles incapable of achieving the speed limit defined should be restricted.3. Highways and expressways have many maintenance issues regarding potholes, improper barricading, and trash removal from highways. A separate maintenance surveillance team should be established to look after the same and make highways hassle-free.4. Proper drainage, carriageway width, and paved shoulder with proper median and lining along the carriageway should be incorporated in the highway design to function correctly as expected.
5.2. Recommendations for Data Collection
- To obtain accurate information about accidents and fatalities, establishing a professionally managed data collection system is necessary. Currently, crash data is recorded at the local police station level, which only attributes 80% or more of the cases to human error. This method does not provide a comprehensive understanding of the factors contributing to accidents, such as vehicle design, roads, and infrastructure. Therefore, to improve road safety analysis and policy planning, revamping the current data collection system in collaboration with the Ministry of Home Affairs and establishing a dedicated department for professional data analytics is recommended. This is important because unreliable information cannot be used for effective decision-making in road safety.
5.3. Changing Driver Behaviour
- It is a significant challenge to change the behaviour of citizens, especially drivers and motorists, who often refuse to take personal responsibility for their actions. In countries with high-density traffic, road rage and abuse are serious problems. According to Figure 5, the distribution of accidents based on gender-wise age shows that individuals between the ages of 18 and 45 are involved in the majority of accidents. Therefore, any driver awareness program should focus on this age group. In the UK, organisations like Road Safe are addressing this trend by emphasising the importance of public-private partnerships to develop interactive programs for young drivers, which can instil a greater sense of responsibility on the roads. This approach is essential to change driving behaviour to improve road safety.
5.4. Recommendations for Junction and Traffic Control
- According to Figure 9, which shows the distribution of road accidents based on traffic-controlled areas, uncontrolled intersections are the location of the highest number of road accidents. One solution to decrease the frequency of accidents could be to use grade-separated intersections, where traffic can cross at different levels. These types of intersections are typically built on facilities such as highways, expressways, and freeways. By using grade-separated intersections, road capacity can be increased, and the potential for accidents can be reduced, though the cost would increase, so it is a challenge to attempt these. Several grade-separated interchanges exist, including diamond, trumpet, cloverleaf, and partial cloverleaf interchange.
6. Additional Recommendations
- Some technological recommendations based on best practices across the globe that need to be thoroughly investigated in the Indian context are given below:
6.1. Better Traffic Technology
- India has an unusually high number of fatalities resulting from traffic accidents, highlighting the need for innovative solutions in traffic management. With the projected growth of smartphone users to 530 million by 2018, there is an opportunity to develop application-based solutions to address this issue. Applications such as Traffline, Traffic Fines India, and Traffic Tutor provide real-time traffic updates to help drivers plan their routes effectively. Traffic Fines India also goes a step further by notifying drivers if they have violated traffic laws, thereby helping to reduce such offences. Pittsburgh struggled with heavy traffic in the US until it adopted SURTRAC (Scalable Urban Traffic Control), a project executed in collaboration with Carnegie Mellon University’s Transportation Centre. This project showed great potential in improving traffic conditions [15].
6.2. Vehicle Safety and Technology
- The failure of seven Indian cars to pass the Global NCAP crash test with a zero-rating highlights severe flaw in their design. The NCAP report revealed that the driver’s head and chest received poor protection, the passenger’s chest had marginal protection, and the dashboard could cause knee injuries. The body shell was deemed unstable and unable to withstand further loadings. All seven variants tested were found to have similar issues [16].In response, the government has established new standards for basic car safety, including mandatory side-impact and frontal crash tests. And in the private sector [16], “UL, a global safety certification company, has also launched a campaign to involve Indian citizens in identifying safety solutions for their cities. Car manufacturers and governments are exploring technologies such as V2V, AR dashboards, and energy-storing body panels to improve vehicle safety.”
6.3. Internet of Things (IoT)
- IoT is a budding area that provides enhanced opportunities through disruption in accident reduction. The following techniques have already been employed in different geographies, and customised extension of the same is the need of the hour. But India is a huge country, and the quantum of effort has to be undertaken on a mass scale:1. ‘SmartLife’ poles have been created to enhance safety on India’s high-risk mountain roads and highways. These poles can communicate with each other, exchanging data on incoming traffic prior to sharp turns and hairpin bends. By measuring the speed of vehicles, the poles alert drivers of approaching traffic by sounding a horn. Currently, the prototype of this system is being tested on NH1, a dangerous road connecting Jammu and Srinagar.2. Developing Intelligent Speed Adaptation (ISA) utilising GPS technology is possible. The driver can use this to determine the vehicle’s exact location and the designated speed limit for the road it is travelling on. They can then install a device (either through software or an app) which can cut the fuel flow if the driver tries to exceed the speed limit, making it physically impossible for them to overspeed.3. Vehicles can be equipped with “V2X” communications, allowing for vehicle-to-vehicle and vehicle-to-infrastructure communications. A cooperative-connected car would receive information about a detected hazard from its sensors (via sound or vibration, which is more noticeable than a road sign) and alerts from vehicles ahead on the road [14].
7. Government Initiatives
- To address the problem of road safety, the Ministry of India has adopted a comprehensive approach that includes education, engineering (of both roads and vehicles), enforcement, and emergency care. The Press Information Bureau (2021) has provided a list of government initiatives undertaken by the Ministry of India in this regard [17].
7.1. Education
- 1. Various publicity measures and awareness campaigns on road safety were implemented through different media channels and NGOs. Over the period of 2018 to 2021, a total of 714 work orders were issued to various NGOs.2. National Road Safety Month/Week is celebrated annually to increase awareness and enhance road safety.3. A Certification Course for Road Safety Auditors was initiated at the Indian Academy of Highway Engineers (IAHE).
7.2. Engineering Roads and Vehicles
- 1. The Ministry is prioritizing the identification and rectification of accident-prone spots on National Highway, known as black spots. Based on data from 2015-2018 in 30 States and Union Territories, 5,803 black spots have been identified, with temporary measures already implemented on 5,366 locations and 3,215 locations permanently rectified.2. Road safety is being incorporated into road design during the planning stage.3. Regional Officers of MORTH have been delegated powers for technical approval of detailed estimates to rectify identified Road Accident black spots.4. Guidelines for pedestrian facilities on National Highways are being issued for persons with disabilities.5. Standards for automobile safety are being improved, including Airbags, Anti-Breaking System (ABS), Tyres, Crash test, and Whole Vehicle Safety Conformity of Production (WVSCoP).6. Speed Limiting devices will be fitted on all transport vehicles.7. To test the fitness of vehicles through an automated system, one model Inspection & Certification Centre will be set up in each State/UT with Central assistance.
7.3. Enforcement
- 1. Using technology to strictly enforce traffic rules and imposing severe penalties to ensure compliance and deter violations.2. Developing guidelines to protect Good Samaritans and creating regulations in accordance with the MV (Amendment) Act, 2019.
7.4. Emergency Care
- 1. The Motor Vehicles (Amendment) Act, 2019 includes a plan to offer cashless medical treatment to accident victims during the critical first hour after the incident.2. A mandate has been issued to have ambulances available at all toll plazas along completed sections of National Highways, and to upgrade these ambulances to Basic Life Support in accordance with AIS125.
8. Conclusions
- The article discusses the Indian road scenario, highlighting the growth in road transportation facilitated by improved connectivity between cities, towns, and villages. Furthermore, the article explains the need for the study to address the significant issue of road traffic injuries and deaths in India. The article provides information about the increase in road accidents and fatalities in India in 2021 compared to 2020. The authors gave guidelines for road safety to minimise road accidents and fatalities. The guidelines cover several aspects such as safe traffic system design, risk reduction through transport policies, planning safe road networks, creating safety features in road design, designing crash-protective roadsides, conducting safety audits of new highway projects, and remedial action at high-risk crash sites. Based on the recommendations provided in the article, it is clear that improving road safety in India will require a multi-pronged approach that includes innovative technological solutions, improved infrastructure, better data collection and analysis, and a focus on changing driver behaviour. Adopting cost-benefit analysis in the Indian context can help determine the most effective solutions that balance the costs and benefits of implementing various measures. The government, private sector, and citizens must work together to address the challenges and implement the recommendations to improve road safety and reduce the high fatalities resulting from traffic accidents in India. Ultimately, improving road safety in India is not only a moral imperative but also an economic one, as it can contribute to the country’s sustainable economic growth and development.
Notes
- 1. Next only to the USA’s 6.80 million km (2019); followed by China with 5.2 million km (2020). However, India’s road density is the highest in the world at 194 km per 100 sq. km, followed by France at 191 km per 100 sq. km. (“List,” 2023). Out of the top ten countries with the highest road length, the density of road length per 1,000 persons is highest for Australia at 33.96 km, followed by Canada at 27.25 km, and USA at 20.41 km. India and China are at 4.55 and 3.58 km, at the 9th and 10th positions, respectively. The data for Australia and Canada make sense because they need long roads to criss-cross their country, but have relatively small populations compared to India, China, or USA.2. 1.4 billion population in 2023 cf. 500 million in 1970.3. 326.3 million vehicles in 2023 cf. 2.0 million vehicles in 1970.4. 154,732 Fatalities in 2023 cf. 8,890 fatalities in 1970.