E. C. Merem1, Y. Twumasi2, J. Wesley1, M. Alsarari1, S. Fageir1, M. Crisler1, C. Romorno1, D. Olagbegi1, A. Hines3, G. S. Ochai4, E. Nwagboso5, S. Leggett6, D. Foster1, V. Purry1, J. Washington1
1Department of Urban and Regional Planning, Jackson State University, Jackson, MS, USA
2Department of Urban Forestry and Natural Resources, Southern University, Baton Rouge, LA, USA
3Department of Public Policy and Administration, Jackson State University, Jackson, MS, USA
4African Development Bank, AfDB, Avenue Joseph Anoma, Abidjan, Ivory Coast
5Department of Political Science, Jackson State University, Jackson, MS, USA
6Department of Behavioral and Environmental Health, Jackson State University, Jackson, MS, USA
Correspondence to: E. C. Merem, Department of Urban and Regional Planning, Jackson State University, Jackson, MS, USA.
| Email: |  |
Copyright © 2019 The Author(s). Published by Scientific & Academic Publishing.
This work is licensed under the Creative Commons Attribution International License (CC BY).
http://creativecommons.org/licenses/by/4.0/

Abstract
In sub-Saharan Africa, storm surge zones are concentrated in four nations including Nigeria where half of the region’s surge zones resulting from sea level rise and violent storms originate. This comes in an era in which Africa’s coastline population will be at risk from sea level rise and coastal flooding over the coming decades. With much of Nigeria's urban population and economic activity located along the low-lying coastline, including the Niger Delta and portions of Lagos in the South west. Risk exposures will increase with population growth in these areas. Considering that significant levels of the country’s CO2 and CH4 (carbon dioxide and methane) emissions come from the Southern region, the projected impacts of rising sea levels from warming temperature threatens several Southern states such as Lagos and others. Given the economic potentials of the coast, highlighting extreme climate patterns in the zone spatially, offers ideal opportunity for mitigation. While very little has been done to capture these concerns, the dangers from sea level rise, flood hazards and coastal erosion in the region has been exacerbated by different elements like human activities, greenhouse gas emissions and natural forces. Seeing the connections between sea level rise threats and many factors, there is a need for a mix scale model using GIS (Geographic Information Systems) and descriptive statistics in order to enhance coastal environmental management strategies. Accordingly, this project focuses on a regional assessment of climate change hazards in Southern Nigeria with emphasis on the issues, trends, factors, impacts and efforts. In applying the mix scale tools, results show that the region is facing challenges with changes in climate parameters (land use, (GHG) Green House Gas emissions, precipitation patterns, sea level rise, flooding and rising temperature) due to pressures from socio-economic and physical factors. GIS mapping of the trends also pinpointed the exposures in the major ecozones, vulnerability of surging population centers, the risks to oil and gas infrastructure in low lying areas and the intensity of rainfall and flood hazards. To remedy the situation, the study proffered suggestions ranging from the need for effective policy, growth management measures, installation of early warning systems to more use of GIS and the design of a regional climate information system to protect the study area.
Keywords:
Assessment, Southern Nigeria, Coast, Sea Level Rise, Climate change, GIS, Risks
Cite this paper: E. C. Merem, Y. Twumasi, J. Wesley, M. Alsarari, S. Fageir, M. Crisler, C. Romorno, D. Olagbegi, A. Hines, G. S. Ochai, E. Nwagboso, S. Leggett, D. Foster, V. Purry, J. Washington, Regional Assessment of Climate Change Hazards in Southern Nigeria with GIS, Journal of Safety Engineering, Vol. 8 No. 1, 2019, pp. 9-27. doi: 10.5923/j.safety.20190801.02.
1. Introduction
Nigeria is experiencing adverse climate conditions with negative impacts on the welfare of millions of people amid mounting vulnerability [1, 2]. This is evident with the rise in climate change related risks such as high temperature, erratic rainfall, sea level rise, flooding and drought. For that, the nation is already grappling with many of the most disturbing consequences of climate change [3-6]. In the process, persistent droughts and flooding, off-season rains and dry spells have rendered farming seasons out of synch, in a nation heavily reliant on rain-fed agriculture [7, 8]. Considering the high propensity to heavy flooding in many parts of Nigeria, including the states in the Southern zone [9-13]. In 2012 when the nation experienced four months of terrible floods, some states in the region were heavily battered [14, 15]. In addition, exposure to coastal inundation also threatens Nigeria’s Southern coast [16], including two major cities, Lagos and Port Harcourt and the others due to the lower elevation characteristics in the zone [17-20]. While the nation’s symbol of economic power, Lagos, which accounts for about 60% of Nigeria’s GDP, faces the threats of sea level rise [21-23]. Current hydrological modelling indicates that aside from the impending submergence of much of Lagos [24], a sea-level rise of 1m or more could result in the loss of 75% of the Niger Delta known for its vast marshlands vital for carbon sequestration [25]. Still, ongoing coastal erosion, rising seas and oil pollution are destroying the Delta’s mangrove forest a major buffer against storm surge from the sea. From its vast coastlines, diverse ecosystems including rainforest and swamps and low-lying cities in the South, the Niger Delta area with its 1,900 km2 mangrove swamps and nearby areas have in the past decades experienced climatic hazards from heavy rains to coastal inundation [26]. Being an oil and gas hub with vast network of onshore and off shore oil fields and refineries, about 12 million Metric Tons (MT) of flared CH4 discharged into the air yearly, heats up the region [27]. At that pace, between 1960-1970, the Southern coastline saw a sea level rise of 0.462m that resulted in the flooding of communities and the erosion of low-lying areas, the loss of mangroves, amidst the growth in human settlements and infrastructure [26]. Given the countless exposures to such risks, in 2012, about 19 towns in the Lower Niger basin, were not only submerged by violent floods [14], but from 1999 to 2015, natural disasters led to the death of many citizens. In the same period, over 1 million victims were also affected by hazards from rainstorms and the submergence of towns [28]. With these risks linked to socio-economic and physical factors, frequent hazards from storms, sea level rise, flooding and GHG emissions continue to threaten the region. At current risk levels, physical, and social assets face impending obliteration as coastal inundation threatens cities like Lagos and Port Harcourt and the others. For that, low lying areas on the coast are projected to be submerged under water by 2100 [29-31]. Seeing the gravity, and the fact that this comes in an era in which a cross section of Nigeria’s population, residing adjacent to coastlines are at risk from sea level rise and coastal flooding over the coming decades due to climate change. It is becoming overly alarming that much of low-lying areas in the South will be overtaken by the ocean. From their physical attributes, the proximity to the ocean and major rivers and rising populations and economic potentials, coastal areas in the South are more vulnerable to the menace of climate change confronting the region more than ever [32, 33]. With much of Nigeria's urban population and economic hubs located along the low-lying coastlines, including the Niger delta and portions of Lagos serving the vital oil industry. Risk exposures will increase as the population of these areas grow. Because many Southern cities are at risk from rising sea levels and intense storms, substantial amount of the land in and around Lagos is less than 2m above sea level, so it too is expected to be affected by rising sea levels [34, 35]. Considering that significant levels of the country’s carbon dioxide and methane emissions come from the region, the projected effects of rising sea levels from warming temperature will accelerate the submergence of several Southern states such Lagos, Bayelsa, Rivers, and half of Delta state and Cross Rivers [36]. Since 25% of Nigerian’s live in the coastal region filled with huge natural resources and economic assets, as a hub, such socio-economic and ecological traits make the area quite vulnerable to sea level rise. Also, the region’s major rivers’ floodplains are the most vulnerable to floods especially during heavy rainfall periods. In the zone, agriculture, health, infrastructure, the economy, and trade are all negatively impacted, as evidenced in 2012 when severe floods contributed to reduced economic growth in agriculture and trade. The situation is compounded by greenhouse gas emissions (CO2, N2O, and CH4) levels from continued gas flaring and growing costal population [37, 38]. At same time, in the Eastern part of the zone, gulley erosion has devastated many settlements and farmlands. With the climate change hazards in the region attributed to various elements like human activities, ineffective policies, poor emergency preparedness, GHG emission and natural forces, tracking the evolving patterns of change in the area spatially, remains vital to planning [39]. Convinced that very little has been done to capture the concerns raised so far, this project will fill that void with focus on regional assessment of climate change in Southern Nigeria using mix scale tools of GIS and descriptive statistics with emphasis on the issues, trends, factors, impacts and efforts [40-44]. The paper has five objectives. The first aim concentrates on the use of GIS to measure the effects of climate change, while the second objective is to design a support tool for policy makers. The third aim stresses the design of a method for identifying the indices for regional climate strategy. The fourth objective is to create a framework for effective coastal zone planning with mix scale techniques of descriptive statistics connected to GIS. The fifth goal assesses the risks from climate hazards.
2. Materials and Methods
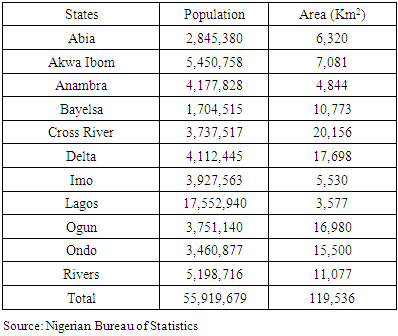
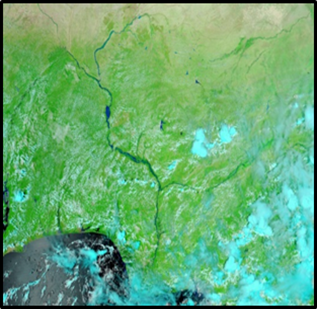
The study area in Figure 1 stretches through a 119,536 km2 area across 11 states in Southern Nigeria mostly in the Niger Delta region on the Atlantic Coast with a population of 55 million (Table 1). Many of the inhabitants reside in states located in low lying coastal areas where River Niger divides into numerous tributaries. The major states (Abia, Akwa Ibom, Bayelsa, Cross River, Delta, Edo, Imo, Ondo, and River, Anambra, Lagos and Ogun) in the study area of Southern Nigeria region are represented under three geopolitical zones made up of the Southeast, the Southwest, and the South-South zones [36].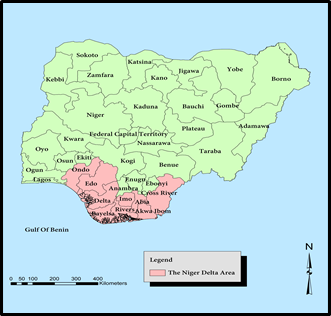 | Figure 1. The Study Area, Southern Nigeria |
Table 1. The State’s Population and Size
 |
| |
|
While the ecosystem of the area is highly diverse and supportive of numerous species of terrestrial and aquatic flora and fauna and human settlements, it boosts of one of the richest wetlands in the world [45]. With much of the region divided into four ecological zones made up of coastal inland zone, mangrove swamp zone, freshwater zone and lowland rain forest zone, there exists an extensive area of mangrove forests, farms and estuaries on a 3,122 km2 coastline. Considering the fragility of the ecosystem, the area is heavily prone to pressures from frequent extreme events and fluctuating temperature. Even though the Niger Delta area of the Southern region is an Oil and gas hub responsible for about 97% of the country’s total export, the Southern region remains at the receiving end of ecological hazards where heavy rainfall threatens communities continuously [46, 47]. Obviously, the climate of the Southern region characterized by strong latitudinal zones is progressively drier as one moves North from the coast. For that, rainfall stands as the key climatic variable in a setting known for a striking vacillation of wet and dry seasons in most areas. Accordingly, binary air masses that regulate rainfall consists of the misty northward-bound maritime air out of the Atlantic Ocean and arid continental air coming South through the African mainland. Under such conditions, the wet season which usually starts in February as moist Atlantic air, referred to as the Southwest monsoon, touches down in most of the Southern region. During that period, the start of the rainy season coincides with the occurrence of violent winds and dense but sprinkled rainstorms [36]. In all these, the highest level of overall rainfall occurs in the South-south, within the shorelines along Bonny South of Port Harcourt and East of Calabar, where the average annual rainfall volume surpasses over 4,000 mm. Most of the rest of the South-south and Southeast takes in around 2,000 to 3,000 mm of rain annually, and the Southwest (lying farther north) sees minor overall precipitation, mostly between 1,250 to and 2,500 mm yearly [48]. As a matter of fact, the average yearly precipitation of 1,900 mm for the Lagos area in the Southwest remains below the volumes in the South-south and the Southeast.Another twist to the study area stems from the vulnerability to sea-level rise and repeated ocean surges. These stressors constitute very serious dangers alongside coastal erosions that are already a menace in the Niger Delta. This will likely create problems of floods, intrusion of sea-water into fresh water sources and ecosystems and the destruction of stabilizing systems like mangrove with losses in agriculture, fisheries and general livelihoods. Based on all these, the most important environmental problem facing the study area is coastal erosion. Because coastal erosion remains an issue in the region, flooding of low-lying areas in the study area has been quite rampant. In the process, human settlements in the coastal region have been uprooted by coastal erosion, in certain areas, especially in Forcados where many oil wells were lost to the ocean due to erosion. Seeing that coastal erosions pose serious problems for economic activities in the study area especially natural resource sectors such as farming and fisheries. Coastal vegetation especially the mangroves, have also been lost to shoreline erosion [49].To further buttress the climatic risks facing the Southern region, in Egor and Ogida communities in Edo State, several houses have been abandoned by the owners due to flood and many more areas in the region are vulnerable to floods [26]. Considering that, the Niger Delta could lose over 15,000 km2 of land by the year 2100 with a one-meter rise in sea level. Calculations have also shown that a 20cm rise in sea level will inundate 3,400 km2 of the Nigerian coastal land [50]. The situation has been made worse by the fact that about 1 to 2 million people will be affected in a sea level rise of 30cm. In all these, it is predicted that Nigeria will lose about $9 billion as a result of the sea level rise, while at least 80% of the people of the Niger Delta will be displaced and 75% of land lost due to the low level of the region [51, 52]. Accordingly, coastal inundation significantly threatens Nigeria’s Southern coast, including two major cities, Lagos and Port Harcourt. Just as the country’s commercial capital, Lagos, responsible for over 50% of the wealth is prone to ocean surge [53], the Niger Delta being a major oil hub has more than 606 oil fields of which 360 are on shore and 246 off shore. Flaring incidents emanating from oil production in Delta results in the emission of 12 million MT of methane and 35 million MT of carbon dioxide yearly with much of that in the region [54]. With the apparent link between Green House Gas (GHG) emission, climate change, global temperature and sea level rise, the Southern region has also had its full share of rising temperature. Furthermore, since 1970 to the present, there have been several incidents of flooding which destroyed several homes and displaced many in the region. Considering the high level of exposures to climate change risks over the years in the study area and the damages to the ecology. There are now ample opportunities under a mix-scale orientation to turn previous omissions of climate change risks in the study area of Southern Nigeria as the centre piece of this research using the techniques that are currently available. Analysing the changing climate parameters in the 10 states of Nigeria’s Southern region with information gleaned from the mix scale model, has the capacity to crack the mystery surrounding the endless exposures of coastal communities to the menace of extreme events across time and space.
2.1. Methods Used
The paper uses a mix scale approach involving descriptive statistics and secondary data connected to GIS to assess climate change challenges facing the Southern region of Nigeria in West Africa. The spatial information for the enquiry was obtained from several agencies consisting of the World Bank group, World City data Base, the Economic Community of West African States (ECOWAS) and the United Nations Industrial Development Organization (UNIDO). Other sources of spatial information emanated from the United States Agency for International Development (USAID), The Nigeria Hydrological Services Agency (NIHSA), International Federation of Red Cross and Red Crescent, the Nigerian Red Cross, West African Service Center on Climate Change and Adaptation Land Use (WASCAL) and the Global Environmental Fund (GEF). In addition to that, the United Nations Environment Program (UNEP), the United Nations, the Organization for Economic Cooperation and Development (OECD) and The United Nations office for the coordination of Human Affairs (OCHA) also provided other information needed in the research. Generally, the bulk of climate variability indicators relevant to the region and individual states were obtained from the Nigerian Bureau of Statistics, Nigerian National Environmental Emergency Management Agency (NEMA), Nigerian Meteorological Agency and the World Metrological Organization for some of the periods. On the one hand, the World Bank Group provided the secondary data on the numbers, frequency of disasters, sea level rise, floods, temperature, and number of casualties from climate change, green house and CO2 emissions. On the other, the United States Geological Services (USGS), and the United Nations Food and Agricultural Organization (FAO) offered the mangrove vegetation data for the region.For additional data needs, the United Nations office for the coordination of Human Affairs, World Health Organization (WHO) and IRIN were respectively critical in the procurement of information on the displaced persons from floods and econometric data highlighting coastal impacts of environmental change. In a similar vein, the United Nations Educational Scientific and Cultural Organization (UNESCO), Oxfam and Intergovernmental Oceanographic Commission of UNESCO remained instrumental in the provision of other relevant information. Given that regional and federal geographic identifier codes of the states were used to geo-code the info contained in the data sets. This information was processed and analyzed with basic descriptive statistics, and GIS with attention paid to the temporal-spatial trends at the county, state and regional levels in Nigeria’s Southern region. The relevant procedures consist of two stages listed below.
2.2. Stage 1: Identification of Variables, Data Gathering and Study Design
The initial step involves the identification of variables required to appraise climatic variability with emphasis on trends and impacts in Nigeria’s Southern region. The variables consist of indicators grouped under socio-economic, demographic, physical and environmental elements. The demographic field consist of population by state and region, the population numbers of cities, population growth rate, people affected or victims, number of deaths from hazards, exposed population and hazards exposure in coastal areas. The socio-economic elements cover the monetary costs of hazards and monetary assets in dollars. Among the data listings, the environmental indices consist of the distribution of mangroves, percentage of change, land cover data of size of mangroves, forest land area, vegetation, urban and industrial areas, water bodies, percentage of increases and decreases in land cover elements, vulnerable coastal areas, total greenhouse gas emissions and percentages of change. The physical and climatic variables encompass temperature, actual and projected, annual heat days by ecozones, annul heat wave days, projected length of rainy days, total Green House Gas (GHG) emissions, the amount of rain, Carbon dioxide (CO2), methane Gas (CH4), nitrogen oxide (N2O) and the percent of total emission. The other variables include submerged areas in km2, percentage of submerged area from floods, the number of local governments under submergence, the types of natural disasters and the dates of occurrence and associated hazards from natural disasters. Added to that are the number of people affected by disasters, annual rainfall volume, and the percentage of mean rainfall in the wet and dry season. The process continued with the design of data matrices for socio-economic, demographic and environmental, physical and climatic variables covering the periods from 2000, 2006, 2008, 2010, 2012 and 2016. The design of spatial data for the GIS analysis required also the delineation of state, city and local government, and regional boundary lines. With boundary lines unchanged, a common geographic identifier code was assigned to each of the units to ensure analytical coherency.
2.3. Stage 2: Data Analysis and GIS Mapping
In the second stage, descriptive statistics and spatial analysis were employed to transform the original socio-economic and climatic indices, and demographic and ecological elements of climate change and others into relative measures (percentages/ratios). This process generated the parameters for assessing the trends, impacts, factors, and indices such as the frequency of climate hazards, the number of disasters, the number of deaths, total population, CH4, N2O and CO2 emissions. The technique also helped track the distribution of Green House Gas emissions, mangroves area distribution, forest land size, vegetation, urban and industrial areas, water bodies, percentage of increases and decreases in land cover elements. This was facilitated by measurements and comparisons of the trends over time. While this approach helps gauge the extent and form of climate change risks, vulnerability of coastal population adjacent to the shorelines and low-lying areas, number of victims, the frequency of storms and other hazards and the loss of mangroves. The tables, graphs and maps highlight the temporal distribution of climate variability parameters made up of changes and total population, indices, monetary costs of hazards, extreme temperature rate, rainfall volume, number of rainy days, and the number of hot days in the ecozone.The remaining steps involve spatial analysis and output (maps-tables-text) covering the study period, using Arc GIS 10.4 and SPSS 20.0. The spatial units of analysis under a mix scale consist of states, cities, region, local government areas and the boundary and locations of areas exposed to climate risks along the shore lines. The geographic data for Nigeria’s Southern region which covered its boundaries and states and cities, also includes ecological data of land cover files, and paper and digital maps from 1975-2016. The process continued through additional info from the world city population interactive electronic digital data involving maps, charts, shape files and map indices that highlighted the individual countries spatial area units of states, counties, administrative units, towns, regions and communes over a different range of time.From there on, an in-depth extraction method was utilized to pinpoint the population proximal to ocean waters off the Southern Atlantic. This entailed using techniques of magnification under varying angles oscillating in and out at full view to capture vulnerable shorelines that were not previously visible for a better view on the interactive maps of coastal cities in the Southern Nigeria region. That approach provided opportunity to track cities adjacent to coast lines and then gauge their level of vulnerability in each of the states in the study area and ascertain if they met the criteria for selection. After that, the outputs of the spatial data were mapped and compared across time from the 1970s to 2017 to see the dispersion of the regional climate change and the resultant hazards in the form of heavy rainstorms, deaths, the number of hazards, population change, and the various factors among the states and cities of the study area.
3. The Results
This section of the paper focuses on temporal and spatial analysis of climate change trends in the study area. There is an initial focus on coastal land use and land use changes, the environmental impacts based on flooding, rainfall, and temperature using descriptive statistics. The other portions highlight the GIS mappings and the identification of the factors made up of physical forces and climatic variables, Green House Gas emissions and population. This is followed by current efforts to stem the tide of climate change hazards.
3.1. Coastal Land Loss from Sea Level Rise
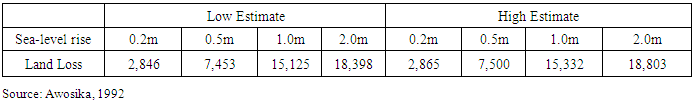
The anticipated changes under the low forms to high levels of coastal erosion are calibrated from sea level rise scenarios in the Niger Delta. Since this comes amidst growing threats of climatic variability in the Southern region. The scenario is characterized by the assumption that heavy land loss from the exposures to low-lying coastal areas of the zone would bring quite a catastrophic ending in a way not seen before in the region. In that light, the categories of the eventual barrages from by rising sea levels of 0.2m-2.0m in the lower Southern coastal zone of Nigeria will result in the disappearance of 2,846km2-18,803km2 area of land over all. Based on further variations measured at 0.5m, 1.0 m-2.0m in sea level rise under the low category, estimated land loss from coastal erosion increases by 7,453,15,125 and 18,398 km2 respectively. At similar paces in sea level rise, the same trend occurs through higher surges in land losses estimated at 2,865 km2, 7,500km2 and 15,332 km2 in the Niger Delta region (Table 2).Table 2. Total Land Loss (km2) From Coastal Erosion and Floods Estimated from Different Scenarios of Sea Level Rise in the Niger Delta
 |
| |
|
3.1.1. Land Use Changes
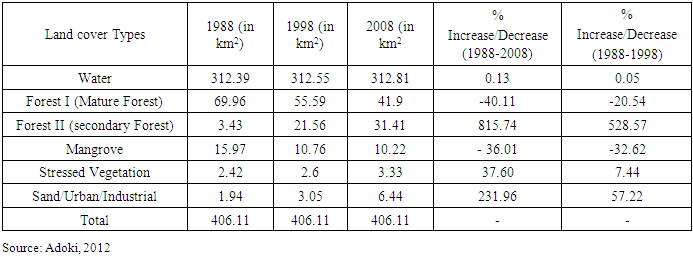
Evidence of land uses associated with climate change in the Southern region of Nigeria can be further buttressed by analyzing variations in climate parameters rooted in two major cities of Forcados and Warri in Delta state over the years. The notable land use trends involving climate change parameters in the Forcardos area of the Niger Delta all through 1988 to 2008 showed that Green House Gas emission sinks and coastal erosion buffers like mature forests, and mangrove declined while stressed vegetation stayed on the rise. During the same periods, land cover types associated with urban areas and industrial areas rose notably. Among these indicators, mature forest and mangrove dropped significantly at back to back paces beginning at 69.96km, 55.59km, to 41.9km and 15.97 km, 10.76 to 10.22 km in the periods of 1988, 1998 through 2008. At the same time, stressed vegetation increased further from 2.42km, 2.6km and 3.33km as sand, urban, and industrial land cover grew notably starting at an area distance of 1.94km, 3.05km to 6.44km during a two-decade span between 1988 to 2008 (Table 3).Table 3. Land Use Change in the Forcados Area, 1988-2008
 |
| |
|
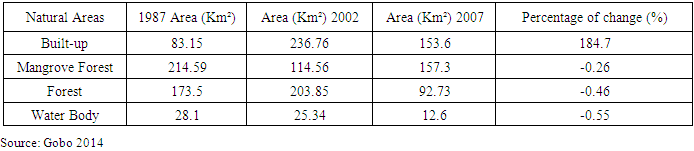
In the case of land use trends in the Warri area of Delta state, the table highlights a summary in the distribution of various natural areas from built up environments to water bodies during 1987 to 2007. Among these indicators, the size of built up areas in 1987 through 2012 jumped from 83.15 km2 to 236.76km2 and continued at 153.6 km2 over time. In other words, in the ensuing years, built environments often associated with urbanization increased in 2007. The other important point worthy of note in the temporal profile as shown from table, stems from the continual slide of both mangrove forest and forested areas at the Warri area. While the former in 1987 began with an area coverage of 214.59km, in the periods 2002 to 2007, the mangrove forest areas dropped further by 114.56 km to 157.3km. Forestland on the other hand, went from 173.5km to 2013.85km during 1987 and 2002, only to decline by 92.73km in 2007 (Table 4). Considering the quest for more space in the area to meet the needs of a teeming population through the draining or conversion of aquatic bodies due to the pressures mounted from human activities, water body fluctuated from 28.1km, 25.34km and 12.6km respectively during the years from 1987 to 2002, and 2007 (Table 4).Table 4. Land Use for Warri 1987-2007
 |
| |
|
With such changes in the zone comes the loss of critical vegetation cover and rising stress level for forested areas coupled with mangroves area disappearance in the Deep South coastal areas of Forcados and Warri between 1988-2008 and 1987-2007. During these periods, both mangroves and forests fell by -40.11 to - 36.01% and -20.54 to -32.62% at Forcados and continued at -0.26 to -0.46 at Warri respectively. Aside from their roles as emission sinks and shoreline buffer against coastal erosion in a region saddled by large the concentration of Green House Gasses than the other parts of Nigeria. The size of stressed vegetation at Forcados rose significantly at a rate of 37.60% to 7.44%. With time (1988-2008 and 1988-1998, and 1987-2007), urban and built areas also soared significantly by 231.96 % to 57.22% and 184.7% at both the cities of Forcados and Warri in Delta state (Table 3 -Table 4).
3.2. Impact Assessment
This portion of the paper highlights the associated impacts of climate change made up of current and projected rainfalls, fluctuating temperature and the temporal distribution of flood hazards in the study area.
3.3. Current and Future Variations in Climatic Predictors: Rainfall and Temperature
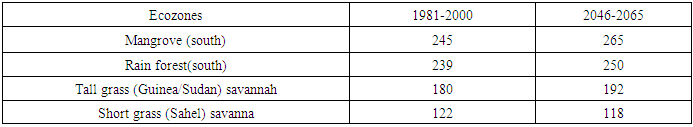
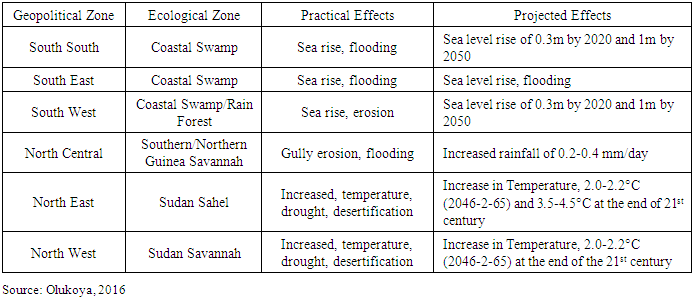
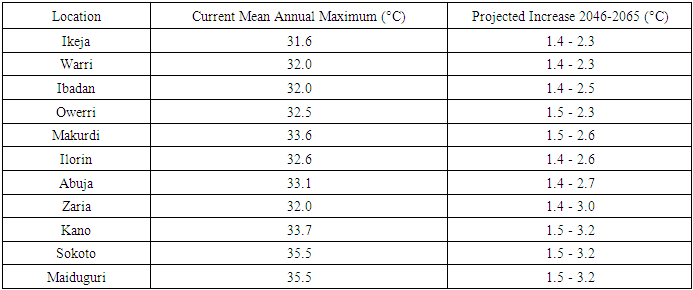
Just as current and projected lengths of rainy season appeared more in the ecozones of the South, the region not only has lower exposures to extreme and annual heat days as well from 1981-2000 and 2046-2065. But even at that, both practical and projected effects of changing climate in the region based on a different range of parameters shows the threats of sea level rise and flooding (listed at 0.3m and 1 m) remain immanent in the zone from 2020-2050 (Table 5 and Table 6). Among the cities in the study area, at a current mean annual maximum temperature of 31.6°C, 32.0°C and 32.5°C, the cities of Ikeja, Warri and Owerri will by the years 2046 through 2065 see their degree of hotness increase by 1.5 - 2.3°C based on the projections (Table 7). Further along these lines in the major ecozones in the country, the present annual extreme heat days from 1981 to 2000 calibrated for the mangrove and rainforest zones in Southern Nigeria reached 3 to 15 days. This is projected to grow by 41-66 days from 2046 to 2065, but at much lower level compared to the other zones. In addition to that, the actual annual heat wave days (20.0 to 52.2 and 0.3 to .46) in 1981 through 2000 is predicted to rise over 101 days in 2046 to 2065 with variations of 7.4 to 27.5 days at the temperature scales of 35°C-38°C or more by 2046 to 2065 along the mangrove and rain forest ecozones in the Southern region of the country (Figure 2).Table 5. Projected Length of Rainy Season by Zone
 |
| |
|
Table 6. Climate Change Implications or Impacts and Projections
 |
| |
|
Table 7. Current and Projected Maximum Daily Temperature by Location
 |
| |
|
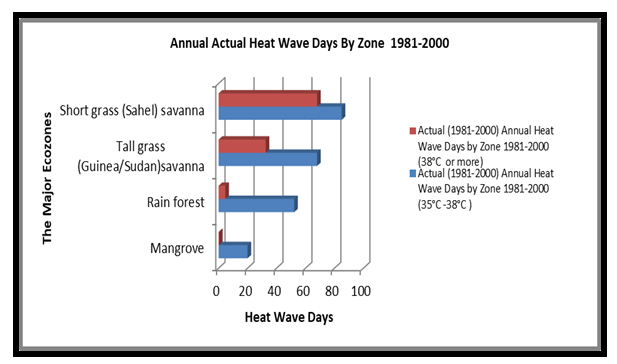 | Figure 2. The Distribution of Annual Heat Wave Days 1981-2000 |
3.4. The Threats of Violent Floods
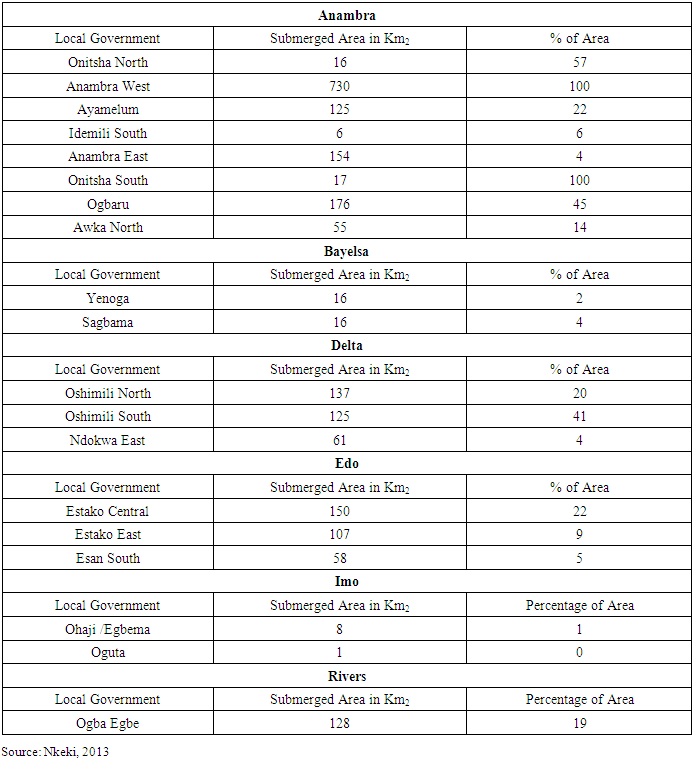
The other known threats of climate change in the study area as manifested in the 2012 flood along the lower Niger Basin, involves the submergence of 2086 km2 area in about 25 local government areas in 6 states. Among the states in the epicenters of the disaster, Anambra, Beyelsa and Delta topped the list of areas with more submergence while Edo, Rivers and Imo followed up respectively. For that, the risks from the 2012 floods left about 1279 km2 areas under submergence in 6 local governments in Anambra state. Two other states in the zone (Edo and Delta) had over 300km2 submerged areas while the neighbouring state of Rivers suffered the same disaster in a 128 km2 area. Of great concern in the occurrence of flood disasters is the percentage of areas covered by water in the various states. Aside from the two local government areas in Anambra state (Anambra West and Onitsha South) with 100% of areas covered by floods, the towns of Oshimili South and North in Delta state saw 20-41% of their areas under submergence in 2012. In the same vein, the communities of Estako Central and East each had 22 to 9% submerged parts (Table 8). Furthermore, the gravity of climate change effects is further demonstrable with the extreme events that occurred from Abia to Ondo state over the years in several communities in the face of large barrage of floods and rainstorms during the 1990s to 2001. With that also came extensive destruction and submergence of infrastructure and properties comprising of houses, schools, markets, farms and the displacement of 300,000 citizens. Further along these lines, in the 10th of July of 2011, a 17-hour heavy downpour in the Lagos area, not only affected 1,500 households, but it rendered 12,500 citizens homeless. In August of the same year, 98 people were killed in Lagos from flood hazards as well [36].Table 8. 2012 Floods in the Lower Niger Basin Area of Southern Nigeria and Submergence
 |
| |
|
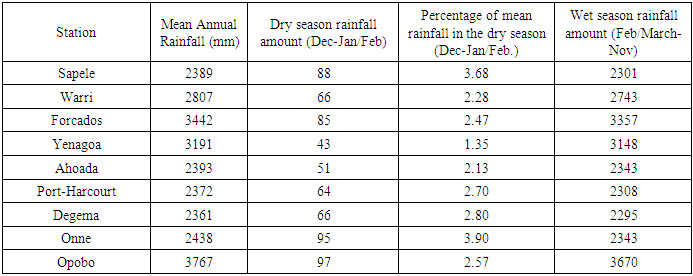
Looking further at seasonal variations in rainfall in cities in the Niger Delta, the values for three set of towns (Opobo, Forcados and Yenagoa) in the states of Rivers, Bayelsa, and Delta, surpassed the other cities in the volume of annual and wet season rainfall amounts (3,767 mm to 3,148 mm) respectively. The other group of 6 cities made up of Sapele, Warri, Ahoada, Port-Harcourt, Degema and Onne in the region saw mean annual and wet season rainfall of 2389 mm to 2,807 mm and 2,301 to 2,743 mm (Table 9). For that, it comes as no surprise that in 2010, official records of daily heavy rainfalls of 100 mm and higher among the other towns in Nigeria pointed to more occurrences in the study area. During that period, three of the major cities in the Southern region (Benin, Umuahia, and Uyo) experienced the highest levels of rainfall (184.6, 183.8, 199.5 mm) in the country in the months of June to September. Elsewhere, the cities of Eket, Calabar, Owerri, Ikom, Port Harcourt and Warri had rainfall levels of 132.3mm, to 108.7 mm (Figure 3).Table 9. Seasonal variation of rainfall (mm) in the Niger Delta
 |
| |
|
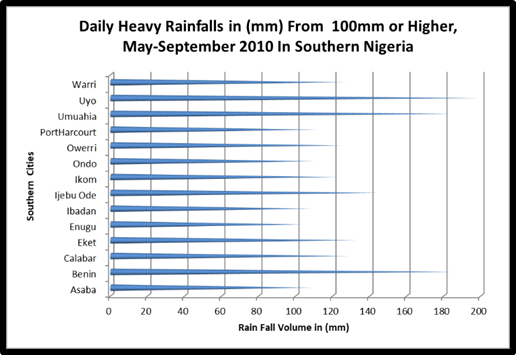 | Figure 3. Daily Heavy Rainfall Distribution in the South, 2010 |
On the Decadal side of things, the experience of two largest coastal cities of Lagos and Port Harcourt adds another interesting dimension [36]. For Port Harcourt, the rainfall levels and temperature during the first decades of 1950 to 1979 and 1950-1989 revealed similar patterns. During those years, the precipitation volumes began at 2,261.52 mm to an all-time high of 2,682.83mm in 1960-1969. With time, the rainfall pace later stabilized to 1950s levels of 2,244.57 to 2,264 mm all through 1970-1979 and 1980-1989. By the 1990s and 2000s, the volumes of rain fall in the Port Harcourt went from over 2,300 mm to 2,670.4mm. In the Lagos Island area, the rainfall characteristics in 1971-1995 and 1996-2005, shows that the (average, maximum, minimum) number of rainy days which totalled 112, 163 and 76 days in the 1970s to mid-1990s, exceeded the durations in the rain days ( 82, 105, to 69 days) during the late 1990s to the 2000s. Added to that, the mean rainfall volume for Lagos Island in the two decades ranged from 1,697.79 to 1,647.26 mm respectively [36].
3.5. Water Resources
From the scale of liabilities emanating from changing climatic parameters in Nigeria’s Southern region over the years, one must consider the hydrological dimension. Accordingly, climate change affects the nature and characteristics of most fresh water assets upon which the nation and the region derive their freshwater. Extreme climate events have been seen to overwhelmingly impact water resource use and security, an element that raises the susceptibility of citizens to diseases. Even though the impacts vary between ecozones, mounting concerns center around surplus water often tied to inundation and aspects of water stress like drought, declining water quality and salt water intrusion. The other threats consist of sea level rise and the extent to which poor water quality in surface and ground water system pose bigger challenges than ever. Because abundance does not necessarily translate into availability given the risks of climate change to the study area, the nature of hydrological stress in much of the area reveals the vulnerability of citizens of the Southern coastal region to the impacts of climate change. The Niger Delta is one of the most important wetlands in Nigeria, the largest in Africa and third largest in the World. As mentioned earlier, the Southern ecological zone where the Delta is located known for high rainfall, is currently confronted by irregularity in the rain fall patterns. In Ikot Ibom Itam community of Akwa Ibom state, one of the major coastal cities in the Delta zone of Nigeria, after the barrage of heavy rainfalls there led to the disappearance of about four local streams, the flooding of many homes and heavy erosion damages ensued. Furthermore, in Nigeria, inundation remains the primary threat for at least 96% of the land areas at risk. With a 1-m rise in sea level on the coast, up to 600 km2 land area would be at least at risk. The areas include parts of Lagos and other smaller towns along the coast. The periodic overflow of the Atlantic Ocean across the Bar beach area of Lagos is an indication of a phenomenon that may accelerate as climate change intensifies and sea level rise even further.
3.6. GIS Mapping and Spatial Analysis
The GIS analysis covers spatial display of the exposure of major ecozones and population centers and oil and gas infrastructure to the risks precipitated from extreme climate events in the Nigeria’s Southern region. Of importance in the analysis are the intensity of floods and the vulnerability of low-lying communities in the study area to sea levels rise.Looking at the spatial distribution of climatic parameters in the ecozones and the vegetations in the study area of Southern Nigeria and their vulnerability to climate change in the country. The region lies adjacent to low lying coastal areas with a trio of ecozones made of rainforest, fresh water swamps and mangroves clustered across the zone. Essentially, the rainforest lies in the upper level, the freshwater zones in the middle and the mangroves vegetation in the outer ridge. Further, notice that the vital rainforest belt on the upper crest of the map traverses’ vast areas located on the lower Niger areas of the country from the South west, the Southeast to the South-south zone. The sensitive rainforest vegetations or ecozones in green as the map shows, stretches through the South west cities of Abekouta, Akure and Benin City in the South-south and the South east city of Owerri known for their heavy precipitations originating from monsoon currents out of the Gulf of Guinea and the Atlantic Ocean. Closer to that comes the fresh water swamps zone concentrated in the South west area of Lagos, the South-south zone, through the states of Edo, Delta, and Rivers. The mangroves on the other hand, extends from the lower edge of Lagos at a lesser elevation to Port Harcourt in the South or South East. The implications in the context of climate change stems from the exposure of the cities and communities of the ecozone, to flooding, coastal inundation and submergence brought about by heavy rain storms (Figure 4).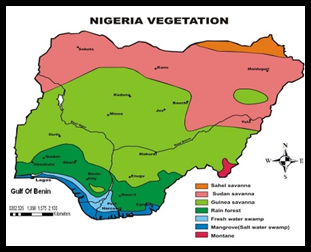 | Figure 4. Ecozones and Exposure to Climate Change |
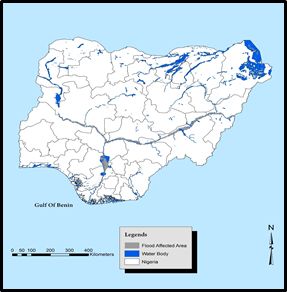
The extent of heavy flooding between 2002-2012 shows coastal boundary in light blue, extreme flood areas, rivers and their sources, and towns impacted near the Atlantic Ocean in those periods. On the lower side of the map covering the Southwest, Southeast and South-south. The pressures from the shear presence of rivers and water sources that surged over their banks from Anambra in the Southeast to the areas in Delta state, Benin in Edo, Lagos, Port Harcourt, and Calabar in Rivers and Akwa Ibom states were fully felt. The ferocious nature of downpours was not only extensive enough in inflicting heavy damages on the communities in the region, but the extreme flood areas from the Lagos and Benin axis of the map run through the cities of Port Harcourt to Calabar in the lower south (Figure 5). Shifting back to the spatial dispersal of flooding from 1985 to 2014, the map shows that the Lagos area exhibits a high propensity to frequent flooding while the areas in light orange (Edo, Delta, Bayelsa, Anambra, Imo and Akwa Ibom appear clustered in places in the Southern region deemed prone to relatively moderate frequency in flooding (Figure 6).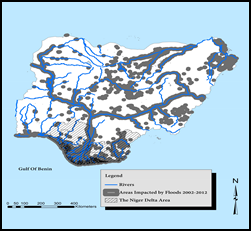 | Figure 5. Areas Impacted by Floods 2002-2012 |
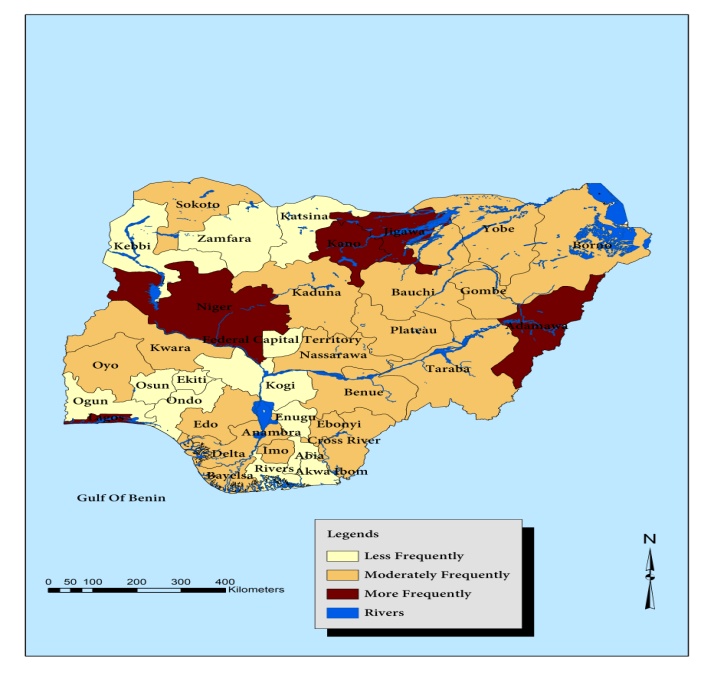 | Figure 6. Spatial Dispersal of Flooded Areas, 1985-2014 |
To further buttress the vulnerability of the low-lying states and communities of the Southern region, note the presence of two major rivers Benue and Niger and their adjoining tributaries and the at-risk areas together with flood areas within striking distances. Considering the vast presence of creeks and lakes in the lower South, the barrage of frequent floods and heavy storms events which occur at vicious pace exposes the localities to inundation which lead to the destruction of built and natural environment in the zone (Figure 7). Added to that are images in brown, blue and white patches depicting flood prone areas and waterbodies with the risks hovering atop of the low-lying areas in the lower South (Figure 8).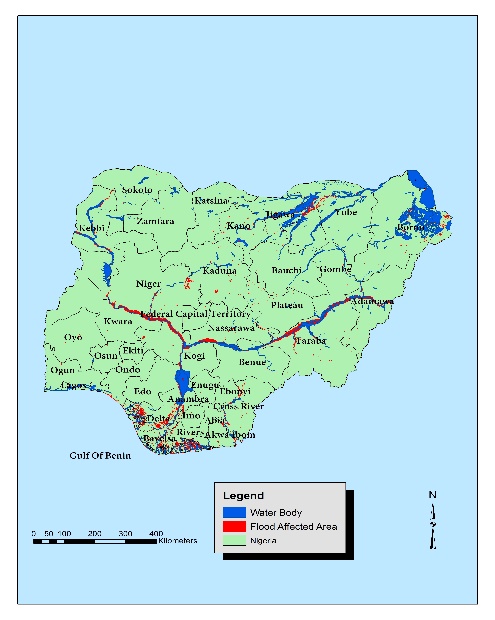 | Figure 7. Water Body and Land Areas Impacted by Floods |
 | Figure 8. Flood Risk Areas |
The vulnerability of low-lying cities to extreme climate forces in the region from Lagos in the South west to others under lower elevation in the Niger Delta like Bayelsa, Rivers and Edo, with vast network of oil and gas well in the background remains visible. The actual elevation scales of above sea level classified as under 1-2 meters and 3-4 meters are concentrated in the Ondo areas and Benin and in between the South-south zone of Bayelsa and Rivers state onto the Gulf of Guinea (Figure 9). Furthermore, the elevation map of different scales shows the prevailing patterns in the country together with patches of areas deemed flood prone in red not far from the states in the study area. With the lowest elevation levels of -25 to 130 meters in white robustly spread across the Deep South beginning from Lagos in the South west to Southeast zones of Bayelsa, Rivers, Cross River, Rivers and parts of Imo and the other areas. Then it does not come as a surprise to see why the Southern coast and the communities within the vicinity are of often at the receiving end of frequent cases of extreme climate events year after year. While this is never an attempt to discount the plights of the other areas of Nigeria from climatic disasters, communities in elevation levels of 140 meters and above have also had their full share of unwanted hazards as well (Figure 10). The visual images of the 2010-2012 floods on the maps not only shows some similarity, but the lower side of the map clearly highlights patches of cloudy white masses showing the intensity of the floods near to the Lagos axis in the Western region and clusters of areas impacted by rain storms and towns concentrated on the Lower side of the map in and around the South-south and the South east. The 2012 version of the map dubbed the deadliest or violent flood in 40 years in the country resulted in the destruction of several homes and communities and the eventual submergence of towns in the lower Niger basin of the country concentrated in the study area (Figure 11-12).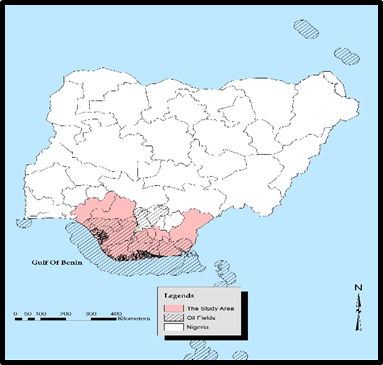 | Figure 9. Oil Facilities and the Risks of Sea Level Rise |
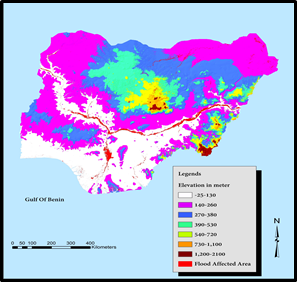 | Figure 10. Elevation Distribution and Flood Risks |
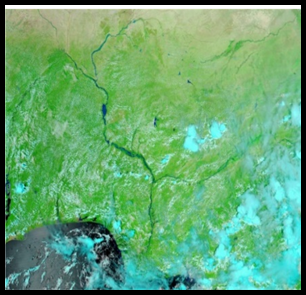 | Figure 11. 2012. Image of Flood Hazard in Southern Nigeria |
 | Figure 12. 2010 Image of Flood Hazard in Southern Nigeria |
Considering the place of climatic parameters in influencing the exposure of citizens to natural disasters and extreme events like sea level rise, storms, and flooding and other elements in the study area. One noticeable thing from the spatial distribution reflects three different classes in red, green and yellow highlighting the percentages of population change from the coastal lagoon part in the South west to the Mid-west and lower South east. From the patterns in place, the highest population growth rates (in red) of more than 150% from 1991 to 2016 in the South west zone of Ogun surpassed the levels of the other states throughout the Southern region. From there, emerges a much more different spatial pattern in mostly green color with a dynamic spread across cities and a group of 7 states from Lagos in the South west to Cross Rivers in the South east where population increments hovered around 100-150%. Consistent with the geography of changing population are the next group of states classified in yellow under the 50-100% range where Ondo, Edo, Bayelsa, and Anambra and Abia stood out in that category (Figure 13).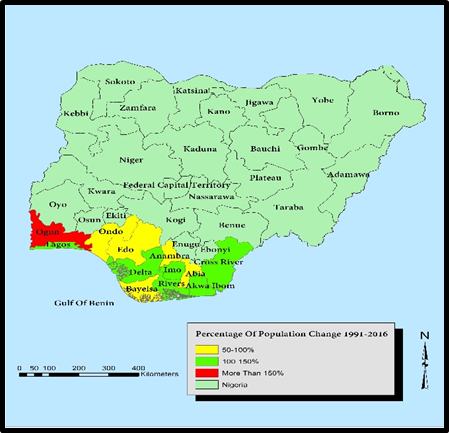 | Figure 13. The Distribution of Population Change 1991-2016 |
3.7. Factors Responsible for the Changing Climate and Efforts
The risks posed by the changing climatic parameters in the Southern region does not operate in a vacuum. It is associated with several, physical and environmental, and socio-economic factors such as population change, greenhouse gas emissions, changing temperature and elevation. These factors are presented one after the other in the following paragraphs.
3.7.1. Physical Elements: Climate, Elevation and Temperature
The elevation of much of the areas in the Southern region in white classified as 1-206 meters show low lying coastal areas with a proximity to the Atlantic Ocean, the Gulf of Guinea, from the South west, South-south and South east areas. These attributes and the rising population in the low-lying areas in the map makes them highly vulnerable to sea level rise, flooding, coastal inundation and heavy rainstorms. This comes amidst concerns over the threats from the impacts of current and projected hazards involving changing temperature in the ecology of the region given the linkages to extreme climate events. Aside from the variability in the degree of hotness in the rainforest and fresh water swamps ecozones of the Southern region of the country and extensive volume of violent rain storms. The heating up of the Southern ecozone prompted by the heavy concentration of Greenhouse Gases into the region’s atmosphere also coincides with the increasing rate at which the melting of the Arctic polar ice is dumping large volumes of water onto the Atlantic due rising global temperature. This in turn accelerates the occurrence of annual extreme climate events threatening low lying coastal communities in the Niger Delta and those in the South west city of Lagos and nearby states on the lower Niger basin from Anambra to Imo in the South east, hence the connection to climate change (Figure 10).
3.7.2. Green House Gas Emissions
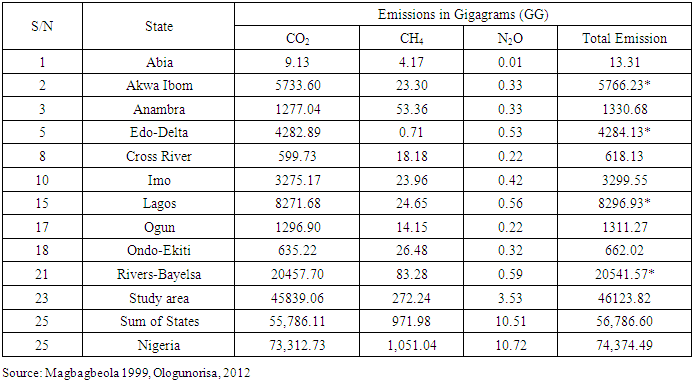
Being the oil and gas hub of the country and the fact that the region accounts for the biggest sources of total Greenhouse Gas emissions of 75% in Nigeria. The oil producing states of Akwa Ibom, and Rivers-Bayelsa with 10.16% to 36.18% of Green House Gases outpaced the others while Lagos followed up with 14.62%. The yearly emission levels showed that, of the 73,312.73 GG totals for the entire country, the study area’s CO2 accounts for a total of 45839.06 Gigagrams (GG). Such levels of emission indicate a heavy concentration among the states in the region. Even though the overall methane CH4 and N2O gas emission distribution for the South stands at 272.24 and 3.53 GG respectively compared to the national totals of 10.51.04 to10.72GG. The states of Rivers-Bayelsa, Akwa Ibom, and Lagos with 20541.57, 5766.23 and 8296.93 GG held on to the top spots as the largest emitters of Green House Gases in the country and the Southern region. The trio of other states with sizable emission levels (4284.13 GG, 3299.55 GG, 1330.68 GG, 662.02 GG) of Green House Gases also includes Edo-Delta, Imo and Anambra and Ondo-Ekiti (Table 10). Considering the region’s (Niger Delta) role as the oil and gas and economic hub of the country and the fact that the region accounts for the biggest sources of the total greenhouse gas emissions measured as the ¾ of the volumes in Nigeria, the trend remains a major unknown concern in the country. The fact that the other group of states such as Imo, Anambra and Edo-Delta accounted for 5.81%, 2.34% to 1.62% of Nigeria’s emission during the same periods (Figure 14), implies that the recurrent emission of GHG in the Southern region threatens every aspect of the surrounding ecozones.Table 10. The Yearly Emission Levels for Green House Gases
 |
| |
|
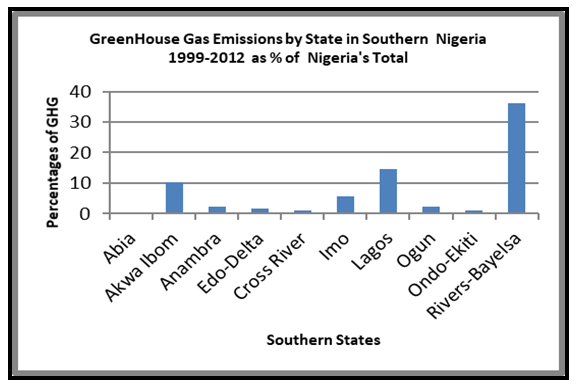 | Figure 14. Green House Emission by State in Southern Nigeria as Percentage of Nation’s Total |
3.7.3. Population Growth
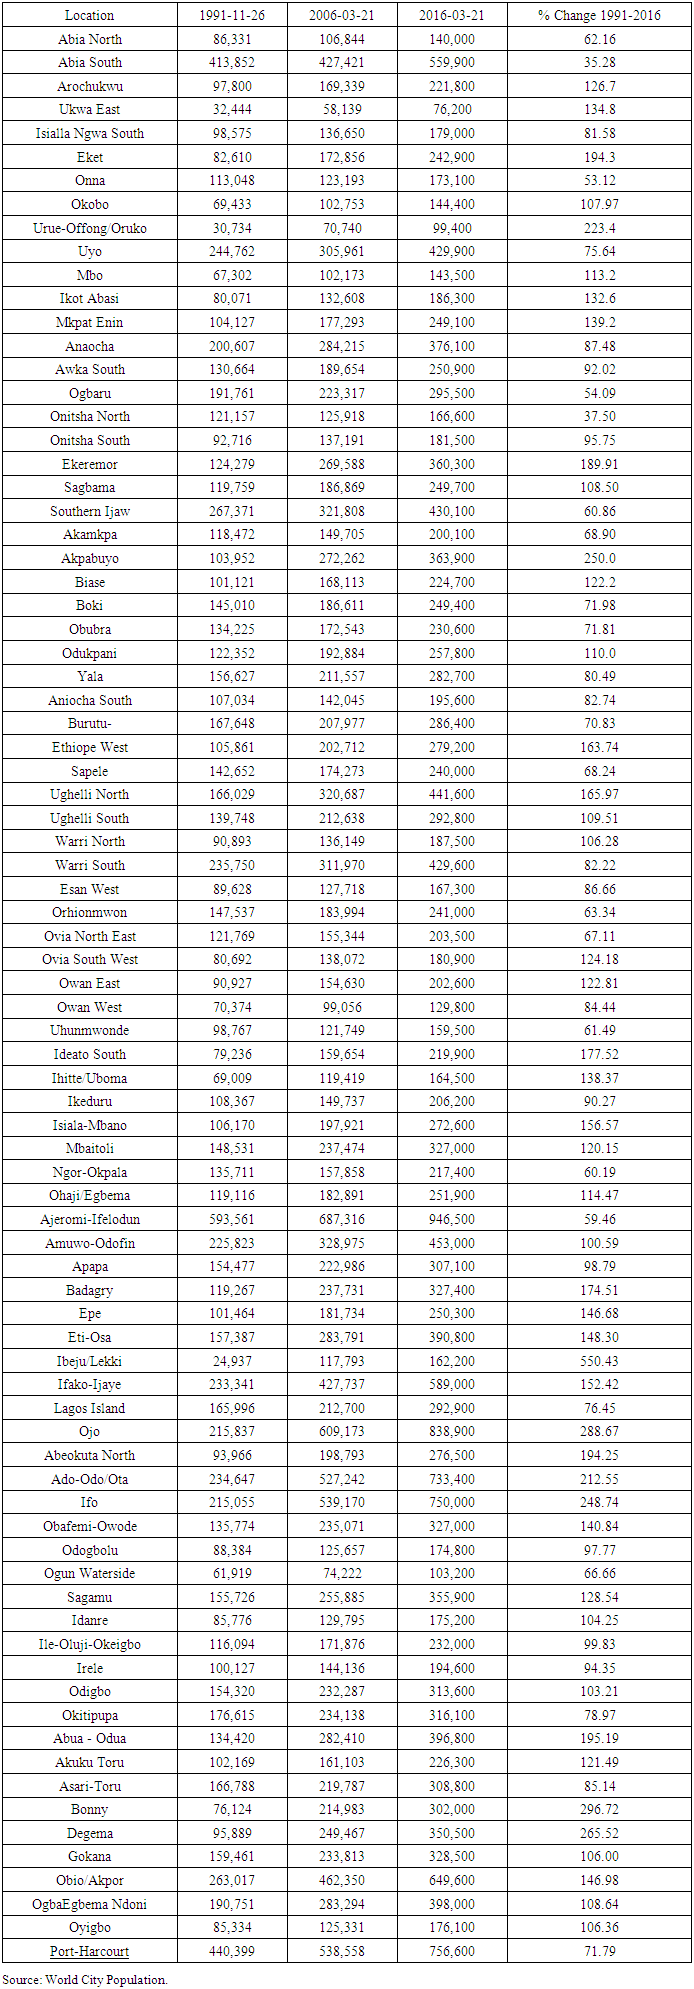
Over the last several years, the population figures in the periods, 1991, 2006 and 2016 have grown enormously at levels that put communities on harm’s way in the study area. At an average population growth rate of 124% from 1991-2016 among at risk low lying coastal cities and those areas within their vicinity in Nigeria’s Southern region. The vulnerability of the cities to extreme climate events like flooding, coastal erosion, and storm hazards seems fully amplified by the frequency of double to triple digit growth levels that occurred in many of the states deemed prone to climatic disasters during the years in question. With most of the areas located in the rainforest, and fresh water swamp ecozones of the region given their propensity to heavy rainfalls, the teeming population levels of 134.8% to 265.52% in the old South East cities of Ukwa East, Eket, Mbo, Onitsha South, Akpabuyo, Southern Ijaw, Bonny, Degema, and Port Harcourt does not seem different from the population growth levels (106.28-550.43%) in the Mid-west and Western cities from Warri North to Ibeki Lekki in Delta and Lagos state. Such rates of population increment from 1991 through 2016, requires basic infrastructural expansion involving new road design, high way construction, the development of new neighbourhoods and towns with encroachment and exposure onto ecologically fragile and low-lying areas often threatened by extreme climate events. With the economic opportunities provided in these areas as port cities, financial hubs and major centers of public and private sector employment and their role as after sought destinations. Citizens who flock in droves into these places in the face of yearly barrage of heavy rainstorms do put themselves on the path of natural disasters associated with climate change in the study area. Table 11. The Population Trends in Coastal Cities in the Study Area
 |
| |
|
3.8. Climate Change Mitigation Measures
Realizing the impacts on development, on the policy side, there is a growing awareness on the need to integrate climate change indices onto national development. For that, the Federal government is gradually setting aside portions of the national budget to address the risks to climate change in sensitive areas. To that effect, among the states in the study area, Lagos state demonstrated interests in tackling climate change risks by organizing regional conferences on the subject matter between 2009 and 2010. While Lagos state is earmarking vast amounts of its yearly budget to research the effects of sea level rise and marine ecology, Delta has followed also in that direction. In the context of fiscal policy instruments, the Federal Government of Nigeria has also initiated the National strategic Climate Change Trust fund to improve the scale of interventions at all tiers of governance. This will build heavily on the capacity to coalesce collaboration between development agencies through the infusion of more resources to track climate hazards. Under the current policy instruments, the nation is finalizing the content of a national climate change policy and response strategy. Under the proposed approach, the environmental component of the nation’s 2010-2020 blue print, supports a commitment towards sustainable management of the nation’s natural resources amidst changing climate. Realizing the gravity of extreme climate events and the need to augment Nigeria’s capacity to produce observable climate info and monitoring networks, the country created the Nigerian Metrological Agency (NIMET) in 2003 with an in-house climate research section for the development and delivery of climate info [4]. Recognizing the consequences and adverse impacts of climate change on Nigeria, the country joined the global community to adopt treaties meant to tackle climate change. From then on, the country became a signatory to UNFCCC in 1992 and ratified the Convention in 1994 together with the Kyoto protocol in 2004. With time, the nation went on to ratify the Paris Agreement in March 2017. Considering the risks posed by climate change and global warming and the required implementation of stipulated provisions under the climate conventions of which Nigeria is a party to, the Federal government created the department of climate change unit in the Federal Ministry of Environment to coordinate National climate initiatives [55]. Convinced about the challenges of little understanding of climate change risks nationwide, Nigerian Conservation Foundation, has been in the forefront of changing weather mitigation through an ongoing enlightenment campaign. Under that initiative, the pilot phase of the information campaign commenced in 2008 with yearly festivity of the World Environment day titled CO2: Kick the Habit. Along with the festivity came the formation of School Conservation Clubs which gradually permeated into different areas throughout Nigeria under the auspices of the education unit of the NCF formed to support high schools on ecological sustainability issues. In that way, the NCF remains active in the ongoing climate change enlightenment campaigns to educate citizens, especially young people throughout Nigeria and women in the country side environment ranked as the most susceptible groups to climate change and its associated effects [55].
4. Discussion
From the analysis carried out in this research under a mix scale orientation, it is evident that the states in the Southern region suffer from the threats of extreme climate events. With large segment of Nigeria’s urban populace and commercial activity concentrated on the low-lying coastline that span the Niger Delta and the Lagos axis. Exposure to changing climate continues to threaten the safety of the major population centers of the zone. Seeing that the country’s CO2 and CH4 discharges emanate from the South, the probable impacts of sea level rise from warming temperature puts states like Lagos and others at the risk of submergence. The plights of the study area are compounded by the spectra of coastal storms and ever-changing weather patterns as the Niger Delta grapple with fluctuating temperature and downpours year after year. Given that natural disasters led to the death of many citizens between 1999 to 2015. The presence of oil and gas activities and the emission of tens of millions of MT of flared CH4 therein annually warms up the zone. In the process, it comes as no surprise that from 1960-1970, the Southern coastline saw notable rise in sea level. The challenges are further characterized by the notion that substantial land loss originating from the exposures of low-lying coastal areas of the zone would unleash enormous damages at an unimaginable scale on the region. Indications of land use degradation linked to climate change occurred in the cities of Forcados and Warri in Delta state over the years. In these places, emission sinks and coastal erosion buffers, like mature forests and mangroves fell drastically while stressed vegetation rose from 1988 to 2008. Also, land cover of urban and industrial areas increased during a span of two decades.In terms of impacts, the 2012 flood along the lower Niger precipitated the submergence of vast areas in multiple states. Worsening the predicaments in terms of risk factors, are the high population growth rates of the coastal belt. Since the population figures rose at levels that put communities on harm’s way. The influx of people into these places accentuates the path to real danger. Aside from the use of descriptive in showcasing the temporal profile and changes in the climatic parameters in the zone, the GIS mapping of the trends indicates continual diffusion of risks from various climatic indicators. While efforts were made by various agencies to address the climate risks in the region, the paper proffered several solutions ranging from the need for effective policy and the installation of advanced early warning systems. The other recommendations include the adoption of growth management measures along the coast, the continued use of GIS and the design of a regional climate change index and information system to ensure the protection of communities at risk from the threats of extreme climate events.
5. Conclusions
This research assessed the climate change issues in 10 states along Nigeria’s Southern region with several notable findings listed as follows. a) the impacts of climate change parameters on the rise; b) mix scale approach quite effective; c) the vulnerabilities to climatic variability linked to many factors; d) various initiatives in place to contain the risks; e) coastal land loss and sea level rise evident.One key outcome of relevance from the research involves the identification of growing impacts of varying climate parameters on the ecology of the study area. Based on the frequency of extreme events, the Southern zone has encountered climate hazards characterized by pressures on the ecosystem and growing population concentration along at-risk coastal areas. Accordingly, the region is fraught with climatic hazards considering the persistent increase in dangerous weather events from Lagos in the South West to Port Harcourt in the Deep South East. In these areas, climate change parameters such as heavy rainfall, flooding, storm surge, and elevated temperature and greenhouse gas emissions threaten the natural and built environments. The extent of these risks as demonstrated by the number of human victims and casualties, frequency of disasters, economic and ecological damages grew substantially over time. Going by the most common hazards like increased temperature, greenhouse gas emissions, flooding and rainfall and submergence of towns. The surge in yearly extreme heat days prompted by temperature occurred with greater intensity. Based on the regional info, the effects of natural hazards reached dangerous levels during the 2012 flood along the lower Niger Basin with the submergence of dozens of towns in many states. Assessing these risks, provides the road map for mitigating future disasters through better planning and rehabilitation of victims. Detecting these interactions between geo climatic elements and the social environment seeing the inability to track their impacts, remains a key contribution to our understanding of human-nature interface. Highlighting these hazards to citizens given the causalities and damages, will make individual safety and minimization of costs the focus of recovery plans in the region in future.From the study results, the use of mix scale methods did stand out quite remarkably in helping chart the course of climate change research in Nigeria’s Southern region. Applying descriptive statistics and GIS mapping as operational tools under the model injected novel framework to undertaking regional and state level analysis stressing the growing impacts of climate change parameters on low lying ecozones. In view of the ecological and socio-economic importance of the region’s coastal belt, surely, the economic power of coastal cities from Lagos to Port Harcourt drives regional markets in various parts of the country and the study area. The recourse to the mix scale model in calibrating the regional climate index pinpointing the current and probable risk exposures in the zone over the different periods and the scales, reiterates efficacy of the system. This approach was quite valuable in delineating the study area and in classifying the trends and in the assemblage of information on climate parameters under different indices. Emphasizing the spreading of climatic hazards from various parameters in that form are essential in the design of novel strategies to protect fragile ecosystems. The practical applications of a mix scale approach involving mappings and the compilation of climate change index, as investigative tools, therefore enriches our understanding of the vulnerability of the region.The socio-economic and physical elements situated within the larger climate change parameters including coastal population growth, economic prosperity, and physical elements of elevation, temperature and precipitation and GHG emission are crucial in evaluating the elements behind the exposure. With the large cities in the coastal zone generating over 70% of Nigeria’s GDP and the region’s oil and gas hub accounting for 97% of the country’s total export. The capacity of the zone as strong economic center for supply of goods and services and the job prospects trigger the heavy migration of people that are often exposed to climate hazards. Aside from the physical characteristics of some of these areas as low-lying, the coastal towns of the region from Lagos, to Port Harcourt posted unparalleled population growth rates from 1991 to 2016. Accordingly, the Southern region not only saw increases in coastal populations from Akapbuyo to Warri South in the Niger Delta and parts of Lagos’ coastal towns, but spill overs from vibrant commercial operations drove the population surge in the zone. At that pace, some of these cities now risk submergence to the ocean from climate change pressures over time. The proximity to the paths of extreme events like rising temperature, heavy precipitations, coupled with threats of sea level rise from the Atlantic Ocean, raises the risk levels for communities in the region where tens of millions of MT of CH4 and CO2 come from gas flaring in the Delta. By showcasing this, the study not only reiterated the essence of socio-economic and geo-physical elements in the region’s climatic variability index, but it also showed how the ecosystem could be impacted by these factors. Stressing these links seeing the omission in the previous research, puts a key regional policy issue onto the forefront of coastal zone planning.Considering that the climate change hazards ravaging Nigeria’s Southern region transcend common ecozones and regional boundaries with national and global implications in terms of policy response. Several initiatives have been put into place at the federal and state, local and multilateral levels to mitigate the exposures to climate change induced threats in the study area. These encompasses budgetary allocations at federal and state levels to address climate change, policy instruments towards mitigation, climate change trust fund and the support for global treaties on climate. Seeing the dedication of the entities involved in the respective initiatives towards climate hazards mitigation and safety. The execution of those programs offers a framework for undertaking similar activities in places experiencing frequent exposures to extreme climate events. Cognizance of these developments as indicated in the paper augments the ability of managers in tracking the efficiency of various initiatives in climate change mitigation. The expectation is that it would enable regions and the nation and communities, design suitable measures for improving current approaches.One vital thing of great importance in this enquiry stems from the growing concerns over coastal land loss and sea level rise scenarios likely to inflict damages in low lying areas of the South. As a repository of diverse ecosystem including rainforest, swamps, mangroves, hydrocarbon off shore assets and other marine resources and innovative infrastructures driving the economies on the coast and adjoining areas. The coastal zone of the Niger Delta region with its 1900 km2 mangrove swamps and nearby areas has for several years been pummelled by extreme events of heavy storms and coastal flooding. This coincides with the low elevation traits therein where shoreline erosion, coastal land loss and rising sea level remain a growing threat. Under such scenarios, recent hydrological projections indicate that despite the anticipated submergence of much of Lagos, a sea-level rise of 1m and above can obliterate almost the entire Niger Delta known for its extensive wetlands. Stressing these dangers remains a major contribution crucial to policy, and recovery measures in the areas at risk. The policy takeaways are that without this level of analysis on stressors as shown in this study, policy makers would have no grip on how climatic predictors impede coastal ecosystems. In that way, the study injected an ecological protection approach vital in spotting the risks in fragile low-lying areas pushed beyond their capacities.Considering the growing threats from climate change parameters in the Southern region and the outcome of this enquiry. The decision makers in the region will be hard pressed to demand quick answers to several burning queries germane to climate change. The questions are as follows: How will climate change parameters affect hydrology? What scale will climatic stress assume? What will the spatial dispersion of climate parameters be like in the region? What will be the key socio-economic and physical elements driving climate change? From these queries, there are numerous opportunities for researchers and decision makers to refocus the approach on regional climate change mitigation with guidelines stressing sustained community safety and recovery. This will help the region and states optimize their respective obligations to climate change mitigation with efficient outcomes in the years ahead.
References
| [1] | Akpodiogaga, P. (2010). General Overview of Climate Change Impacts In Nigeria. Journal of Human Ecology. 29:1:47-55. |
| [2] | NEMA (Nigerian Emergency Management Agency) (2013). Report on Flood disasters in Nigeria. FCT Abuja, Nigeria: Government Press. |
| [3] | IPCC (Intergovernmental Panel On Climate Change). (2007). Reports- Special Reports The Regional Impacts of Climate Change, Nigeria. IPCC. |
| [4] | Federal Ministry of Environment (FME). (2010 September). National Environmental, Economic and Development Study (Needs) For Climate Change In Nigeria Special Climate Change Final Draft. FCT Abuja, Nigeria: FME Unit. |
| [5] | Idowu, A.A. (2011). Impact of Climate Change In Nigeria. Iranica Journal of Energy and The Environment. 2:2:145-152. |
| [6] | Strauss, B. (2017 May). Environment: 20 Countries Most At Risk From Sea Level Rise. New York, NY: The Weather Channel, IBM. |
| [7] | Ndebedum, E. (2016). Climate Change and Its Impact In Nigerian Economy. Journal of Scientific Research and Reports. 10.6:1-3. |
| [8] | Apata, T.G. (2014). Effects of Global Climate Change On Nigerian Agriculture: An Empirical Analysis. CBN Journal of Applied Statistics. 2:1:31-50. |
| [9] | Federal Ministry of Environment (FME). (2003 November). Nigerian First National Communication Under The United Nations Framework Convention On Climate Change. FCT Abuja, Nigeria: FME Unit. |
| [10] | Federal Ministry of Environment (FME). (2015 October). Nigeria’s Intended Nationally Determined Contribution. Abuja, FCT Nigeria: FME. |
| [11] | Ajadike, J.C. (2017). Nigeria’s Intended Nationally Determined Contributions (INDCs) as Strategic Vision for Climate Resilient, Low Carbon and Green Growth Development. International Journal of Science and Engineering Investigations. 6:69:2017. |
| [12] | Emem, O. (September 2016). Building an Effective Implementation Process to Nigeria's Climate Change Policies and Intended Nationally Determined Contribution (INDC). Germany: UNFCC. |
| [13] | Awosika, L.F. (1992 March). The Impact of Sea level Rise on the Coastline of Nigeria. Proceedings of IPCC Symposium. Margaritta: Venezuela. March 1992. |
| [14] | Nkeki, N.F. (2013). GeoTech Analysis of Flood Risk Along The Niger Benue Basin. Journal of GIS 5:2:9. |
| [15] | Nkwunonwo, U.C. (2015). Flooding and Flood Risk Reduction in Nigeria: Cardinal Gaps. Journal of Geography of Natural Disaster 5:136. |
| [16] | Musa, Z.N. (2014). The Niger Delta’s Vulnerability to River Floods Due To Sea Level Rise. Natural Hazards and Earth System Sciences. 14:3317-3329. |
| [17] | Agboola, A.M. (2016 December). Sea Level Rise and Its Potential Impacts On Coastal Urban Area: A Case of Eti-Osa, Nigeria. Seria Geografie. 262109: 715: 2:188-200. |
| [18] | Popoola, O. (2012). Sea Level Rise and Sustainability of The Nigerian Coastal Zone. Plymouth: UK. University of Plymouth Faculty of Science and Technology. |
| [19] | Sanye, A. (2011 June). Climate Change Adaptation and Conflict In Nigeria., Special Report. Washington, DC: 1-15. |
| [20] | Odunuga, S. (2014 March). Climate Change, Sea Level Rise and Coastal Inundation Along Part of Nigeria Barrier Lagoon Coast. Journal of Applied Science Environmental Management. 18:1:41-47. |
| [21] | Merem, E.C. (2018). Analyzing Emerging Environmental Issues in Major Areas: The Case of Lagos in South West Nigeria. Architecture Research. 8:1:1-19. |
| [22] | Merem, E.C. (2016). Analyzing the Impacts of Globalization on Major Areas: The Case of Lagos, South West Nigeria. Proceedings of Race, Gender & Class Conference. New Orleans: Louisiana, 2016. |
| [23] | IRIN. (2009 May). Coastal Populations At Risk as Climate Changes. Nairobi, Kenya. Retrieved October 5th 2017 From http://www.irinnews.org/feature/2009/05/20. |
| [24] | Fashae, O. (2011 December). Impact of Climate Change On Sea Level Rise In Lagos, Nigeria. International Journal of Remote Sensing. 32:24: 9811-9819. |
| [25] | Ogba, O. (2007). Vulnerability and Adaptations of Nigeria’s Niger Delta Coastal Settlements to Sea Level Rise. Proceedings of The Strategic Integration of Surveying Services FIG Working Week. Hong Kong SAR: China. May 2007. |
| [26] | Uyigue, E. (2007). Coping With Climate Change and Environmental Degradation In the Niger Delta Region of Nigeria. PH, Rivers State: Nigeria Community Research and Development Center (CREDC). |
| [27] | Olukoya, O. (2017). Gas Flaring, Climate Change and Nigeria Case. Cottbus-Seftenberg, Germany: Brandeberg Technical University. |
| [28] | Adeoye. N.O. (2009). Climate Change and Menace of Floods In Nigeria. Advances In Natural Applied Science. 3:369-377. |
| [29] | Oladipo, E. (2010). Towards Enhancing Adaptive Capacity of Nigeria. Lagos, Nigeria: Heinrich Boll Foundation. |
| [30] | Ayodele, I. (2017 May). Confronting Climate Change Doom In Lagos. The Guardian. 1-4. |
| [31] | Effe. S.I. (2015 March). Economic Impact of Climate Change In Port Harcourt, Nigeria. Journal of Social Sciences. 3:3:57-68. |
| [32] | Beyioku, J. (September 2016). Climate Change in Nigeria: A Brief Review of Causes, Effects and Solution. Ahuja FCT, Nigeria: Federal Ministry of Information and Culture. |
| [33] | Adelelkan, I. (2009). Vulnerability Of Poor Urban Coastal Communities To Climate Change In Lagos, Nigeria. Proceedings of Fifth Urban Research Symposium On Cities and Climate Change. Marseille, France: 2009. |
| [34] | Atake, C. (2013). Sea Level Rise In Coastal Areas In Nigeria. Retrieved October 5th 2017 From httpp//www.voice of youth .org/en/page-1. |
| [35] | Nicholls, R. (2008). Ranking of Port Cities with High Exposure and Vulnerabilities to Climate Extremes. OECD Environment Working Papers. 1: Southampton, UK: University of Southampton, OECD Publishers. |
| [36] | Merem, E.C. (2018). Regional Assessment of Climate Change Hazards in Southern Nigeria with GIS. Proceedings of 26th Annual AEHS Conference. San Diego: California. March 2018. |
| [37] | Komolafe. A. (2014). Air Pollution and Climate Change In Lagos, Nigeria: Needs For Proactive Approaches To Risk Management and Adaptation. American Journal of Environmental Sciences 10:4:412-423. |
| [38] | Adedeji, A. (2003). Environmental Degradation in Urban Areas. Lagos: LGS. 36-37. |
| [39] | Merem, E.C (2018). Analyzing Variations In Climate Change Parameters Along West Africa. Journal of Safety Engineering.8:1-22. |
| [40] | Merem, E.C. (2017). Assessing Ecosystem Liabilities of Oil and Gas Activities in Southern Nigeria. Public Health Research. 7:1: 3-26. |
| [41] | Merem, E.C. (2017). Techniques of Remote Sensing and GIS as Tools for Visualizing Impact of Climate Change-Induced Flood in the Southern African Region. American Journal of Climate Change. 6: 306-327. |
| [42] | Merem, E.C. (2016). Coupling GIS and remote sensing techniques for coastal zone disaster management: The case of southern Mississippi. Geoenvironmental Disasters. 3:25. |
| [43] | Merem, E.C. (2017 September). Assessing Variations in Climate Change Parameters In The Lower West African Region. Proceedings of the 14th International Symposium on the Recent Advances in Environmental Health. Jackson: Mississippi. September 2017. |
| [44] | Merem, E.C. (2006). GIS and Remote Sensing Applications In the Assessment of Change Within a Coastal Environment in the Niger Delta Region of Nigeria. International Journal of Environmental Health and Public Health. 3:1: 98-106. |
| [45] | Iyayi, F. (2004). An Integrated Approach to Development In the Niger Delta. Lagos: Nigeria The Centre for Democracy and Development (CDD). |
| [46] | Unah, L. (2017 May). Floods From Climate Change Are Ravaging Farms In Nigeria. IRIN. 1-8. |
| [47] | Akinro. A.O. (2008). Climate Change and Environmental Degradation in the Niger Delta Region of Nigeria: Its vulnerability, Impacts and Possible Mitigations. Research Journal of Applied Sciences. 3:3:167-173. |
| [48] | Ozor, N. (2010 June). Barriers to Climate Change Adaptation among Farming Households of Southern Nigeria. Journal of Agricultural Extension. 14: 1:114-124. |
| [49] | Awosika LF. (1995). Impacts of Global Climate Change and Sea Level Rise On Coastal Resources and Energy Development In Nigeria. Nigeria: DAMTECH Nigeria Limited. |
| [50] | Onofeghara, F.A. (1990). Nigerian Wetlands: An Overview. Lagos, Nigeria: UNESCO National Commission, Federal Ministry of Education. |
| [51] | Nigerian Environmental Study/Action Team (NEST). (2018. Why Should Nigeria Be Concerned About Climate Change? Ibadan, Oyo State, Nigeria: NEST. |
| [52] | World Bank. (2017). Climate Change Knowledge Portal. Country Profile Nigeria. Washington, D.C: The World Bank. |
| [53] | Okwuashi, O. (2008). The Challenges of Urbanization. Retrieved 5th October 2017 From http://www.devnet.org.nz/sites/default/files/Okwuashi.The%20Challenges%20of%20Urbanistion.pdf. |
| [54] | Merem, E.C. (2015). Ecosystem Liabilities of Oil and Gas activities in Southern Nigeria. Poster Presented at 12th International Symposium on the Recent Advances in Environmental Health. Jackson: Mississippi. September 2015. |
| [55] | Nigerian Conservation Foundation (NCF). (2008). Retrieved May 2018 From https://www.ncfnigeria.org/component/content/article/90-programmes/127-climate-change. |
| [56] | Igweze, A.H. (2014 February). Analysis of Rainfall Variations In The Niger Delta Region of Nigeria. Journal of Environmental Science, Toxicology and Food Technology. 8:1: VI: 25-30. |
| [57] | Ezedibe, T. (2011). Climate Change Awareness and Adaptation In The Niger Delta Region of Nigeria. African. Nairobi, Kenya: Technology Policy Studies Network. 1-24. |

 Abstract
 Reference
 Full-Text PDF
 Full-text HTML