-
Paper Information
- Previous Paper
- Paper Submission
-
Journal Information
- About This Journal
- Editorial Board
- Current Issue
- Archive
- Author Guidelines
- Contact Us
Journal of Safety Engineering
p-ISSN: 2325-0003 e-ISSN: 2325-0011
2018; 7(1): 32-36
doi:10.5923/j.safety.20180701.03

Status of Safety Climate in Chemical Industry-Karnataka
 Abstract
 Reference
 Full-Text PDF
 Full-text HTML
Narayanappa Thimmarayappa Vijalapura1, Swamy Devappa Renuka2, Manish Ramesh2
1Department of Factories, Boilers, Industrial Safety and Health Bangalore, India
2Industrial Engineering and Management, JSS Academy of Technical Education, Bangalore, India
Correspondence to: Swamy Devappa Renuka, Industrial Engineering and Management, JSS Academy of Technical Education, Bangalore, India.
| Email: |  |
Copyright © 2018 The Author(s). Published by Scientific & Academic Publishing.
This work is licensed under the Creative Commons Attribution International License (CC BY).
http://creativecommons.org/licenses/by/4.0/

The Bhopal gas tragedy in 1984 was the major turning point in India; this made organizations to adopt various safety policies and procedures. Organizations also found out that implementation of healthy working conditions create a positive impact on the society and also encourages employees to work efficiently. A questionnaire-based survey was considered as it is one of the most frequently used and widely accepted methods for measuring safety climate. A questionnaire was developed consisting of 20 safety climate components with 81 questions and was administered to four chemical industrial sectors in Karnataka, India. This was distributed among 370 employees, and only 340 responses were found to be valid. Exploratory Factor Analysis was carried out on the surveyed data to reduce the number of components. The Principal Axis Factor was used to extract the predominant components; three predominant components were identified and the Partial Least Squares regression was used to determine the relationship that these three components shared with safety climate.
Keywords: Safety climate, Chemical industries, India
Cite this paper: Narayanappa Thimmarayappa Vijalapura, Swamy Devappa Renuka, Manish Ramesh, Status of Safety Climate in Chemical Industry-Karnataka, Journal of Safety Engineering, Vol. 7 No. 1, 2018, pp. 32-36. doi: 10.5923/j.safety.20180701.03.
Article Outline
1. Introduction
- In many densely populated countries, safety in the chemical industry is an important issue. Bhopal gas tragedy (1984) in India and many other accidents in chemical industries across the world made organizations adopt various safety policies and procedures. But even since then many accidents are recorded in various chemical industries across India.A Study by Kennedy and Kirwan [1] suggested that measuring safety climate is a better option to quantify the safety of an organization as it surpasses many of the obstacles of traditional safety measures. Safety climate can be defined as the molar perception of employees towards their organization on safety. A significant relationship between a positive safety climate and fewer accidents has been demonstrated in hazardous industries, such as chemical and nuclear processing ([2], [3]). The factors that affect safety climate across various industries differ because of differences in geography, demography, and style of management.Vinod Kumar and Bhasi [4] conducted an in-depth study on safety climate in accidents from hazardous chemical industries in Kerala, India. The study identified eight safety climate factors and provided benchmark scores for each factor. Further, these scores were used to evaluate the safety of an organization.India is a diverse country where people differ significantly in culture, literacy rate, attitude and work style. Safety still remains a concern in many industries across the country. So far only one research has been carried out in the chemical industry sector of India. So it is necessary to conduct a study in chemical industries in Karnataka to determine the relation of various safety components and safety climate.
2. Literature Review
- Ian Donald and David Canter [5] conducted a survey in ten chemical sites in UK with question set consisting of ten scales. The aim was to establish the reliability of a safety attitude assessment scales and safety climate in the chemical industry. The results indicated that there is a strong and clear association between safety attitude and accident performance of a company.Vinod Kumar and Bhasi [4] conducted a thorough survey using a questionnaire which was conducted for accidents among 2536 employees in eight major hazardous chemical sectors in Kerala. The safety climate scores were significantly negatively correlated with self-reported accident rates. The study identified eight safety climate factors and provided benchmark scores for each factor, which can then be used to evaluate the status of safety in an organization at a given point of time.This literature review illustrates the extent to which safety climate has been studied in the chemical sector. Only a few studies exist in the chemical sector pertaining to safety climate; so far only one research has been carried out in India. So this is the reason for conducting the study for the in chemical sector of Karnataka.
3. Methodology
3.1. Questionnaire Design
- A questionnaire- based survey was considered as it is one of the frequently used and widely accepted methods for measuring safety climate in an organization.After conducting a literature review, the frequency of the components used in the previous studies were identified and a draft questionnaire was designed containing 20 safety climate components consisting of 81 questions averaging about 4 questions for each safety climate component. A pilot study was conducted in order to obtain the feedback about the reliability of items. The questions were distributed in English and the local language of Kannada.
3.2. Estimation of Sample Size
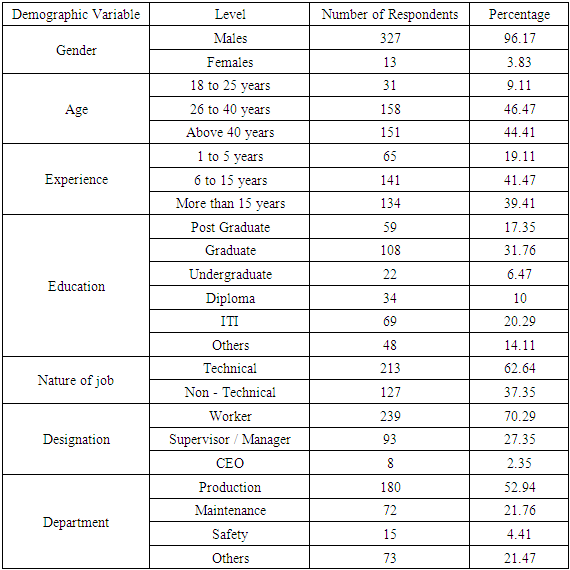
- A convenient sampling approach was adopted for this study. A total of 370 questionnaires were distributed to 4 chemical industries in the State of Karnataka; however, only 340 responses were found to be valid.
|
3.3. Data Analysis
- The collected data was subjected to statistical analyses using R v3.4.3. In order to reduce the dimensionality of the safety climate components, the Exploratory Factor Analysis was used. The Principal Axis Factor was used to extract the predominant components and the Chi-Square test was conducted to determine the associations between safety climate and the demographic variables. The Partial Least Squares (PLS) regression was used to determine the relationship that the safety components shared with safety climate.
4. Results
4.1. Components
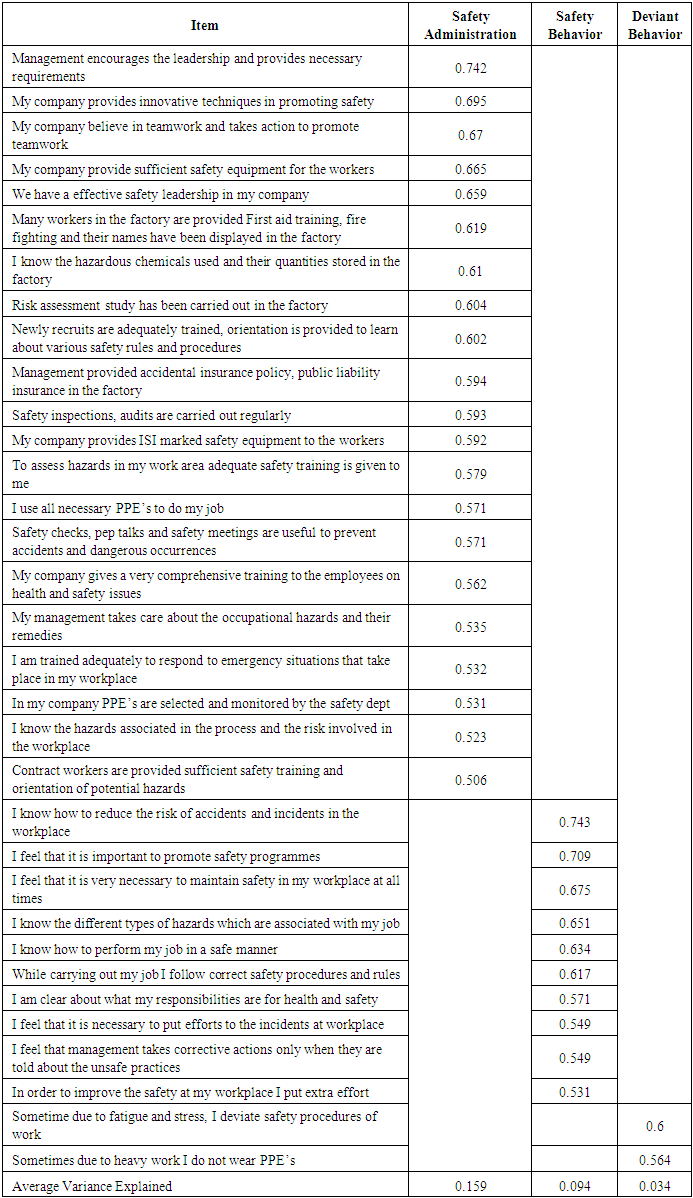
- The Parallel Analysis was used to determine the number of components that best explained the variation in the data. The Parallel Analysis compares the variation explained by the number of factors with randomly- generated data and checks if the differences in the variances observed are statistically significant. Such a procedure combines the power of statistical hypothesis testing and the domain knowledge that comes with experience to determine the factors. A Parallel Analysis of the collected data showed that a combination of three factors best explained the variation in the data. The details of these three factors are provided in Tables 3 and 4.Only items with standardized loadings greater than or equal to absolute 0.5 were considered. The names of the components were finalized based on the items present in the components.
5. Safety Climate Measurement Model
5.1. Model Validity
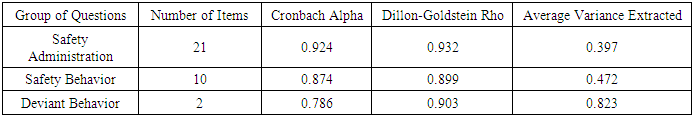
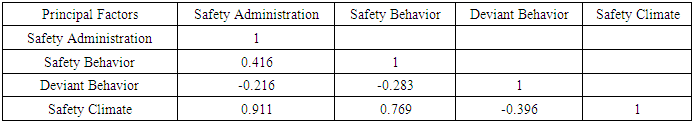
- Three measurement properties need to be examined to ensure satisfactory validity and reliability of the model ([6], [7]).First there is the individual item reliability indicated by the correlations or loadings, with 0.7 as cutoff value. Second there is the convergent validity, evaluated by Cronbach’s Alpha. The cut-off value generally accepted as the threshold is 0.7 [8]. The results obtained in Table 3 show that the obtained Cronbach’s alpha well exceeds either the cutoff, which indicates good convergent validity. The third measurement property is discriminant validity, indicated by the average variance explained. This measure for the current model is indicated in Table 3. This should be greater than the squared intercorrelations between the elements, which are indicated in Table 4.Thus it can be concluded that the Safety Administration, Safety Behavior and Deviant Behavior measure the final safety path model shown in Fig 2 with a good precision.
|
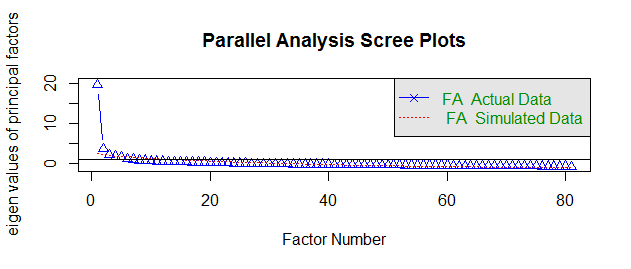 | Figure 1. Parallel Analysis plot of factors. Notes. FA = Factor Analysis |
|
|
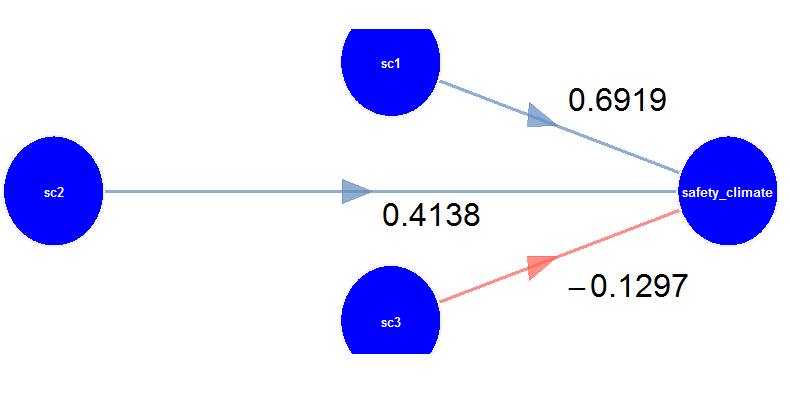 | Figure 2. Parallel Analysis plot (Description: SC1= Safety Administration, SC2= Safety Behavior, SC3= Deviant Behavior) |
5.2. Model Assessment
- The descriptive or predictive power of any PLS model can be determined by examining the R2 value of the dependent constructs. R2 indicates the amount of variance in the endogenous latent variable explained by its independent latent variables [9]. The R2 value of 0.99, obtained for this particular model, implies that around 99% of the variation in safety climate is explained by the components.Path models indicate the effect of a variable on the safety climate. The greater the magnitude of the path coefficient, the stronger the effect on the safety climate. Fig 2 shows that the safety component 1 has a stronger effect on the safety climate, whereas the safety component 2 has a moderate effect on the safety climate. The safety component 3 has a weak and negative relationship with the safety climate.
6. Discussion
- This paper explored the subject of safety climate in the chemical industry of India. The questionnaire was distributed to 370 respondents out of which 340 responses were usable. Then the collected data was subjected to factor analysis to determine the significant components. These components were then used to study the relationship with safety climate. The statistical analysis yielded three components of safety climate:Ÿ Safety Administration (SC1)Ÿ Safety Behavior (SC2)Ÿ Deviant Behaviors (SC3)
6.1. Safety Administration
- The Safety Administration can be defined as all activities of planning, implementation and execution for safety that include the formation of safety rules and procedures, risk assessment and justification, emergency preparedness, safety training and development, deciding on PPE, budgeting for safety, inculcation of teamwork for safety and promoting the spirit of innovation towards safety.So far many studies have been carried out on the safety climate in various sectors but none of these studies has considered or identified Safety Administration as an important component of safety climate. But from the above study conducted, it can be noted that Safety Administration had a positive correlation with safety climate; the strength of this component was also higher compared to the other components.
6.2. Safety Behavior
- Cooper and Phillips [10] stated that the safety climate of a facility varied over time with the completion of remedial actions of improvements in the safety behavior.
6.3. Deviant Behavior
- Vinodkumar and Bhasi [4], Donald and Canter [5] have conducted studies for chemical industries, out of which no study has identified Deviant Behavior as one of the components which affects safety climate. Researchers have carried out studies in safety climate across various sectors but none of the studies have identified the relation between Deviant Behavior and safety climate as a significant one.From the above study, it can be concluded that Deviant Behavior has a negative correlation with safety climate.
7. Conclusions
- The Safety climate for the chemical industry of Karnataka is associated with Safety Administration, Safety Behavior and Deviant Behaviors. Safety Administration and Safety Behavior showed a positive relationship with the safety climate whereas the Deviant Behavior had a negative impact on safety climate. The objective of the paper is to explicate safety climate in the chemical industry scenario by building a model that quantifies the relationship which safety climate has with its components.
ACKNOWLEDGEMENTS
- This paper was completed with the constant support and guidance provided by Rashmi, Pranesh and Anusha, Department of Industrial Engineering & Management, JSS Academy of Technical Education. The data which was used in the study was provided by T.V. Narayanappa, Deputy Director of Factories, Department of Factories, Boilers, Industrial Safety and Health, Government of Karnataka, India.