-
Paper Information
- Next Paper
- Paper Submission
-
Journal Information
- About This Journal
- Editorial Board
- Current Issue
- Archive
- Author Guidelines
- Contact Us
Journal of Safety Engineering
p-ISSN: 2325-0003 e-ISSN: 2325-0011
2018; 7(1): 23-31
doi:10.5923/j.safety.20180701.02

Trends of Weather Elements Induced Flights Cancellation in Nnamdi Azikiwe International Airport, Abuja, Nigeria
 Abstract
 Reference
 Full-Text PDF
 Full-text HTML
R. Dan-Okoro1, S. M. Hassan1, V. A. Agidi2
1Department of Geography and Environmental Studies University of Abuja, Abuja Nigeria
2Nasarawa Geographic Information Service Headquarters Lafia, Nasarawa State, Nigeria
Correspondence to: V. A. Agidi, Nasarawa Geographic Information Service Headquarters Lafia, Nasarawa State, Nigeria.
| Email: |  |
Copyright © 2018 The Author(s). Published by Scientific & Academic Publishing.
This work is licensed under the Creative Commons Attribution International License (CC BY).
http://creativecommons.org/licenses/by/4.0/

The Study assess the trends of weather conditions in aviation transport in Nnamdi Azikiwe International Airport, Abuja. Records on visibility, rainfall, cloud cover; wind speed and two aspects of flight operations (flight delay and cancellation) for a period of 14 years (2000-2014) were collected from secondary source. Simple regression analysis or trend analysis was used to determine the trend of the weather parameters as influencing flight operations. Findings in this study show that. Trends reveal that flight cancellation and delay have reduced drastically at Nnamdi Azikiwe International Airport, Abuja as a result of installation of advanced navigational aids to take care of unforeseen weather obstructions. Individual weather elements (visibility, rainfall, cloud cover and wind speed) on their own do not have significant effects on flight operations between 2000 and 2014, however when they are combined, these weather elements affect aviation transportation tremendously. Hence there is need for the installation of reliable and well equipped weather station with precise prediction of weather elements not only in airports, but also in strategic locations across the country to enable the spatial analysis of weather records across air routes.
Keywords: Flight operation, Weather elements and trend analysis
Cite this paper: R. Dan-Okoro, S. M. Hassan, V. A. Agidi, Trends of Weather Elements Induced Flights Cancellation in Nnamdi Azikiwe International Airport, Abuja, Nigeria, Journal of Safety Engineering, Vol. 7 No. 1, 2018, pp. 23-31. doi: 10.5923/j.safety.20180701.02.
1. Introduction
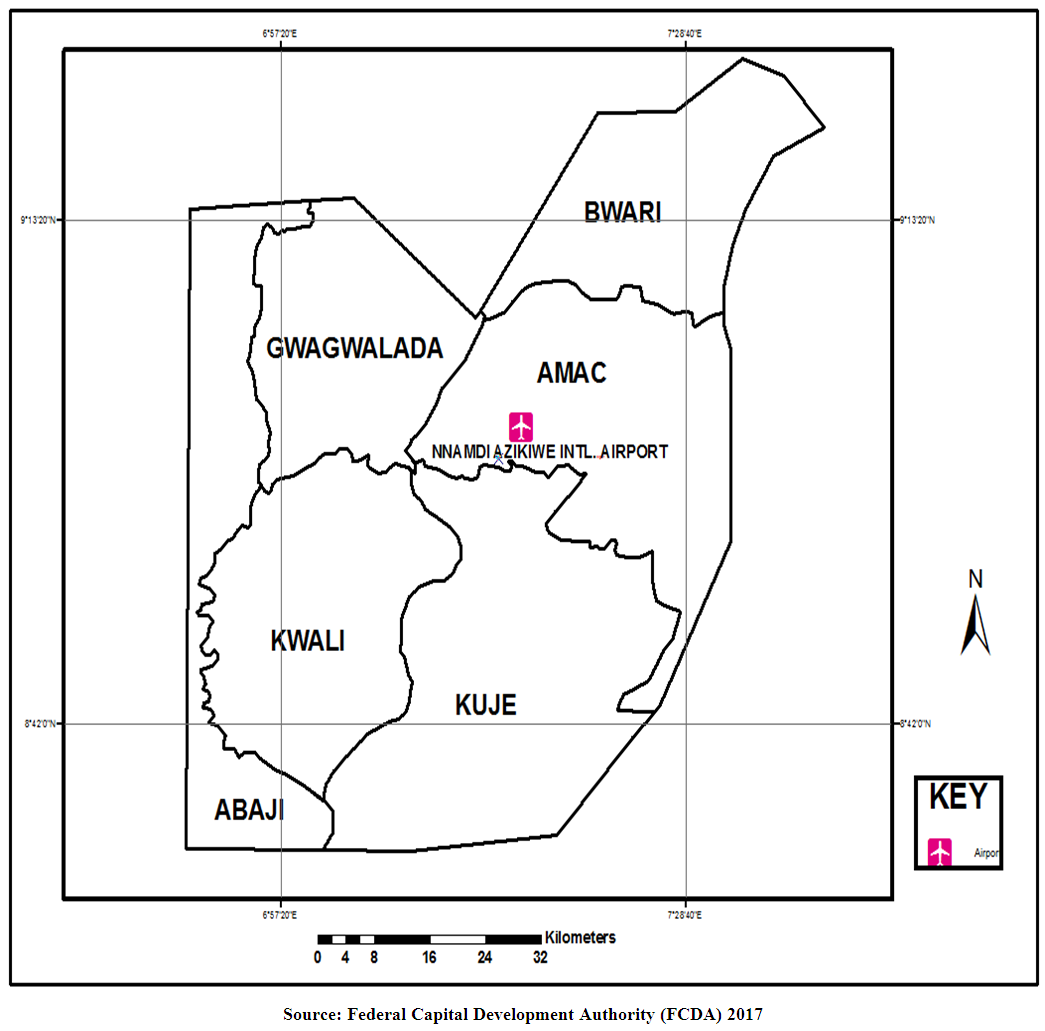
- The effect of weather variation brought about by global warming is a lot of concern to the aviation industry. Abass et. al., (2012)) stated that several airlines have been rendered moribund, while some offer partial services as a result of extreme weather events. Weather is the state of the atmosphere at a given place and time with respect to variables such as temperature (heat or cold), moisture (wetness or dryness), wind velocity (calm or storm), visibility (clearness or cloudiness) and barometric pressure (high or low). Stringer (1989) is of the opinion that weather conditions can evolve at a rapid rate, over a wide spatial extent when compared with other factors that may affect the safe conduct of flight. This is apart from aircraft maintenance, runway status, airspace sector access and support services. Thus, the spectrum of weather information is an important component for the safe conduct of a flight and the efficient management of air traffic in future (Mirza et. al., (2009). Weather continues to play a significant role in number of aviation accidents and incidents. While National Transportation Safety Board (NTSB) reports most commonly find human error to be the direct accidents caused, weather is a primary contributing factor in 23 percent of all aviation accidents (Kulesa, 2002). Extreme weather events present major challenges for transportation and are becoming more frequent and intense. Ayoade (2004) revealed that Poor visibility is the single most important weather hazard to all forms of transportation especially air transportation. Poor visibility can be caused by thick fog, snow, rain, thunderstorm, harmattan dust, mist, volcanic ash or smoke, urban smoke, low ceilings and even smog. The Sosoliso plane crash in 2006 was partly caused by poor visibility because of thunderstorm and rain when trying to land in Port Harcourt airport. Investigation on aviation accidents shows that 80% of aviation accidents take place before, after or during landing or take off and is described as resulting from human error. For example the ADC air crash in 2006 was reported to occur between landing and takeoff due to wind shear. (Culled in (Accident Investigative Bureau (AIB) 2014).Weather is the single largest contributor to delays in the efficiency of flight operation. It is becoming the dominant cause of delay in Nigeria. Flights can incur delays while airborne or on the ground, for example, a late arrival of one flight may cause a late departure of the next flight on the itinerary of the aircraft (Schaefer and Millner, 2001). Moreover, visibility and a minimum cloud ceiling, as well as certain crosswind maxima are required for a safe landing or take-off. In rainy seasons, airports in Nigeria experiences frequent bouts of severe convective weather that blocks en-route or terminal airspace and results in very high delays. Critical weather phenomenon reduces the operational capacity of regions entire airspace through delays, diversion and flight cancellations. However, this concern for safety comes at a cost and it leads without doubt to traffic delays, diversions, and cancellations (Rodenhuis, 2004). As a consequence, Nnamdi Azikiwe International Airport Abuja has to be investigated separately with regard to its susceptibility to adverse weather.Therefore, assessment of the impact of weather in the current environment as well as in future changing climate conditions is essential in order to enable the sector to adjust to it adequately.Study AreaNnamdi Azikiwe International Airport is located in the Federal Capital Territory (FCT), Abuja. It is about 45km south of the city. The airport has both international area which serve domestic and international flights, and the private area that is used for charter flights. The elevation of the airport is 1,123ft / 342m above mean sea level. It has two runway directions namely 04/22, and the runway length is 3600m/11,842 ft (Nigerian Aeronautical Information Publication [NAIP], 2013). Abuja International Airport provides flight services both to domestic and International destinations. It is a public airport operated by the Federal Airports Authority of Nigeria.
 | Figure 1 |
2. Methodology
- Research DesignThe study adopted the retrospective survey design which will involve the use of historical/archival data of weather parameters and records of flight operations from Nnamdi Azikiwe International Airport, Abuja. Weather and flight cancellation data for 15 years will be collected from Nigeria Meteorological Agency (NIMET) and Nigerian Air Space Management Agency (NAMA) at the Abuja International Airport respectively. The weather parameters collected from Nigerian Metrological Agency (NIMET) includes:i. Rainfall data from 2000 -2014 (15 years) for Nnamdi Azikiwe International Airportii. Records of low horizontal visibility from 2000-2014 (15 years) for Nnamdi Azikiwe International Airport.iii. Records of wind speed (WNSPD) on runway 04/22 for Nnamdi Azikiwe International Airport.iv. Records of cloud cover from 2000-2014 (15 years) for Nnamdi Azikiwe International Airport.While The Airport Operational Data which include flight delays, cancellations and diversions will be collected from for the same period. Trend Analysis of Records Trend analysis will be used to ascertain the trend of weather parameters (rainfall, visibility, wind speed and cloud cover) and Airport Operational Data (flight delays, cancellations and diversions). The model for trend analysis is given by:
 Wherey = Flight cancellation/flight delayx = Weather Parameter(s)m = rate of flight cancellation/flight delayb = constant equal to the value of y when x = 0
3. Results
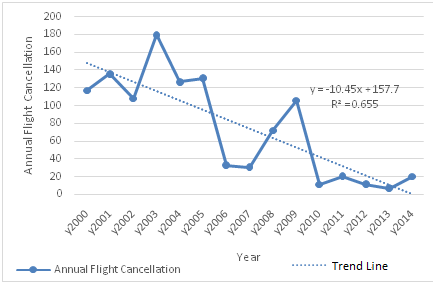
- Annual Trend of Flight Cancellation in the Study Area Figure 2 shows the annual trend and variation of flight cancellation records between the periods of study (2000-2014) in the study area.
 | Figure 2. Annual Trend of Flight Cancellation |
 | Figure 3. Monthly Trend of Flight Cancellation |
 | Figure 4. Annual Trend of Flight Delay |
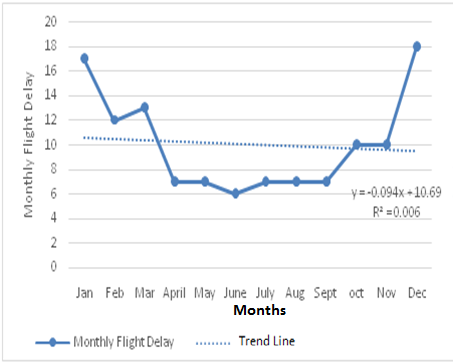 | Figure 5. Monthly Trend of Flight Delay |
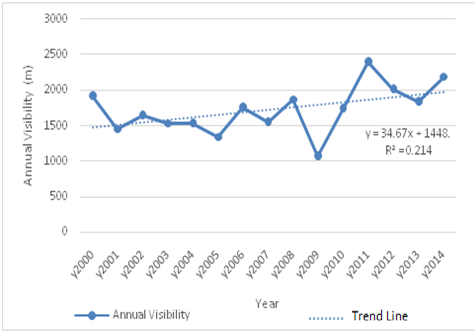 | Figure 6a. Annual Visibility Trend |
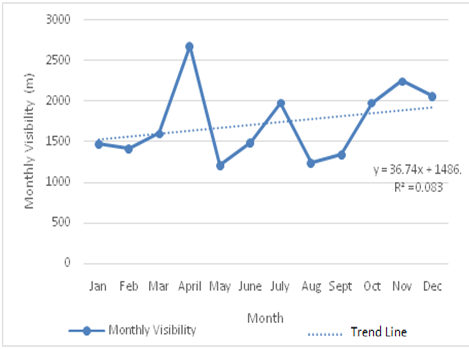 | Figure 6b. Monthly Visibility Trend |
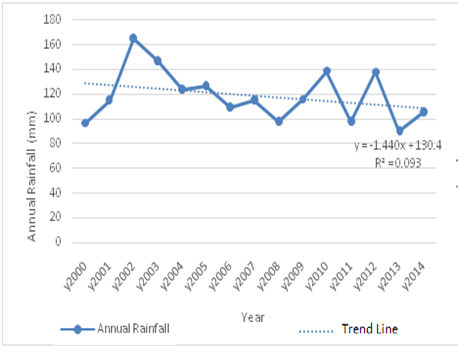 | Figure 7a. Annual Trend of Rainfall |
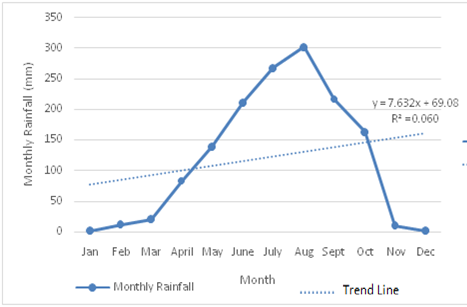 | Figure 7b. Monthly Trend of Rainfall |
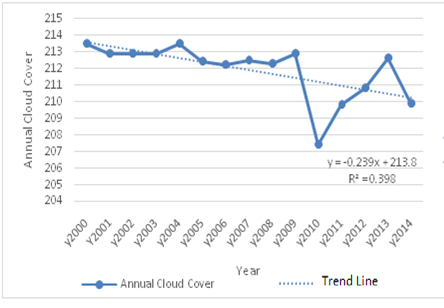 | Figure 8a. Annual Cloud Cover Trend |
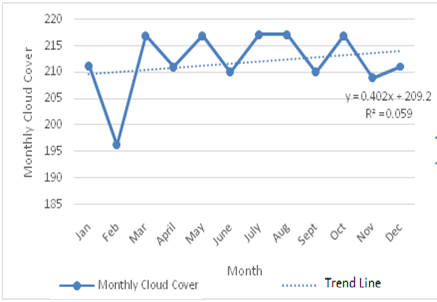 | Figure 8b. Monthly Trend of Cloud Cover |
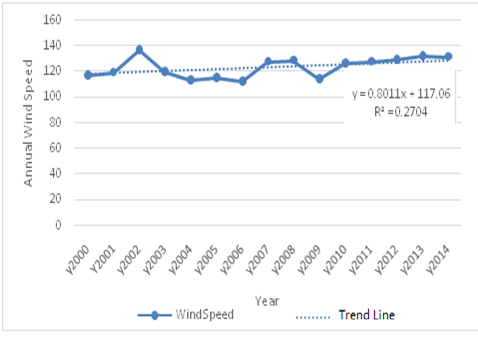 | Figure 9a. Annual Trend of Wind Speed |
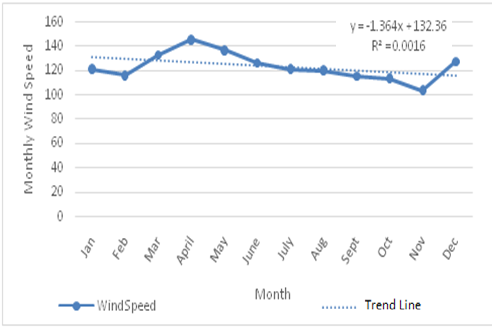 | Figure 9b. Monthly Trend of Wind Speed |
4. Conclusions
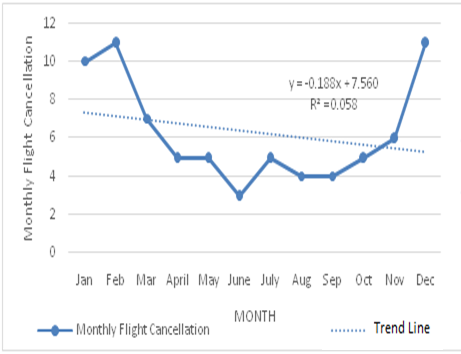
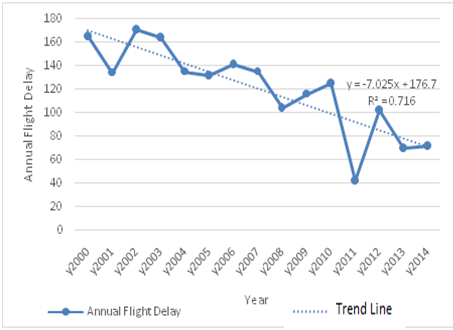
- Trends in this study shows that the annual flight cancellation and delay have reduced drastically as a result of the installation advanced navigational aids to take care of unforeseen weather obstruction. In monthly flight cancellation and flight delay, the extent in which these weather elements influences flight operations vary with seasons. In summer periods there was high increase in flight delay and cancellation as a result of poor visibility. The trend line for monthly delay shows a downward trend of flight delay with a negative trend line of Y= -0.094x + 10.69. the seasonal peak of flight cancellation in the annual trend was in 2003 with a total of 108 cancelled flights, while that of the monthly trend was in the month of December with a total of 11 terminated flights. The seasonal peak for delayed flights was in 2002 with 171 flights, while Decembers has the highest peak period in delays with a record of 18 flights.The annual trend of visibility shows a high rate of fluctuation, which is in favour of air transportation.The result of rainfall trend, shows a negative trend line equation of Y= 1.440x + 130.4 which could be as a result of the location of the study area where rainfall is not usually heavy for a long time of the day. In contrast, the monthly trend shows a positive trend line equation of Y= 7.64320x + 69.08.Cloud cover had the highest impact on flight operations in the study. There was an increase in the annual trend of cloud cover and the monthly trend shows high impact of cloud cover on flight operations in March, May, July, August and October. The trend line shows a slight positive rise in trend equation with equation Y= 0.402x + 209.2.Despite the fact that monthly wind speed did not affect flight operation, the trend shows a gradual rise from 2010 to 2014 and this has the potential for affecting fight operations in the study area.
5. Recommendations
- Reliable and well equipped weather station with precise prediction of weather elements should be established not only in airports, but also in strategic location across the country to enable the spatial analysis of weather records across air routes.More accurate ways of weather information should be emphasized through the training and retraining of aviation personnel.