E. C. Merem1, Y. Twumasi2, J. Wesley1, P. Isokpehi1, S. Fageir1, M. Crisler1, C. Romorno1, A. Hines3, G. S. Ochai4, S. Leggett4, Emmanuel Nwagboso5
1Department of Urban and Regional Planning, Jackson State University, Jackson, MS, USA
2Department of Urban Forestry and Natural Resources, Southern University, Baton Rouge, LA, USA
3Department of Public Policy and Administration, Jackson State University, Jackson, MS, USA
4Department of Health Policy and Administration, Jackson State University, Jackson, MS, USA
5Department of Political Science, Jackson State University, Jackson, MS, USA
Correspondence to: E. C. Merem, Department of Urban and Regional Planning, Jackson State University, Jackson, MS, USA.
| Email: |  |
Copyright © 2018 Scientific & Academic Publishing. All Rights Reserved.
This work is licensed under the Creative Commons Attribution International License (CC BY).
http://creativecommons.org/licenses/by/4.0/

Abstract
Narrow minded skeptics in the twenty first century deny the existence of climate change and the resultant risks threatening the welfare of cities through the destruction of properties, displacement and environmental degradation. The global climate change concern is now more important than ever in the sub Saharan African region of West Africa where the vulnerabilities remain obvious. Accordingly, in the last several years, the lower West African region continues to be an epicenter of inclement weather hazards. For that, there exists mounting evidence of risks based on recurrent challenges triggered by surge in extreme climate parameters in the savannahs, the tropical moist areas and the coastal landscapes in Nigeria, Benin, Togo, Ghana, Ivory Coast and Senegal. In these areas of the West Africa region, climate change parameters such as droughts, flooding, storm surge, and elevated temperature and greenhouse gas emissions continue to threaten the surrounding ecology. Just as climate hazards have captured the attention of various scholars in other areas, very little has been done to study the area despite its vulnerability to sea level rise, torrential rainfalls, coastal inundation and storm surge. In all these, the projected climate change trends point to continual dispersion of elevated temperature and evidence of harsh weather conditions all through the region. With the gravity of the hazards now obvious, this research fills that void in the literature, by analyzing climate change parameters threatening the study area with the use of mix scale methods of GIS, secondary data, and descriptive statistics with focus on the trends, factors, impacts and efforts of the institutions. Taking a cue from the analysis, the results show the prevalence of climate change risks and impacts in the form of flooding hazards, droughts, greenhouse gas emission, sea level rise, pollution, environmental degradation and displacement of citizens. With the impacts attributed to socio-economic and physical elements, the GIS mapping reveals a gradual spreading of climate change hazards under different scales to various areas across the region from Nigeria to Senegal. To remedy the issue, the paper proffers some suggestions such as the need for adaptation, the design of efficient planning and policy in the region.
Keywords:
Climate Change, GIS, West Africa, Appraisal, Hazards, Factors, Impacts, Low-lying, Sea Level, Risks
Cite this paper: E. C. Merem, Y. Twumasi, J. Wesley, P. Isokpehi, S. Fageir, M. Crisler, C. Romorno, A. Hines, G. S. Ochai, S. Leggett, Emmanuel Nwagboso, Appraising Variations in Climate Change Parameters Along the Lower West African Region, Journal of Safety Engineering, Vol. 7 No. 1, 2018, pp. 1-22. doi: 10.5923/j.safety.20180701.01.
1. Introduction
Judging from the known vulnerabilities in the area, the coastal belt countries in West Africa contain lowland creek shorelines that are at risk of erosion and therefore susceptible to rising sea level and climatic variability from extreme events [1-11]. Accordingly, the Lower West Africa region has for decades been at the receiving end of countless inclement weather events with mounting threats to a fragile ecosystem and rapidly growing major population centers spread across the countries [12, 13]. The scale of the hazards from disasters as manifested by the number of human fatalities and the economic and ecological costs has risen enormously from one era to another [13-18]. Given the extent of these disasters and the strain exerted on the ecosystem, the region continues to experience climate change induced hazards [19]. The nature of such climatic variability over time in the region has not only defied common logic, but also these days no time passes without accounts of torrential rains, violent storm surge, flooding and coastal inundation exceeding their previous levels to the detriment of communities [20]. In this process, managers must work towards mitigation, adaptation and protection while preparing for future occurrence in the face of uncertainties. With the tragic history of inclement weather events in the study area and perilous experience that came with it, public anxiety over the dangers posed by the climate change parameters is now far more significant than ever in the region where the vulnerabilities remain threatening. There are many reasons for such a sudden shift. In the context of the study area, substantial parts of the region’s populace and commercial structure are concentrated within the coasts.Just as previous studies have identified the susceptibility of many African coastal nations to climate change and rising sea level with bigger levels of coastline destruction and the inundation of low-lying coastal zones, the threats posed to heavily populated areas in that way, exposes large number of residents to impending danger [21]. Added to that, the effects of rising sea level, which in areas with estuaries could be increased by subsidence, might magnify current difficulties due to rising coastline erosion, recurrent flooding, marshland declines, and saltwater seepage into aquifer and groundwater, with lasting effects on the ecology of West African populations and markets. For that, the growing incidence of coastal population stress and unsustainable use of seafront assets continue to fuel the degradation of coastal ecosystems [22]. In the coastal belt where ecological challenges from coastal inundation to saltwater seepage threatens communities, the erosion of coastlines are now so alarming that it spreads at a rate of 23-30m each year in several areas. Accordingly, Nigeria not only loses almost 50m of its shorelines to the Atlantic Ocean yearly, but much of the land in Lagos is threatened by sea level rise [23, 24], while among the countries, Ivory Coast, saw significant levels of erosion along the Abidjan harbor. Elsewhere, coastal erosion has now risen to higher scales in Lome, Togo that, the first capital city, Aneho and the roads to Benin, are projected to varnish in 2038 if no remedies are place to contain the yearly erosion rate of 6-10m [25]. In neighboring Benin, since 1963-2000, the coastlines of Cotonu have also retreated by 400m [26].With the influence of rising sea level stemming from climate change events now evident through the devastation of aquatic environments predominantly in the mangrove forests. Along the Niger Delta area of Nigeria and the West African coastlines from Senegal to Nigeria, the large mangrove bionetworks that perform critical ecosystem functions including coastline protection for the soils and fisheries stocks are now vanishing [27-29]. From a regional declining rate -4.8% from 1975 to 2013 at a total loss of 984 km2, it has been shown that 40% of the mangroves in Nigeria vanished in 1980; Senegal lost nearly 60% due to clearance. For that, the erosion of the coastline, and surges in the salt-water intrusion into the soil has increased [30]. Furthermore, from 1961 to 2000, the number of cold days and nights declined in West Africa, while the number of warm days and nights increased [31]. Given that the mean annual temperatures are expected to rise by 3°C to 6°C towards the end of the 2000s [32], the frequency of droughts in the last decades threatens community livings and food security. With the increased CO2 emissions, climatic variability will negatively disturb many physical, ecological/biological, and socioeconomic attributes of the Lower West African coastal ecozone and nearby oceans that are now under enormous strain and pushed beyond their capacity [12, 33-38]. In the last several years, the study area continues to be the epicenter of extreme climate threats with major implications in the management of low-lying areas in West Africa.Considering that the effects of climate hazards have captured the attention of various scholars in other places, there is little done on the study area despite its vulnerability under a mix scale model. With the exception of related works by Merem over the years with emphasis on climate change, coastal areas, renewable energy, impacts with references to fossil fuel emission and ecosystem liabilities using GIS and descriptive statistics, the literature remains sketchy on the six nations [30, 39-46]. Nevertheless, the thrust of these studies still resonates with the challenges of the study area and threats that are posed by climate change parameters to the Lower West African region. For that, there is a need for a comprehensive assessment of climate change effects in the region using mix scale tools of GIS connected to descriptive statistics and secondary data. With the gravity of the hazards now obvious, this research will fill that void in the literature, by analyzing climate change parameters threatening the study area with use of mix scale methods of GIS, secondary data, and descriptive statistics with focus on the trends, factors, impacts and the efforts of institutions. The paper has five objectives. The first aim focuses on the use of GIS technology to assess the impacts of climate change, while the second objective is to design a decision support device for policy makers. The third aim stresses the design of an index for regional climate parameters. The fourth objective is to devise a framework for coastal zone management. The fifth objective is to assess variations in climatic parameters. The paper has five parts. The first section presents the introduction while part two covers materials and methods. Part three highlights the results. The fourth segment contains the discussion, and part five offers the conclusions and the findings of the study.
2. Materials and Methods
In this enquiry, the study area of Lower West African region refers to coastal nations of the region (Senegal, Nigeria, Ivory Coast, Ghana, Togo, and Benin Republic Figure 1). It does not include the nations of the Sahel from Mauritania to Chad. Overall, the Lower West African coastal zone covers low-lying coastal belt composed of a variety of ecosystems, including barrier islands/lagoons, deltas, mountains, wetlands, and mangroves [1]. 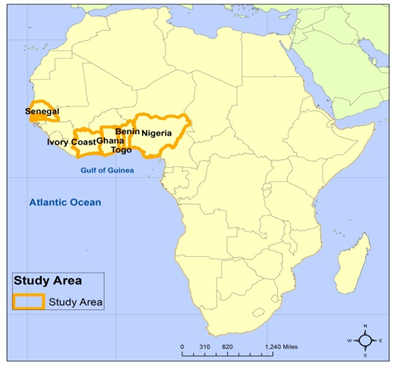 | Figure 1. The Study Area, Lower West African Region |
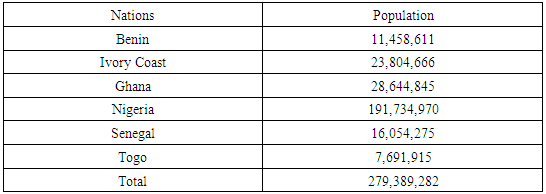
These landscapes, which vary in width from a few hundred meters to more than 100 km along the coastal zone, span a broad range of habitats and biota and include pristine islands. The grouping reflects shared natural attributes germane to the nations. Consistent with these nations is the presence of the savannah and forest areas as well as common experience in climate change impacts. The study area’s 2017 population of 279,389,282 (Table 1), stretches through a land mass of 1,850,645 km2 across six countries on a total coastline of 2,615 km [30]. Table 1. The Population Distribution in the Study Area, 2017
 |
| |
|
In a region where the coastal belt accounts for 56% of GDP and 33 % of inhabitants at annual growth rate of 4%, the vast proportion of city inhabitants reside in coastal cities [6, 7]. Among the nations, Nigeria’s coastal belt has 20 million people representing 22.6% of the nation’s population resident in the zone. With almost 90% of the economic activities in Senegal located within the Dakar coastal zone, about 4.5 million people or 6.6% of the populace dwell in the Dakar coastline area [28]. In the neighboring nations of Ghana, Benin, Togo, and Nigeria, much of the commercial activities driving the general markets occur on the coastal belt [8, 9]. Furthermore, being 300 m above sea level on average and a handful of mountains and highlands, the study area is bounded onto the west and south by the Atlantic Ocean and by the North of the Sahel climatic zones in the area. Because of such variances, West Africa has three climate zones. Of these, the tropical humid Guinea coast adjacent to the Gulf of Guinea is categorized by the yearly average rain of over 1,500 mm. The precipitation amounts along the zone fluctuate in relation to location of the shoreline and inland elevations at right angles to the southwest monsoon. Based on these characteristics, the West African coast has a high propensity to torrential rain accompanied by dry spells in the arid zones of the countries [31]. Because the climate of the region is fraught with a delicate monsoon pattern linked with striking regular rainfall, the area remains at the epicenter of ample global and regional-scale changes encompassing greenhouse-gas-induced warming and sea-level rise, and others. For that, the impacts of climate change emanating through shifting forms of rainfall to rising sea levels will intensify the scale of coastal erosion now ravaging West Africa. Besides, all through 1961-2000, the number of cold periods diminished in the West African region as hotter days and nights showed notable increases as well [5, 31, 47]. Because of these uncertainties, average annual temperatures in West Africa will rise by 3 C to 6°C at the end of the 21st century while the mean volume of rainstorms for the region will increase in the rainy season with minor interruption at beginning of the monsoon period [32]. With that, it is not surprising that flooding threatens 500,000 persons annually in West Africa [22, 48, 49]. During the month of June in 2009, an unusually dense periodic flood battered the region. In the month of September of that same year, 16 nations experienced extensive inundations that left 600,000 homeless without food and shelter because of persistent rainfall [50]. Furthermore, from 2005-2015, the West Africa region also saw 17-drought incidents, which threatened 32 million citizens while 132 cases of flooding in the same years affected 14 million individuals with 2000 causalities and the displacement of 400,000 individuals. Considering the prominence of the coastal belt to the region and an estimated economic damage cost of US $830 million from climate change induced hazards over a decade [4], it is vital right now than ever that decision makers factor the impacts of climatic variability in their decision making process. This study would apply the mix scale model in analyzing these challenges facing the region.
2.1. Method Used
The paper uses a mix scale approach involving descriptive statistics and secondary data connected to GIS to assess the climate change challenges facing the Lower West African region in the Sub Sahara African area. The spatial information for the enquiry was obtained from several agencies consisting of the World Bank group, World City data Base, the Economic Community of West African States (ECOWAS) and the United Nations Industrial Development Organization (UNIDO). Other sources of spatial info emanates from the United States Agency for International Development (USAID), the German Federal Ministry of Research and Education, the West African Service center on Climate Change and Adaptation Land Use (WASCAL) and the Global Environmental Fund (GEF). In addition to that, the Government of the United Kingdom, the United Nations Environment Program (UNEP), the United Nations, the Organization for Economic Cooperation and Development (OECD). The United Nations office for the coordination of Human Affairs (OCHA) also provided other information needed in the research. Generally, the bulk of climate variability indicators relevant to the region and individual states were obtained from the Nigerian Bureau of Statistics, the Nigerian National Environmental Emergency Management Agency (NEMA), the Nigerian Meteorological Agency and the World Metrological Organization for some of the periods. On the one hand, the International Union for the Conservation of Nature (IUCN), and the World Bank Group and Keoma provided the secondary data on the numbers, frequency of disasters from droughts, floods, temperature, epidemics, number of casualties from climate change, greenhouse gas and CO2 emissions metrics. On the other, the United States Geological Services (USGS), the United Nations Food and Agricultural Organization (FAO) offered the mangrove vegetation data for the region.For additional data needs, the United Nations office for the coordination of Human Affairs, the World Health Organization (WHO) and IRIN were respectively critical in the procurement of information on the displaced persons from floods and econometric data highlighting coastal impacts of environmental change. In a similar vein, the United Nations Educational Scientific and Cultural Organization (UNESCO), the Oxfam and Intergovernmental Oceanographic Commission of UNESCO remained instrumental in the provision of other relevant information. Given that, regional and federal geographic identifier codes of the nations were used to geo-code the info contained in the data sets. This information was processed and analyzed with basic descriptive statistics, and GIS with attention to the temporal-spatial trends at the county, national, state and regional levels in the Lower West African region. The relevant procedures consist of two stages listed below.
2.2. Stage 1: Identification of Variables, Data Gathering and Study Design
The initial step involves the identification of variables required to appraise climatic variability with emphasis on trends and impacts in the Lower West Africans region. The variables consist of indicators grouped under socio-economic, demographics, physical and environmental elements. The demographic field consists of population by country and region, population growth rate, people affected or victims by nation, numbers killed, exposed population, hazard exposure in coastal areas. The socio-economic elements covers the monetary costs of hazards, ranking of exposed monetary assets in billions of dollars, projected exposure of port cities and current property value of affected areas. Among the listings, the environmental indices consist of distribution of mangroves, percentage of change, mangroves species and areas and coastline distance, vulnerable coastal areas, climate variability, exposure to impact and resilience index, total greenhouse gas emissions and percentages of change. The physical and climatic variables encompasses flood hazards, the average annual natural hazard, percentage of epidemics, drought, flood, storm, pest, submerged surface area and surface area lost through erosion. The remaining indices under that listing cover land area where elevation is below 5 meters, % of land area, elevation, temperature, rainfall, landslide rate, storm rate, hazard type and number of hazards and natural hazards by nation. The process continued with the design of data matrices for socio-economic, demography and environmental, physical and climatic variables covering the years 2000, 2006, 2008, 2010, 2012 and 2016. The design of spatial data for the GIS analysis required also the delineation of national and regional boundary lines. With boundary lines unchanged, a common geographic identifier code was assigned to each of the units to ensure analytical coherency.
2.3. Stage 2: Step 2: Data Analysis and GIS Mapping
In the second stage, descriptive statistics and spatial analysis were employed to transform the original socio-economic and climatic indices, and demographic and ecological elements of climate change and others into relative measures (percentages/ratios). This process generated the parameters for assessing the trends, impacts, factors, and indices such as the frequency of climate hazards, the number of disasters, the number of deaths, total population, CO2 emission, greenhouse gas emissions, mangroves area distribution, coast line distance and length. This was facilitated by measurements and comparisons of the trends over time. While this approach helps gauge the extent and form of climate change risks, vulnerability of coastal population adjacent to the shorelines and low lying areas, number of victims, the frequency of storms and other hazards and the loss of mangroves. The tables, graphs and maps highlight the temporal distribution of climate variability parameters made up of changes and total population, indices, monetary costs of hazards, extreme temperature rate, landslide rate, storm rate, hazard type, number of hazards, surface area lost through erosion and submerged surface area. The remaining steps involve spatial analysis and output (maps-tables-text) covering the study period, using Arc GIS 10.4 and SPSS 20.0. The spatial units of analysis under a mix scale consist of nations, cities, region, and the boundary and locations of areas exposed to climate risks along shorelines. The geographic data for the Lower West African region, which covered its boundaries and states, also includes ecological data of land cover files, and paper and digital maps from 1975 to 2016. The process continued through additional info from the world city population interactive electronic digital data involving maps, charts, shape files and map indices that highlighted the individual countries spatial area units of states, counties, administrative units, towns, regions, communes, over a different range of time. From there on, an in-depth extraction method was utilized to pinpoint the population proximal to ocean waters off the Southern Atlantic. This entailed using techniques of magnification under varying angles oscillating in and out at full view to capture vulnerable shorelines that were not previously visible for a better view on the interactive maps of coastal cities in the Lower West African region. That approach provided opportunity to track cities adjacent to coastlines and then gauge their level of vulnerability in each of the countries in the study area and ascertain if they met the selection criteria. After that, the outputs of the spatial data were mapped and compared across time from the 1970s to 2016 to see the dispersion of the regional climate change and the resultant hazards in the form of storms, droughts, deaths, the number of hazards, population change, and the various factors among the countries of the study area.
3. Results
This section of the paper presents the results of the data and environmental analysis of the effects of changing climate parameters in the study area. There is a first focus on the temporal profile of the hazards under a risk analysis. This is followed by a description of ecosystem change involving mangroves vegetation landscape distribution over time across the Lower West African region. The others include the identification of factors behind the changing climate in the areas, GIS mapping and the efforts of institutions. The results also cover a temporal profile of the variables and the host of other regional climate parameters from flooding incidents to the fatalities from natural disasters and the actual number of catastrophes that made landing.
3.1. The Most Common Risks 1975-2015
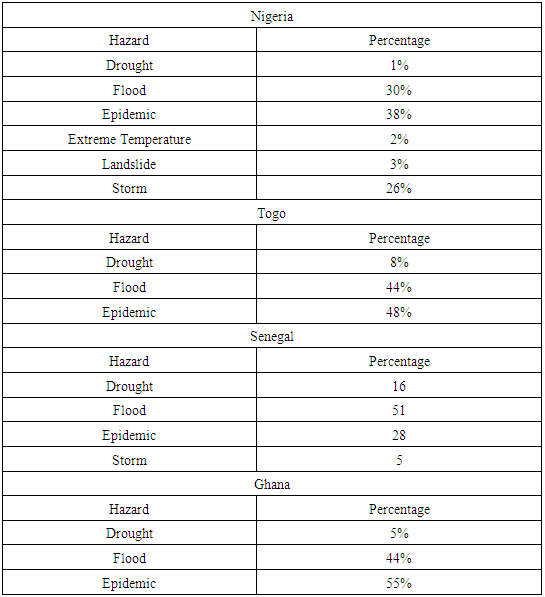
Among the most common risks, the outbreaks of epidemics and flooding between 1975 through 2015 appeared quite prevalent in the region. Of all the listed hazards, the percentage levels of flood and epidemics stood out as the most frequent dangers threatening the Lower West African nations of Nigeria, Senegal and Togo, followed by drought. From the data, note that the occurrence rates of flood events and the outbreak of epidemic were much larger in Togo at 44%-88% compared to the nation of Senegal where the percentage points varied by 51% to 28%. Given the frequency, the recurrent pace of hazards in Ghana charts a similar path at 44.6% -55%. Therein in the study area, the percentage levels of the common hazards for Nigeria over the years, reflects values consistent with a large nation of that size at 30-38 and 26 for flood incidents, epidemic and storms than the other areas. For drought, the frequency levels fluctuated by 16% for Senegal, 8, 5, and 1% for Togo, Ghana, and Nigeria respectively all through 1975-2015. Aside from all these disasters, there exists a constant problem of extreme temperature and landslides estimated at rates of 2% to 30% especially in Nigeria (Table 2). Table 2. The Most common hazards in West Africa 1975–2015
 |
| |
|
3.2. The Fatalities from Natural Disasters 1987-2015
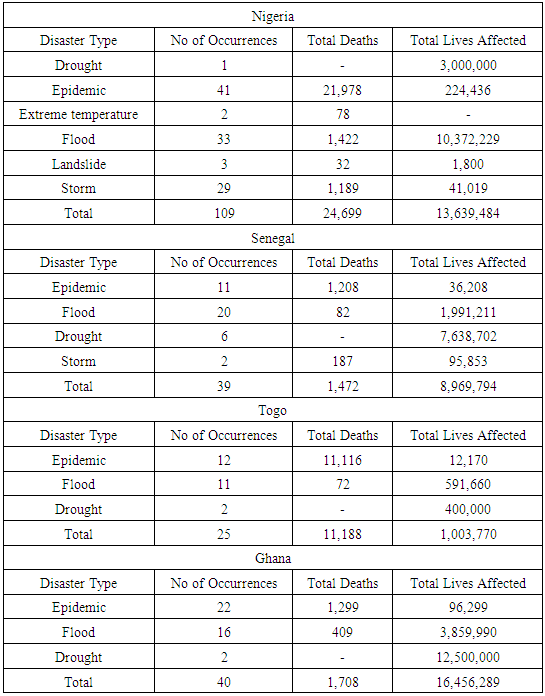
During the periods of 1987-2015, natural disasters seem to have taken a deep toll on the different countries of the region especially in the lives of people affected by the hazards, as both Ghana and Nigeria emerged severely hit all these years by disasters with total number of affected citizens. During those years in question, over 109 disasters made landing in Nigeria (Togo and Nigeria saw more deaths) with the individual frequency of landed hazards for Senegal, Togo, and Ghana at 39-25 and 40. The total numbers of casualties from the hazards show Nigeria to have experienced 24,699 deaths, Senegal 1,472, Togo 11,189 and Ghana 1,708. In the individual nations, of the 13,638,484 million victims of natural disaster in Nigeria, about 84.4% of the affected people came from drought at 3,000,000 and the other displaced 10 million occurred through flooding. Compare that to the 8,969,744 million people affected by natural disasters for Senegal out of which flood and drought outbreaks affected 1,991,211 to 7,638,700 people. Further along these lines comes Togo and Ghana where the total number of affected citizens ranged from 1,003,790 to 16,456,289. Seeing the magnitude of the disasters and handful of citizens from one nation to another, then it is not surprising that heavy flooding and drought were once again responsible for the misery that visited 591,660-400,000 people in Togo and 3,859,990 to 12,500,000 who faced similar nightmare in Ghana during the same periods. Forgotten in all these, are the tens of thousands of citizens in the path of epidemics outbreaks through infections and heavy storms in both coastal and inland areas of these nations. Sadly enough, Senegal and Nigeria accounted for the largest number of people impacted by storms with 49,019-95,552 kept in harm’s way (Table 3). Table 3. Natural Hazard Occurrences in West Africa 1975-2015
 |
| |
|
3.3. Mangroves Swamps Landscape Change 1980-2006
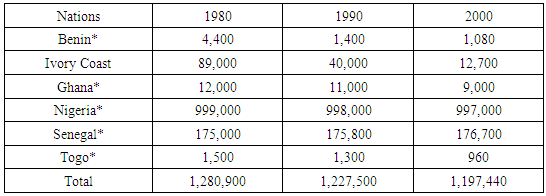
One critical parameter of climate change in the West African region given its essential ecological role and functions involves the current state of mangrove vegetation areas in terms of size in acreage and mileages. Taking into account, the distribution patterns of mangroves between 1980-2006 and 1980-2000, it is evident that the available areas among the countries continue to evolve over time. Beginning with a regional total area in mangrove swamps of 1,280,900 acres in 1980; the size dropped to 1,227,500 acres in 1990 and continued the slide to 1,197,440 acres in 2000. Of the six countries in the Lower West African region as the table indicates, both Nigeria and Senegal held the highest acres of mangroves swamps all through the years followed by Ivory Coast and Ghana and the rest of the nations. During the various years, the distribution volumes among the countries of Nigeria and Senegal shows the areas of swamp forests in these nations started from 999,000 ha then the numbers dropped to 998,000 ha and finished at 997,000 ha. Senegal on its part contained 175,000 ha in 1980 and the area grew further by 175,800 and 176,700 ha between 1990 and 2000. For Ghana, during these periods, the nation’s swamp mangrove stocks went from an initial coverage of 12,000 ha to a gradual decline of 11,000 to 9,000 ha between 1980 through 2000. During the same timeframe, Ivory Coast experienced notable declines stretching from 89,000 to 40,000 to additional 12,700 ha. The same declining patterns also occurred in both Benin and Togo where mangroves swamp areas dropped further by 4,400 to 1,500 ha in 1980 and the trend extended further or deeper in the next decade of 1990-2000 by 1,400-1,300 and 1,080 ha to 960 ha (Table 4). Table 4. Changes in Mangrove Swamps in West Africa Area (Ha)
 |
| |
|
3.4. The Distribution of Mangrove Vegetation
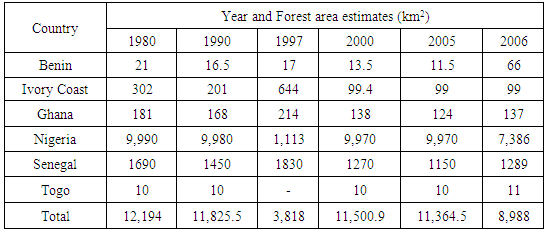
When it comes to the distribution of mangrove vegetation, between 1980 through 2006 in the region, the overall total vegetation size stood at 12,194 km2 but only to drop by 1990-1997 to 11,825 and 3,818 km2 in 1997 until it rebounded in 2000 by 11,500.9km2 In the periods 2005-2006, the study area saw its mangrove vegetation area change again from 11,365.5-km2 to 8,988 km2. From the picture painted so far, the size of mangrove vegetation has been falling from the 1980 level. Even among the three big nations (Nigeria, Senegal and Ivory Coast) with larger vegetation areas, the same declining trends seemed to hold firm all through these years. With that, Nigeria saw its mangrove forest area change from 9990 to 9890 km2 by 1980-1990. The slide continued by 1991-2000 by a pickup of 1113 to 9970 km2 until it fell again from 9,970 to7386 km2 in 2006. Elsewhere, Senegal had an opening mangroves vegetation land area of 1,690 km2 in 1980, which later dropped to 1,450 km2 in 1990. The declines for Senegal, which continued in the following years from 1,830 to 1,270 km2, went further up by a slight increase of 1,150-1,289 km2. In the central zone of the region, where Ghana’s mangrove forests areas fell from 181 to 168 km2 between 1980 and 1990, and 214 to 138 km2 in 1997-2000. During the period of 2005 through 2006, Ghana posted some notable increases in the size of forest areas estimated at 124km2 to 137 km2. In remaining areas, the trends in Benin not only reflects the situation in the other neighboring nations, but over the years the distribution patterns in Togo appear stable with no declines (Table 5).Table 5. The Distribution of Mangrove Vegetation in the Study Area
 |
| |
|
3.5. Factors Driving the Changing Climate Parameters
In terms of those factors that drive variations in climate change parameters, it is clear that they do not operate in a vacuum. They are associated with fluctuations in demographic elements of population, physical and environmental variables of temperature, rainfall, elevation and CO2 emissions. These forces are presented in detail under the following paragraphs.
3.5.1. Pressures from Teeming Populations 2010-2016
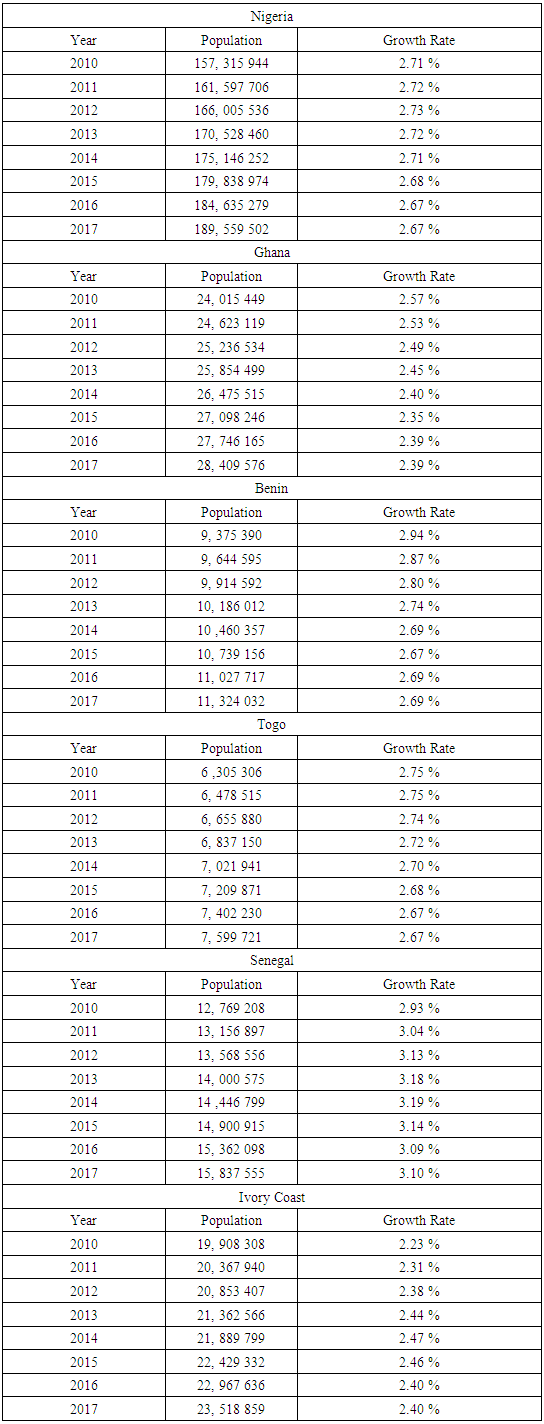
Having some of the projected fastest growing populations among nations in the world, the study area boosts of some of the highest population growth rates in the world, which raises concerns about the vulnerability of the respective population centers to climate change induced stress. Those kinds of growth levels emanating from teeming population exerts enormous pressure on fragile areas, and natural resources through the encroachment of new settlements in physically marginal places not suitable for habitation in a way that exposes the communities to climatic hazards associated with climate change. With the priority of local authorities in meeting the needs of citizens in these areas predicated on resource exploitation and ecological strain often unleashed through a teeming population and unsustainable practices along the shorelines. The resurgence in infrastructure design, new homes, and bridges and roads in these settings often puts citizens onto deadly storms paths and in harm’s ways in a manner not seen before. Going by the projected population increases in most coastal areas in the region and the fact that these zones exhibited high growth rates consistently, it is not then startling that the population surges and interactions with climatic parameters in the countries over the years have numerous implications in lieu of the resultant stress levels. With an average regional population growth rate at about 2.69% between 2010 and 2017, the majority of the nations maintain population growth rates of 3.10%-2.45%. Seeing that the three neighboring countries of Nigeria, Benin, and Togo have identical population growth rates (of 2.70%, 2.76 and 2.71% respectively), the others like Ghana and Ivory Coast posted similar growth levels of 2.45%-2.39% respectively (Table 6).Table 6. The Population Growth Rate in Lower West African Region 2010-2017
 |
| |
|
3.5.2. Population Trends in Coastal Communities
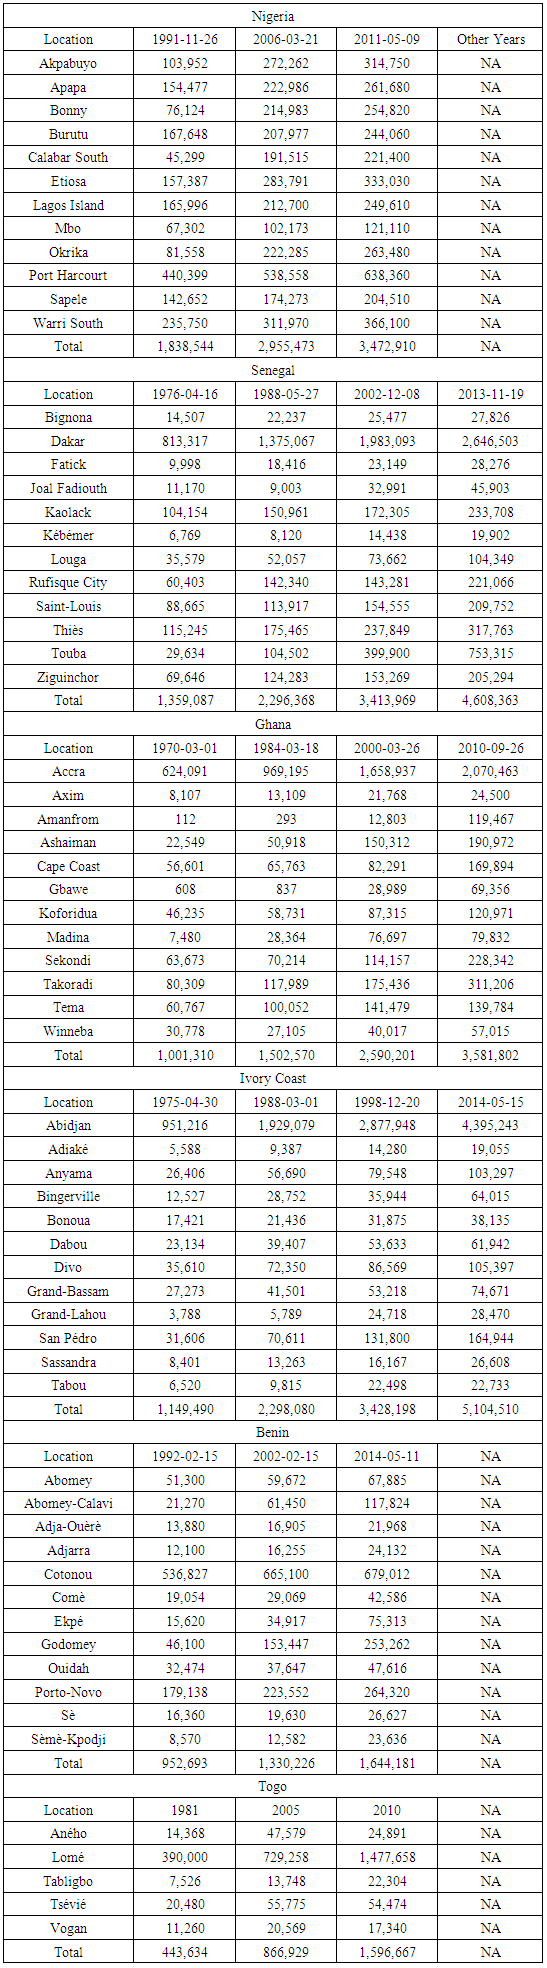
Looking at the yearly regional population distributions over the years in the study area shows they remained on the rise among the coastline communities in Nigeria, Senegal, Ghana, Ivory Coast, Benin and Togo. For that, the changing coastlines population reminds one of steady trend relevant to climate variability assessment. To buttress that, consider the periods of 1991-2011, when Nigeria saw surges in its total coastal populations in the Deep South region from Akapbuyo to Warri South in the oil rich Niger Delta and some portions of Lagos. During that period, population figures along those coastlines went from 1,838,544 to 2,955,473 and 3,472,910 citizens. The important thing to glean from the rapid increase in coastal populations in Nigeria stems from their common attributes as major economic centers. In fact, coastal cities like Port Harcourt, Warri South, Lagos Island, Apapa and Sapelle are industrial hubs known for oil and gas, refineries, shipping and banking, distribution and exchange that attract high influx of people for business transactions and employment opportunities. The volume of investment activities and fiscal infrastructure in the areas of shipping, oil and gas for which they have been known for in the last decades at global, regional and national levels are major catalysts for the respective population increases.With all that in place, in the decade of 1991-2011, port cities like Warri South experienced a major uptick in population with the numbers up by 235,750-366,100. While Port Harcourt grew from 440,399 to 638,360, Akpabuyo on the other hand, stood out in population ranking as well with 103,952 to 314,750 in the number of inhabitants. In the southwest region of the country, the Apapa and Lagos Island economic axis of Lagos state held on to rising increases in residents at 154,477 to 261,680 and 165,996 to 249,610. The same thing holds for Senegal where overall coastal cities population on the edge of the Atlantic since 2002 to 2013 rose tremendously with notable tallies (in the order of 1,359,087-2,296,368 and 3,413,969-4,608,363 respectively) with much of that more evident in the cities of Dakar, St. Louis, Kaolock, Thies and Touba over time. Also in Ghana and Ivory coast, coastal population reflect similar patterns, the estimates for Ghana during 1970 to 1984 at 1,00,310-1,502,570 stayed unchanged all through the years with huge rises (of 2,590,201 to 3,581,802). For the Ivory Coast, the number of coastal inhabitants jumped significantly as well by 1,149,490-2,298,080 from 1975 through 1988 and continued at 3,428,198 and 5,104,510 all through 1998 to 2014.Among the other remaining countries of Benin and Togo with low-lying coastal areas, for the former, population figures ranged from 952,693 in 1992 to only jump to 1,330,226-1,644,181 in 2002-2014 while the later saw a similar path in the growth of its number of residents’ tallies with 443,634 to 866,929 and 1,596,667 all through 1981, 2000 and 2010 respectively. Notwithstanding the population rises, there is a major implication since these cities are all in low-lying zones at the epicenters of recurrent barrage of major storms and heavy rainfalls known to batter the lower West African region from year to year. With some of these cities risking full submergence into water with an eventual disappearance on to the ocean, being adjacent to the paths of recurrent inclement weather events annually coupled with the risks of sea level rise, raises the spectra of unwanted exposures to dangers for communities in the region. For that, places like Okrika, Lagos Island in coastal Lagos, Aneho in Togo, and other cities in the Niger Delta region and those in Ivory Coast, Ghana, Senegal and Benin have been at the receiving end of some of the most violent storms along the Gulf of Guinea and the Atlantic Ocean in recent years. In light of that, unprecedented population expansions at current pace in these areas pose major risks to citizens to the detriment of their well-being and the surrounding ecology in the face of climate change induced stress in the region (Table 7).Table 7. The Population Trends in Coastal Cities in the Study Area
 |
| |
|
3.5.3. Changing Temperature, Rainfall and Elevation
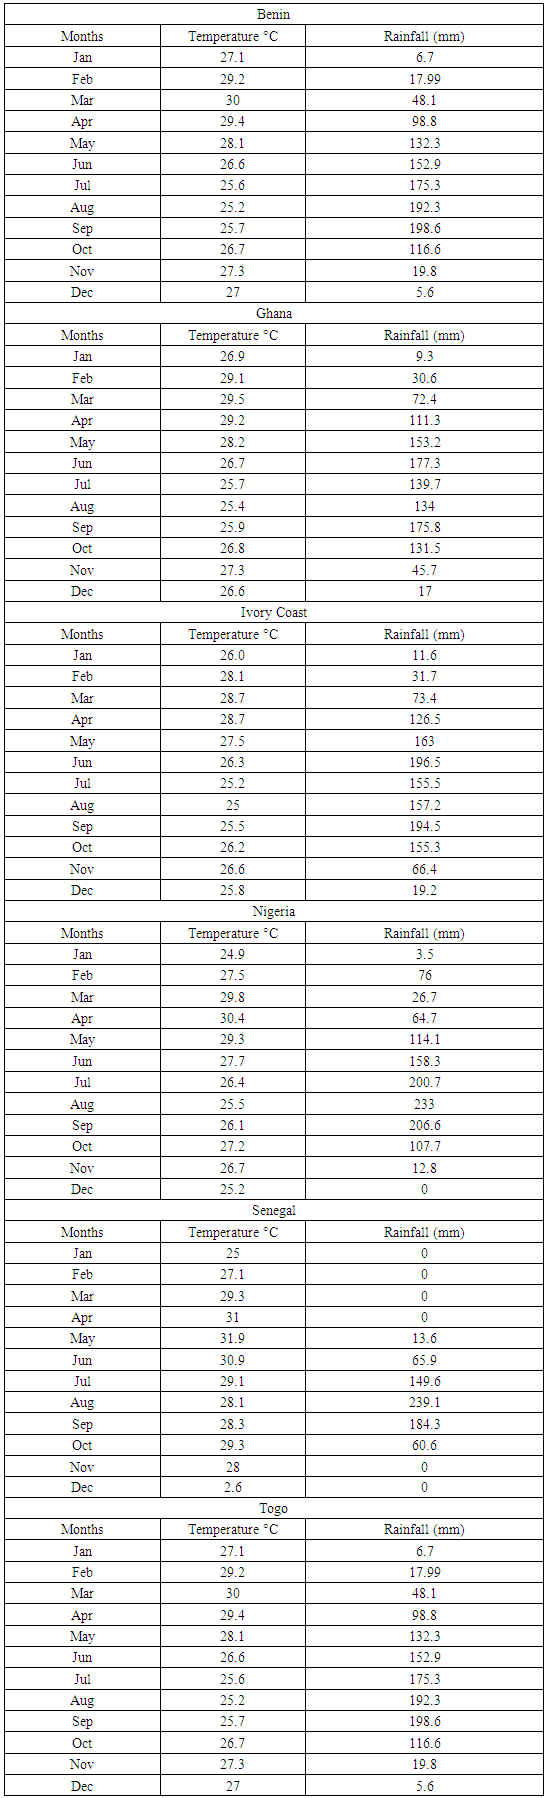
Considering the level of exposures inherent in the Lower Western African region, other climate change parameters associated with hazards and vulnerability including indices such as the level of monthly temperature, the amount of rainfall events from 1991 to 2015 and carbon dioxide during 1970 through 2015 are critical in the analysis. Among the countries in the region, the mean values for temperature and rainfall stood at 27.08 °C and 94.21 mm, respectively between 1991 and 2015 (Figure 2). Of these nations, Ivory Coast saw a lowering of the monthly temperature average of 26.63 °C and the highest rainfall level of 112.56 mm. In the upper Southwest area, Senegal that recorded 26.71°C in the degree of hotness endured lowest rainfall estimates of 59.42 mm. For the adjoining areas in the Southeast corner, Nigeria not only followed up with 27.22°C in average monthly temperature, but its level of precipitation at 100.34 mm exceeded those of the other remaining nations in the study area. Elsewhere, the trio of countries most notably Benin, Ghana and Togo all maintained identical levels of temperature and rainfall estimated at over 27°C and 97.00 mm. It is worthy to note in the region that while the common temperature appeared stable at over 27°C, the rainfall pattern seemed slightly consistent in the three neighboring areas with irregularity in one place and much higher in the other two countries over time. In the study area, note also that the months of April to October accounted for the highest level of rainfall with the upper scales of 3 triple digit levels prevalent in Ghana, Benin, Ivory coast, Nigeria and Togo. The patterns for Senegal during these years varied with highest monthly average volume for precipitation at 49.6 mm, 239.6 mm and 184.3 mm from the months of July to September. A further look at the highest peak levels in rainfall trends of the region indicates Nigeria received more precipitation than others in the months of July, August and September when rainfall intensity exceeded 200mm. During those periods, the temporal distribution of rainfall patterns for Nigeria all through 1991-2015 involved 200.7mm-233m in July and August and 206.6 for September. Aside from accounting for the highest rainfall volume of 239.1mm in the region during August, the westernmost nation of Senegal facing the Atlantic also experienced additional downpours at levels estimated at 184.3 mm. With identical higher precipitation levels of 192.3-198.6mm evident in the neighboring nations of Benin and Togo during the months of July to August, Ivory Coast endured massive rainstorm levels of (1996.6mm-194.5mm) in June and September while the levels for Ghana faded by 177.3 mm-175.8mm during the same months (Table 8). Additionally, one needs to not overlook the high propensity to sea level rise associated with climate risks given the average elevation numbers of coastal cities in the region. Out of a regional coastal average of 37mm among the countries, Nigeria’s coastal cities of Warri, Port Harcourt and Lagos posted a combined average of 10 m in elevation, which is below the individual scale for the other countries. While this makes the Nigerian coasts prone to shoreline hazards, the same can be said of the other countries in the region as well.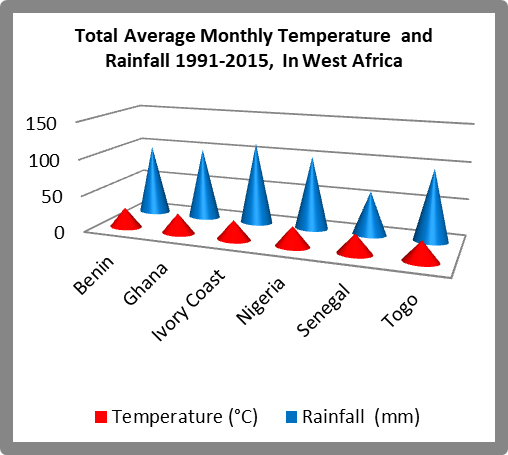 | Figure 2. Summary of Total Monthly Temperature and Rainfall |
Table 8. Average Monthly Temperature and Rainfall 1991-2015
 |
| |
|
3.5.4. CO2 Emission Levels in the West African Region
Being at the epicenter of climatic risks, the level of CO2 emission distribution between 1970-2015 shows the total highest levels of emission concentrations of 1,194,653.60- kilotons in Nigeria, while Ghana emerged as the second highest emitter during same period with 89,708.40kt and the Ivory coast followed in that order at 78,246.70 kt. The next group of nations in the region (Senegal, Benin and Togo) had CO2 emission discharges of 57,852.10 kt-28,988.9 kt and 15,525.40 kt below the estimates of the first three countries, although the emission volumes increased all the years among the low emitting nations like Benin and Togo. It is worth noting that among the individual nations like Benin, aside from the gradual rises (306.9-47 1.5 kt) in the opening periods of 1970-1973, the numbers fluctuated in 1976-1985 (at 360.7-503.7 kt and 510.9-611.1kt for 1982-1985) to peak again (at 1,358.5-1,537.9 kt) in 1997-2000. This upswing in CO2 emissions again continued with back-to-back levels all through 2003 to 2015 when the estimates for Benin ranged from 2,395.3 to 5,811.3 kt. With an initial emission volume increase of 2,331.0-2,536.4kt in 1970-1973 for Ghana, the quantity of discharged CO2 vacillated further by 2,947.3-2,621.0 kt between 1976 and 1979. The trends continued all through 1985 to 2015 as growth in emission discharges held firm year after year (with 2,350.9 kt in 1985, 3,770.7 kt in 1994, along with the 7,909.6kt- 9,889.2kt discharged in 2012-2015). Furthermore, the pace of CO2 emissions in neighboring Ivory Coast consist of some variability in the order of 2,607.2-3,040.1kt and 3,877.6-4,149.8kt by 1970-1973 with visible spillovers to the 1976 and 1979 fiscal years. With time, another notable evidence of more surges in the discharge of CO2 came (of 2,959.4-3,281.0 and 5,435.6-6,656.1 kt) between 1991-1994 and 1997-2000. From 2013 to 2015, Ivory Coast saw further emission levels of 5,579.1 to 9,889.2 kt.In the case of Nigeria, the country saw some consistency in CO2 emission growth levels from 1970-1973 and 1976 -1979 (at 26,036.2 kt- 59,440.4 kt and 67,781.1-89,976.9 kt). By 1982-1985, the CO2 emission concentration in the nation expanded further from 65,389.4 to 68,299.7 kt, and continued at 71,693.3-74,976.9 kt in 1988 through 1991. Conversely, in the ensuing years (of 1997-2007, 2003-2006 and 2009 to 2015), different patterns in CO2 flows involving drops (91,049,6-90,822.7kt and 93,078.4-81,549.7 kt) emerged. Further, along the years, Nigeria’s emission levels showed further increases of 72,174.4, 81,596.4 and 86,895.9 kt. For Senegal, the atmospheric discharge of CO2 points to visible increases in the periods of 1970 through 1973 at 1,340.6 -1,153.7 kt, and by 1976 -1979, emission surged further by 1,875-2,159 kt. Other instances of emissions for Senegal consists of the levels in 1982-1985 at 2,111.0-2,325.0 kt and those in the ensuing years of 1988-2015 which rose further by 2,153.9-2,367 kt and 2,539- 82003 kt. Besides an increase of 344.8-363.4 kt and 345.70-544.0 kt in emissions for 1970-1973 and 1976-1979, Togo also saw decreased levels (of 559.2-426.3 kt) in CO2 during 1982-1985 followed by slight increases (measured at 674-693 kt) in 1988-1991 and the 742-844.3 kt between 1994 and 1997. In the later years of 2006 through 2009, the country’s emission rose by 1,212.1 kt to 1,634.7 kt and continued at 2,162.8-229.6 kt for 2012 to 2015 (Figure 3).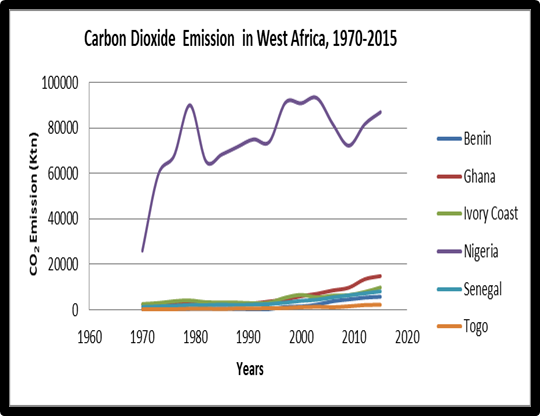 | Figure 3. Carbon Dioxide Emission, 1970-2015 in West Africa in ‘000 ktn |
The variability in CO2 emission patterns and temperature in these circumstances over the years from 1970 through 2015 have grave implications in the coastal areas of the Lower West African region. This comes at a time in which elevated global temperature is accelerating the melting of large sheets of the Arctic ice that are dumping huge volumes of water into the Atlantic Ocean. Such level of change from the global climate exposes residents of low-lying coastlines along the study area to harsh climatic hazards.
3.6. GIS Mapping and Spatial Analysis
In the context of climate change risks in the study area, it is evident that most of the coastlines are low-lying areas that are relatively closer to one another. This comprises areas located in the Nigeria’s Deep South zone of the Niger Delta including Lagos in the south west to Port Novo, Lome in Togo and Accra, as well as the Abidjan axis to the upper western part in Dakar, Senegal. These areas cover a large network of seafront settlements at the center of regional economic activities but vulnerable to changing climatic parameters often manifested in the respective places. In that case, understanding the propensity to climatic risks among coastal communities within those settings requires colorful visualization of climate parameters known to unleash the extreme events in the region under different scales through spatial analytics using GIS. The different map symbols crafted in different shades embody various stressors, climate predictors, and their spread patterns in a GIS map. For efficient coastal zone planning and assessment, developing a comprehensive regional climate risk index for the Lower West African region geospatially through this framework serves a vital purpose in transboundary planning. Above all, this embodies the geographic visualization of climatic risk factors and other variables in a format not calibrated in the past.In the study area coastlines prone to extreme climate events, the vast network of 813 km coastline distance stretching through Nigeria on the southeastern tip of the map stands as a constant reminder of the fate and scale of exposure to most climatic hazards in densely populated settlements. Further along the central and western paths of the region come Ivory Coast, Ghana, and Senegal, which share relatively similar lengths of coastlines (measured at over 500km2) with the lowest shorelines of 121-56 km in the neighboring republic of Benin and Togo. The presence of such extensive web of coastline distances spanning over multiple nations in the region often exposes citizens to climatic hazards through heavy rainstorms, sea level rise and coastal flooding in the event of severe weather (Figure 4). With its low elevation levels, port facilities and economic power therein, coastal cities in the region prone to climatic hazards all share projected exposure of their population and monetary assets to destruction through sea level rise. For that, in 2100 of the group of Lower West African cities marked for impending disasters, the port cities of Abidjan and Lagos (Ivory Coast and Nigeria) will have millions of people exposed to coastal hazards while the same fate awaits hundreds of thousands of coastal residents in the port cities of Lome, Dakar and Accra. During the same period, the estimated concentration of the monetary damages point to gradual dispersion of these liabilities along Abidjan and Lagos (at $142 to $111.0 billions). The other clusters of projected liabilities stretches further onto the neighboring port cities from Lome to Accra. Besides, the gravity of risks posed to these communities, they are also in danger of potential disappearance being low-lying coastline areas with elevation lower than 1 meters above sea level, the likelihood of coastal erosion and flooding and the destruction of infrastructure remains common (Figure 4).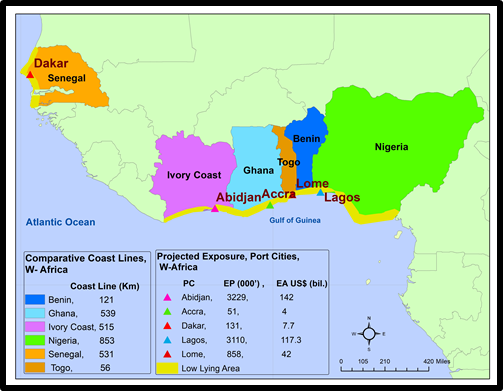 | Figure 4. Coastline Area and Exposure of Port Cities in 2100 |
These problems remain worrisome given the risk exposures brought about by the narrow elevation patterns in the key coastal cities. The geographic cluster of average elevation and the vulnerability of the low-lying major cities in these places show that citizens are at risk of the threats of intense flooding and heavy downpours during the rainy season. With the overall average elevation figures significant enough to put coastal communities in the respective nations in harm’s way. The spatial distribution of the regional elevations in 2008 show a slightly lower value of 12m-18m for the cities of Dakar and Abidjan in the Upper western zone of the map. Further, into the central area, a mix of other cities emerges like Accra, Lome, and Cotonu where the elevation levels (of 91 m, 64 m-51 m) exceeds the others. This contrasts greatly with the trio of southern Nigerian cities (Lagos, Warri and Port Harcourt) with low elevations and where Lagos stands out as the lowest lying major city in the study area (Figure 5).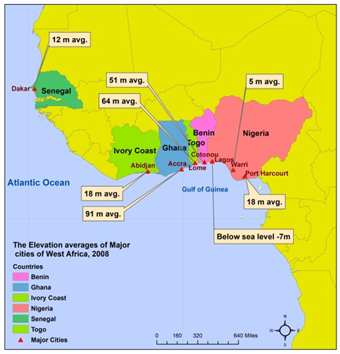 | Figure 5. Elevation of Key Metro Areas, 2008 |
With the plethora of hazards in West Africa, the vulnerability of vast areas in the coastlines of the region to the threats of sea level rise and the possibilities of submergence are troubling. The nature of these dangers reflect the unwanted nightmares of countries distinguished in different colors (of blue, yellow, or orange, dark and light red) representing Nigeria and Benin on the South East, Ivory Coast, and Senegal depicted as areas of potential submersion. From the map, the highest submerged surface areas 8,864 km2 to 1,650 km2 seem dispersed all through the southern and western part of the coasts along Nigeria, and Senegal. Looking at the central corridors of the map, both Ivory Coast and Benin share the same risk levels as well, even though their exposure to submerged surface areas cover about 17.5-471 km2. Regardless of the varying sizes of areas awaiting submergence in 2100, consider the political and economic infrastructure in place and the continual attraction of people to low-lying coastlines prone to sea level rise. Huge dangers await these nations if effective environmental safety measures are not taken to curb current practices involving shoreline dredging and land reclamation efforts from the sea for redevelopment. Being the offshoots of costal planning and waterfront development initiatives in these areas, residents risk periodic flooding of the built and natural environments like homes, highways, farms, wetlands, lakes and the erosion of other critical life support infrastructure essential in low-lying areas. As the maps imply, the scale of these projected hazards are quite critical to the future of at risk areas in the region in the coming decades (Figure 6).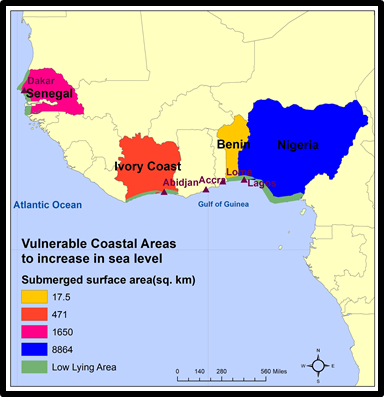 | Figure 6. Projected Submergence of Coastal Areas |
Bearing in mind the scale of climate hazards felt in the region, existing data indicate that their variability and impacts from 2009 to 2010 transcends the nations in different ways. For that, during 2010, the individual level of areas where elevation stood less than 5 meters of land, showed Senegal ahead of the others with such land classification types making up 3.5% to 1.0 % of the total landscape in the country. Within the same period, not only did the region see similar rates of exposure to the risks induced by topography, but a group of nations made up of Ghana, Togo, Nigeria and Ivory Coast saw 0.6%, 0.4% and 0.2% of their available land fall under that category. Note also that population distribution over areas with elevation below 5 m again shows both Benin and Senegal with 11.9-10.1% of their total populations clustered in those zones at levels that exceeded the other nations. The same spatial pattern reoccurred in the Ivory Coast and Togo where 3.8-3.6% of their respective total populations are concentrated at elevations below 5 m. In the case of Ghana and Nigeria, the exposed or at risk population rate to lower elevation level ranged from 2.6% to 2.7%. Taking into account other climate parameters consistent with the region like droughts, flood, extreme temperatures, annual percent of total population exposed to these stressors stood at 1.0% for Ghana and somewhat miniscule for the remaining countries with 0.9% of the populace for Benin, 0.0 for Ivory coast and 0.1%, 0.6%, 0.05 % for Nigeria, Senegal and Togo. However, they are lethal enough to inflict lasting impacts in their wake on any of these areas in the event of any major disaster during the years in question (Figure 7).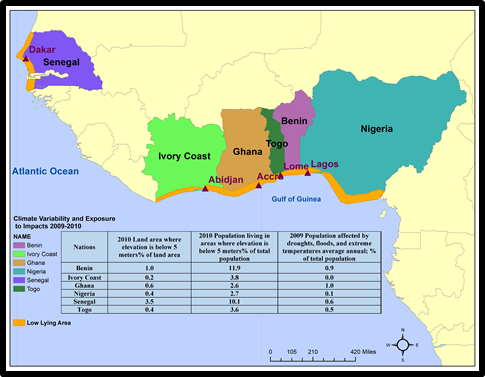 | Figure 7. Areas Experiencing Climatic Variability, 2009-2010 |
The climate change induced natural disaster recurrence affected millions and tens of thousands of victims for decades in the Lower West African region. The gravity of the annual burdens of these disasters on people of four nations (Senegal, Ghana, Togo, and Nigeria) impacts everything in the locus of their daily lives from the devastated farms to the displacement of citizens. With the majority of the disasters prevalent in the four nations as shown in the map, it is clear that flooding incidents stands out as the biggest hazards over the years. Beginning in the late 1980s and 1999, the exposure to flooding in Nigeria among victims all through 1986-1999 stood at 300,000-500,000 to 100,000-90,000 people. The victims grew further in 2003-2009 to 201,000-150,000 and jumped to about 1,500,000-7,008,667 in 2010-2012. From there on, a gradual diffusion of the hazards involving storms moved further out to the central portion of the map where Togo saw many impacts which involved growing number of victims from 1994-2012. Aside from the 11,500-44,814 and 92,000 people affected in 1994-2010, by 2012 the numbers dropped to 134 for the country.In the neighboring area of Ghana, for a country of its size and population, storm incidents affected many citizens in record high numbers with estimates running in the millions to the hundreds of thousands (2,000,000, 700,000 and 324,602) during 1991-1995 and 1999. In the 2000s, the spatial distribution of the number of flood victims fluctuated visibly between 2001 and 2012. During that time, the number of flood victims went from 144,025 to 332,600 and continued at 332-600 to 58,000. With the victims in the remaining years of 2009-2012 estimated in the hundreds of and tens of thousands, Senegal presents a different set of victims with much of that attributed to droughts in 1982-2002. The numbers varied by about 1,200,000 to 284,000 victims followed by another 23,022-95,853 with much of that coming from epidemics and storm incidents. Given that the periods of 1998-2002, and 2009 accounted for the largest victims of floods estimated at 300,000, 179,000 and 287,384, by 2005-2008, the country saw a temporary drop in the flood incident. From all these incidents, it is clear that whereas the number of people affected by flooding grew over time, the emerging risk patterns and vulnerability did spread rapidly from the lower southeast, the central and western zones of the map of the region (Figure 8).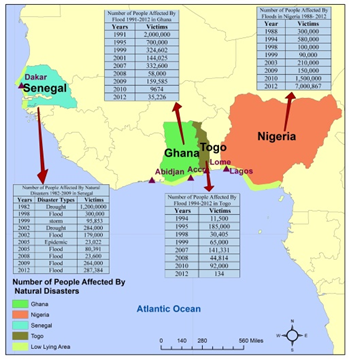 | Figure 8. Natural Disaster Occurrences 1988-2012 |
The geographic distribution of greenhouse gas (GHG) emissions shows a mix of intense and medium levels concentrated in different countries with closely connected shorelines. These littoral features running through southern Nigeria coastlines with inroads into Porto Novo to Lome in Benin and Togo extends deeper into Accra, Ghana and Abidjan in the Ivory Coast, and further on to the upper west area in Dakar Senegal with the Atlantic and Gulf of Guinea nearby. This puts the adjoining communities at risk considering the contributions of GHG emissions to global warming and melting of the Arctic ice and the eventual movement of high volumes of melted ice towards the Southern Atlantic and the region where heavy rains and flooding constantly batter the shorelines in these countries. While the implication stems from the vast spreading of CO2 into the air sheds of these nations, the largest emission levels (of 301,010.1-107,784.3 thousand metric tons (Tmt) in Nigeria and Ghana in 2012 outpaced the volumes for Benin, Togo and Ivory Coast (at 33,533.31, 22,931.9 to 33,502.2 Tmt) respectively. Towards the upper west corner, Senegal as the third largest emitter in the region accounted for the 54,185.4 Tmt in the same period. Seeing that high emission discharge transcends the Lower West African nations, the percentage share of the emission indicates that the spread of higher rates across Nigeria and Ghana stood at 55.43-19.49%. Following that direction are 9.79% in emission shares for Senegal and the 6% plus rates for Ivory Coast and Benin while Togo accounted for 4.14%. Regarding the spatial distribution of the changes between 1990 through 2012, Ivory Coast and Benin saw high double-digit percentage declines of -78%-28.9%. Conversely, in the same time frame, Nigeria and two nations most notably Ghana in the central and the other in upper western portion of the map posted very substantial levels of emission rates estimated at 265.4%-391.9% followed by the 84.4% levels for Nigeria and the 71% for Togo (Figure 9).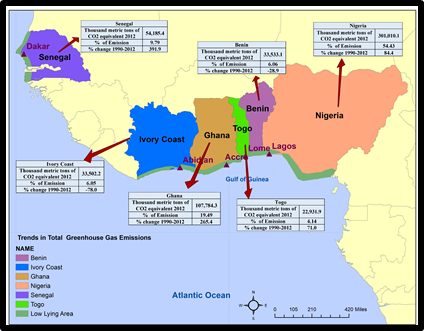 | Figure 9. GHG Emissions 1990-2012 |
The geographic mapping of population trends along the coastal areas of the study area covers six nations in the Lower West African region from 1970-2014. The countries are listed under different colors of purple and light purple denoting Nigeria and Benin Republic, light green for Ivory Coast, blue for Togo while Ghana and Senegal have yellow and orange color identification. Accordingly, the spatial distribution of the trends indicates a shifting of intense population growth rates all through the coastal cities from Senegal, to Ivory Coast, Togo, Benin, Ghana, and the Nigerian shorelines in a way that puts people at risk notwithstanding the dangers flooding posed to the cities. From the mapping, it is clear that the coastal cities in Ivory Coast outpaced the others with more percentage rates of increases. Senegal followed up in the same way along those lines with high population incursions onto the coastlines. The same thing goes for Ghana where all cities on the shorelines have seen increases totaling 202-161.64% beginning from the cities of Axim to Takoradi in the lower Southern portions of Cape Coast alongside Meana and Sekendi. Similarly, encroachments from teeming populations at other places were visible on Togo’s coastline through double digits increases of 54% in population in the cities of Aneho, Tsevi and Lome. Further, along the southern axis, note the gradual surge in shoreline populations in Benin where the cities of Adjara, Come and Quidad posted notable double digit increases (of 99.43-45.63%). With Senegal’s vicinity to the Atlantic Ocean and the attractions of coastal population growth, the demographic trends among the cities show vast concentration of population in multiple cities from Dakar to St. Louis. The geographic breakdown of the growth rates for other four cities (Zigunorci, Lebrent, Bijuoa and Thies) are in the order of 136.56-194%, and 91.8-205.99%. The major dangers therein stems from the vicinity of these coastal cities to the Atlantic waters and low-lying areas (Figure 10).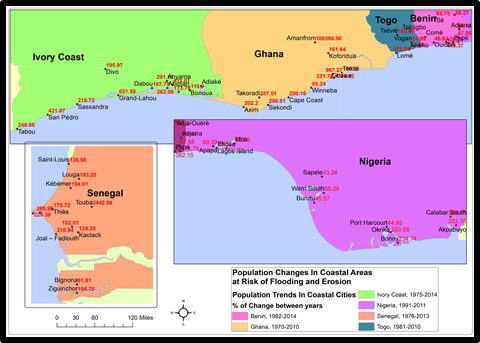 | Figure 10. Coastline Population Concentration 1970s-2015 |
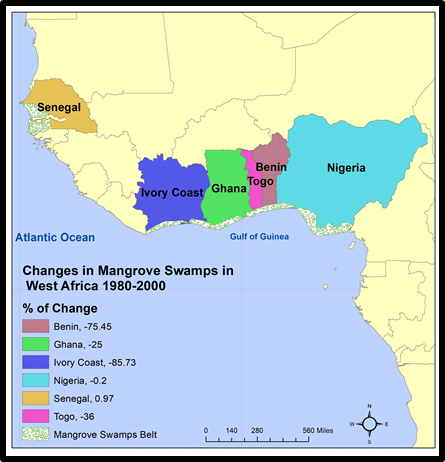
In the other countries, the major shorelines in Ivory Coast made up of Tobua, San Pedro and Sanada saw notable increases at the rate of 248-421.87% and 216.72% followed by further shifts of population increase towards the coastlines not far from the Ghanaian border. Within the area, population gains occurred at rates of 651.58% to 262.0-118.6% along Grand-Laheu and Buona areas on the southern tip of the country. Further, along, the lower south of the region, the map shows heavy population growth rates of 382.15% in the Ekpe area of Benin. Along the neighboring coastlines on the Nigeria border within the Lagos axis in south west Nigeria, comes double digit growth rates (of 79-69% and 36-86%) clustered across such cities like Apapa, Etiosa, Lagos Island with continuity of that pattern extended into the Niger Delta area near the Gulf of Guinea. Further evidence of population increases along the Nigerian coastline held firm in Sapele, Warri south, Burutu, Port Harcourt and Bonny areas in Rivers state and the Calabar South and Akpabayo areas in Cross Rivers state (Figure 10). With such an evident of population increases, there exists a heavy spreading in human settlements onto the fragile coastlines prone to heavy storms and flooding in the Lower West African region.Aside from being a buffer against coastal erosion and the threats of sea level rise along the coast of West Africa, the region has been experiencing growing disappearance in its mangroves distribution between 1980-2000 and 2006. With such threats now putting the environmental benefits of mangroves in jeopardy along the shorelines, the six countries in the study area contain diverse species of mangroves. These are mostly spread across in three group of nations beginning from Senegal to Nigeria with the concentration of 7-8 mangrove varieties under a vast land mass of 7,836-1,287 km2 along the mangrove belt (Figure 11). From the map, the second tier of nations, Benin and Ghana, are listed with 6 species covering total mangrove areas of 66-139 km2 while Ivory Coast and Togo on different ends of the coast lines contain 5-3 mangrove types on a 99-11 km2 area (Figure 11). Furthermore, the state of mangrove ecosystem is also manifested by the pace of degradation involving declines in swamp areas and vegetative cover and minute gains in just a few places that occurred over the years between 1980-2000 and 2006. From the maps one sees that as the dispersal of bigger rates of declines (-74.45% to -85.73%) in mangrove swamps during 1980-2000 held firm in both Benin and Ivory Coast, Ghana and Togo experienced rates of declines of -25% to -36% while Nigeria and Senegal rounded up the list at -0.2% and 0.97% (Figure 12). With the exception of the 214.6%-10% gains for Benin and Togo in 1980-2006, the rest of the countries (Senegal, Ivory Coast, Ghana and Nigeria) from the western edge of the map to the South all saw double digit declines of over 23%-67.21% in mangrove vegetation between 1980-2006 (Figure 13).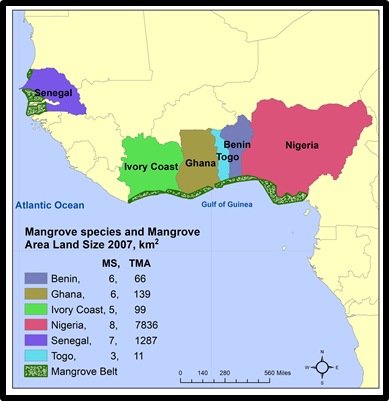 | Figure 11. The Dispersal of Mangrove Varieties, 2007 |
 | Figure 12. Changes in Mangrove Swamps 1980-2000 |
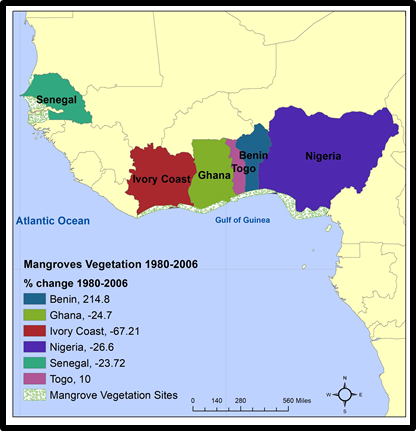 | Figure 13. Variation in Mangroves Vegetation, 1980-2006 |
3.7. Mitigation Initiatives through Various Programs
Considering the continual exposures to extreme climate events in the study area and the parameters that drive them, numerous collaborative initiatives are now in place to minimize the ferocity of climate change risks convulsing the Lower West African region. For more on the efforts of different agencies and actors committed to the mitigation of dangers posed by changing climate parameters, see the details below.
3.7.1 Training Program on Climate Change Adaptation and Disaster Reduction
Knowing that Africa remains for the most part susceptible to the effect of climate change given the level of impoverishment coupled with the dependence of the teeming population on rain fed farming and the threats to food security. The World Meteorological Organization has initiated the training scheme on Climate Change Adaptation and Disaster Risk Reduction in Agriculture to advance the capacity of technical facilities among West African nations. The proposed plan strives to minimize the effects of climatic variability on farming operations and to back sustainable development using advanced warning methods and weather projection. With the financial support from Italy and other partners, the venture covers 17 nations of the ECOWAS including those in the Lower region (Benin, Ivory Coast, Ghana, Nigeria, Senegal and Togo).
3.7.2. Regional Coastal Management Program
In the face of the dangers posed by climate parameters beginning with sea level rise in a region where unsustainable infrastructure growth and population increases, poor use of natural resources threaten coastal ecosystems. The World Bank in consultation with other partners both local and international through the formation of the West African coastal areas management program (WACA), has responded to this growing concern and the necessity for regional integration. For that, the WACA emerged as an assembling framework upon which technical and economic partners can back sustainable development in the fragile coastline zone, adopting techniques of coastline management to mitigate shoreline destruction and menacing inundation as the focal point.
3.7.3. The Development of the WASCAL Program
In an era in which climate change ranks high among the major issues facing Africa in the 21st century, West Africa is now dealing with the pressing task of putting together operational adaptation and mitigation actions. The West African Science Service Centre on Climate Change and Adapted Land Use (WASCAL) framework was developed in the region to respond to the recurrent challenges unleashed by inclement weather. Being a comprehensive research oriented weather operation institute established to confront this issue and monitor the response of human and natural environments to climatic variability. The center has attained these objectives by supporting the research structure and capacity associated with climate change in the region by building on the experience among ten West African nations and the government of Germany.
3.7.4. The Design of Innovative Hydromet Devices
For nearly two decades, West African nations have suggested the need for essential and monetary initiatives to fortify their ability to adjust to projected climate change during their Initial National Communication (INC) and National Adaptation Program of Action (NAPA). These initiatives hold info on major exposures, potential acclimation schemes and policy. The adaptation goals reflect instant acclimation requirements, plans, main concerns and probable implementation techniques. Additionally, the African Union and the Economic Community of West African States (ECOWAS) are in the forefront of climate change adaptation. They support the incorporation of climate events into both sectorial and development plans with hydro meteorological devices. The ECOWAS has also widened deliberations and educational trainings to promote debates on climate change under various themes such as farming, hydrology, transportation and disaster risk management.
4. Discussion
Bearing in mind the analysis as carried out in this enquiry, it is evident that the coastal nations of the Lower West African region have vast potentials as manifested by their sheer land size, unique ecosystems and economies. These nations have vast economic prospects, high concentration of infrastructural development and investment opportunities in the metro areas of the region. With substantial levels of the region’s populace and commercial structure fully concentrated within the coasts. The vast proportion of city inhabitants resides in coastal areas of the region that account for 33% of the inhabitants with an annual growth rate of 4%. Just as the study area’s coastal zone accounts for 56% of the region’s GDP, it extends to major cities with vibrant economic prowess. The zone also contains an abundance of natural assets flourishing on land and the ocean that perform critical ecosystem services indispensible to the economy and ecological resilience of the zone in light of changing climate. In the last several years, the Lower West African region coastline has exhibited elevated levels of climatic stress coupled with recurrent hazards prompted by variability in the parameters. Being an epicenter of climatic hazards with frequent natural disasters attributed partly to the proximity to the ocean, changing temperature and irregular rainfall patterns. The region has long endured huge ecological and economic costs with the repeated displacement of millions of citizens, rising fatalities, and destruction of properties, damages to economies of the individual nations and the natural areas in the process. From the threats posed to coastline buffers given the continual disappearance of mangrove vegetation over large areas of the region. At current pace, the low-lying areas and cities in the region face huge exposures to the dangers of sea level rise and eventual submergence in the near future. For that reason, the enquiry offered a thorough assessment of climate change patterns under a mix scale orientation of temporal-spatial techniques of descriptive statistics and GIS based on secondary data at regional, city and national levels in the Lower West African region.In a spate of over 4 decades, the study area has experienced countless extreme climate change events that are threatening the communities all through the lower coastal lines of the West African region. In the process, the countries in the Southern zone (Nigeria, Ghana, Ivory Coast, Senegal, Togo and Benin) continued to be at the receiving end of increased frequency in natural disasters occurrence with the number of incidents, causalities and affected victims listed in tens to hundreds of thousands and in the millions over a period of 4 decades. The breakdown among the individual countries showed that a group of three countries (Nigeria, Ghana, and Senegal) saw more incidents of natural disasters in terms of frequency, casualties and displaced victims. With that came the mounting risks from torrential rainfall, rising temperature, emissions of GHGs, CO2 and endless flooding in the coastal areas over time. Of great worry in all these, considering its essential ecological role and functions in coastline protection and soil health is the declining pace of remaining mangrove vegetation in acreages and mileages clustered across the region. Despite the evolving patterns in the distribution of mangroves between 1980-2006 and 1980-2000, the size of mangrove vegetation has been dropping from its 1980 level, which in turn creates further exposures to coastline inundation. Compounding the predicament of communities in these nations in the face of climate change risks are the high population growth rates (from 1970s to 2015) of the coastal belt along the Lower West Africa region. Consistent with that trend, is the vast proportion of population encroachment in the areas with lower elevation on the coastline areas where the average altitude of three Southern Nigerian cities (Lagos, Warri South and Port Harcourt) hovered below the others in the region. This resulted in more proliferations of human settlements into reclaimed terrains from the sea that is pushing people further in lower lying fragile areas often on the path of direct hits from rainstorms, sea level rise and heavy coastal inundation that now characterize the common experience of the region in the last decades.The GIS mapping of the trends reveals gradual dispersion of risks induced from the changing climatic parameters. The close spatial proximity of coastline populations in Senegal, Ivory Coast, Ghana, Togo, Benin, and Nigeria to the Gulf of Guinea and the Atlantic Ocean make them easy targets of flooding events from heavy rainfall and eventual submergence in no distant future. Furthermore, the projected climate change trends, also point to continual dispersion of elevated temperature and evidence of harsh weather conditions all through the region. Seeing that the proficiency of GIS mapping was crucial in showing the spatial concentration of mangrove forests, and exposure to coastline hazards in port cities, projected submergence, the risks of low elevation and other climatic stressors clustered in various areas. Spatial analysis highlighted the geographic distribution of natural disaster occurrence and impacts, the patterns of GHG emissions in coastal areas as well as coastline population exposure to climate change across the region in the Lower West African Region in the last several years. Taking a cue from the analysis, the results show the prevalence of climate change risks and impacts in the form of flooding hazards, droughts, greenhouse gas emissions, sea level rise, pollution, environmental degradation and the displacement of citizens. With the impacts attributed to socio-economic and physical elements, the GIS mappings revealed a gradual spreading of climate change hazards under different scales to various areas across the region from Nigeria to Senegal. Using GIS in that way to analyze climate risks at the regional and national level as well as their patterns, advances current knowledge about the importance of climate change index in coastal zone management. This offers a template for analyzing risk exposures and the inherent threats regionally. Given the essence of the coastal belt, the economic costs from climate change induced hazards and the fact that the coastal GDP of nations in the region face projected declines from climatic hazards. The significance of highlighting these predictors did standout as timely efforts. For that, the efficiency of GIS in the enquiry comes from its capacity in highlighting the exposures, scales and spatial configurations of risks and stressors. While efforts are being made by various agencies to address the gravity of extreme climate risks in the region, the paper proffered several solutions ranging from continued use of GIS and the need for advanced early warning systems to the design of a regional climate change index.
5. Conclusions
This research assessed the changing climate parameters in six nations of the Lower West African region with many revealing findings listed as follows. a) the impacts of climate change parameters on the rise; b) mix scale approach quite effective; c) the vulnerabilities to climatic variability linked to many factors; d) coastal and low-lying areas at a high risk; e) mitigation efforts underway in the region.One major finding of importance from the enquiry involves the identification of rising effects of changing climate parameters on the adjoining ecosystem in the study area. In assessing extreme climate problems, the Lower West Africa region has experienced numerous climatic hazards characterized by threats to the delicate ecosystem and teeming population among the countries over the years. For that, the region is fraught with climatic risks given the recurrent surge in extreme weather parameters from Nigeria to Senegal. In these areas of the West Africa region, climate change parameters such as droughts, flooding, storm surge, and elevated temperature and greenhouse gas emissions continue to threaten the surrounding ecology. The distribution of the hazards as manifested by the number of human victims and casualties, economic and ecological costs rose enormously from one era to another. Judging by the most common risks, the outbreaks of epidemics and flooding from 1975 to 2015 occurred with greater frequency. In that period, climatic stressors like the percentage levels of flood and epidemics posed the biggest threats to a quartet of nations (Nigeria, Togo, Senegal and Togo) followed by droughts. From the regional data, the occurrence rates of flood events and the outbreak of epidemic were much larger in Togo at 44-88% compared to Senegal where the levels varied by 28-51%. By 1987-2015, the impacts of natural disasters on the built environment rose significantly, as both Ghana and Nigeria emerged with more hits on the number of people affected. During those years, out of the total of 213 disasters that made landing between 1975 and 2015, over 40 million people were affected in four nations followed by a death toll of 39,067 with majority of that in Nigeria and Togo (at 24,699 and 11,188 respectively). Measuring these risks offers us pathways towards the containment of impending events in the nations at risk through recovery. Identifying these interactions between climatic forces and the built environment considering the incapacity to see their accrued effects in the region stands out as a key contribution to knowledge and theory of human nature interface. Pinpointing the dangers from the climatic parameters (flooding, storm, droughts, temperature and other stressors) to communities given the millions of victims and thousands of deaths from the hazards as shown in the enquiry will help prioritize human safety and preventive measures in future recovery strategies in the region.From the study findings, the applications of mix scale methodology did stand out quite convincingly in helping chart the directions of climate change research in the Lower West African region. Utilizing descriptive statistics and GIS mapping as operational tools under the model added new awareness to regional and nationwide assessment of the impacts of climate change parameters on coastal ecosystems. Considering the ecological and socio-economic significance of the region’s coastal belt, the economic power of coastal cities drives regional markets in the respective nations. For that, the mix scale model did emerge crucial in calibrating the regional climate index over the various years and the scales. This approach was quite valuable in delineating the study location and in classifying the trends, as well as the gathering of information on climate change parameters under ecological, physical and socio-economic indices germane to the region. The other areas of importance in the model center around the design of temporal and spatial profile depicting various climatic hazards, the number of victims, and the identification of the parameters of mangrove vegetation areas impacted by the change. It also outlined changes in the coastal population and economic assets and the variations in climate predictors like temperature, rainfall patterns, and negative externalities made up of CO2 and GHG emissions. This scheme remains vital in serving those undertaking spatial analysis of changing climate parameters, ecosystem change, the impacts, population pressures on coastal areas and the risks. In that way, GIS mapping was essential in highlighting the vast concentration of climatic risks along low-lying coastal areas and port cities across the region and the ecological dangers of mangrove declines and CO2 emissions and the scale of their spread as a preamble towards effective coastal zone planning and climate change mitigation. Highlighting the spreading of climatic hazards and the risks from the various parameters in that form are quite essential in the enactment of efficient mitigation measures and novel strategies to protect fragile ecosystems along low-lying areas in the West African region. The practical applications of a mix scale approach involving mappings and the compilation of climate change index, as investigative tools, therefore enriches our understanding of the vulnerability of the Lower West African region’s ecosystem as well as the dangers facing the nations and their cities.The socio-economic and physical elements situated within the larger climate change parameters including coastal population growth, economic prosperity, and physical elements of elevation, fluctuation in temperature and precipitation and CO2 emission are very essential in assessing the factors fuelling vulnerability. With the large metro areas in the coastal belt accounting for over 50% of the GDPs in the region, its capacity as vibrant economic hub for distribution, exchange and the employment opportunities draws in large influx of people repeatedly year after year to their peril. Notwithstanding the physical attributes of these areas as low-lying within lower elevations, the coastal counties of the region from Nigeria to Senegal saw unprecedented population growth rates that hovered between high triple and double digits rates from 1991 to 2011. Accordingly, Nigeria not only saw increases in coastal populations from Akapbuyo to Warri South in the Niger Delta and parts of Lagos port cities, but population figures along those coastlines went from 1,838,544 to 2,955,473 and 3,472,910. The capacity of booming economic activities and high tech infrastructure in the areas of shipping, oil, and gas in the last decades fuelled population increases therein. Some of these cities and those in other countries risk full disappearance to the ocean over time from climate change pressures. The close proximity to the paths of extreme weather events like rising temperature, heavy precipitations, coupled with threats of sea level rise from the Atlantic Ocean, raises the scale of danger for communities in the region. In presenting this, the enquiry not only reaffirmed the significance of socio-economic and geo-physical factors in the region’s climatic variability index, but also it showed the way which ecosystem could be affected by different stressors comprising of increases in temperature and rainfall, storm surge, population increases, and other factors threatening communities. Pointing out these linkages specifically considering the exclusion in the other studies inserts a major policy issue onto the frontline of coastal zone planning. Without such in-depth analysis, there would not be new insights on how climate change parameters influence the vulnerability of coastal communities and their adjoining environments. Given the focus on climatic predictors, the outcome herein will influence regional and national responses among decision makers to climatic hazards stressors based on the assemblage of various predictors and the index. While this remains essential to the strengthening of decision-making by containing activities that trigger the interactions of stressors and the built environment, it will also increase knowledge of unfamiliar risk elements in the region.One key thing of great importance in this study deals with the increasing risks exposures to low lying areas in the coastal belts of the Lower Western African region. Being an area endowed with biodiversity, agriculture and mangrove ecosystem and economic fortunes that drive commercial operations on the coast. The coastal belt nations known for their growing metro areas and low-lying shorelines share a high vulnerability to erosion and rising sea level. The area remains at the receiving end of climate change induced hazards. Considering the threats of dangerous rainstorm incidents, low-lying areas like Abidjan, San Pedro, Lagos and Port Harcourt remain susceptible. From the intensity of climatic stressors, tidal waters and surging waves would rise and undermine economic activities, infrastructure and communities. Against that background, the coastal GDP for Ghana and Togo could fall by over 50% followed by close to half a billion dollar decline in Nigeria. In these places, the threats to agriculture remain alarming since coastline farming, based on the size of agricultural lands involves wide ranging exposures to farm assets. Furthermore, coastal cities in the region all share projected exposure of their populace and monetary assets to obliteration through sea level rise. For that, in the year 2100, of the set of cities marked out, the port cities of Abidjan and Lagos top the list with many people exposed to coastal hazards and billions of dollars in liabilities. In addition to these, low-lying cities like Aneho and Okrika are also in danger of disappearance. Stressing these threats along with the dangers of climatic hazards to the economy and environment in low-lying fragile coastal ecosystems like the study area stands out as a key contribution valuable to policy, and rehabilitation measures in vulnerable areas. The policy implications stems from that fact in the absence of this assessment and assemblage of the stressors in this enquiry, decision makers would have no grasp of the level to which climatic parameters threaten the assets of low-lying cities. This could lay the ground for thoughtful dialogue between developers, environmental regulators and community stakeholders who regularly call for real engagement in coastal zone environmental planning in the at risk areas of the study area. In that way, the study injected an environmental protection approach vital in spotting the risks in fragile environments like low-lying areas pushed beyond their capacities. Highlighting these threatening indicators in view of the intensity of climatic stressors and the anticipated damages to economic, ecological and farm assets along port cities and major metro areas has major upsides for decision-making and community safety.Bearing in mind that the climate change threats ravaging the six nations of the Lower follows a transboundary trajectory with no respect for jurisdictional boundaries nor linguistic and policy orientations, as the study has shown. Several initiatives have gone into effect by regional and multilateral organizations to mitigate the exposures to climate change induced hazards in the study area. These encompasses training program on climate disaster reduction, coastal management strategies, land use framework and innovative hydro-meteorological program across the region. Seeing the commitment of the organizations involved in aid assistance towards regional climate hazards mitigation and safety, the implementation of those programs provides a model for carrying out comparable activities in areas facing recurrent barrage of climate change induced disasters. Because the processes and the execution of proposed tasks involves collaboration with international groups, and foreign regional economic blocks, the experience gained offers a roadmap to decision makers in the Lower Western African region in evaluating the level to which besieged areas from climatic stress can move towards recovery through these initiatives. Building from such schemes and the outcomes, policy makers will be in better position to assess the prospects and problems encountered over time by assessing their impacts with steady readiness. Being a stride towards mitigation and climate change adaptation, the organizational aspect of regional ventures involving multilaterals, the host nations in the study area, the steps and the tasks for various parties, the anticipated outcomes and deliverables are major steps in the right direction in climate change policy in the region. Cognizance of these developments as indicated in the paper augments the ability of managers in tracking the efficiency of joint initiatives between multilaterals and regional agencies in climate change mitigation. The expectation is that it would enable regions and the nations therein and communities design suitable measures for refining prevailing approach. Considering the sincerity of the multilaterals to address climate change dangers across the nations, abundant chance remains in place for optimizing climate mitigation infrastructure and entities in the region. As a move geared at mitigation, highlighting such ventures enhances the preparedness of managers in times of emergency with benefits to regions, cities and in the search for collaborative actions for ensuring climate adaptation in the study area.Taking into account the growing threats from climate change parameters in the region country and the vast socio-economic and ecological significance of the coastal belt especially and the problems posed by recurrent hazards and vulnerabilities of the low-lying areas from climactic stress and the outcome of this enquiry. The decision makers and planners in the region and different countries and cities will be hard pressed in the near future to demand quick answers to several burning queries that are germane to climate change. The questions are as follows: How will climate change parameters affect hydrology? What scale will climatic stress assume? What would the spatial dispersion of climate parameters be like in the region? What will be the key socio-economic and physical elements driving climate change? From the designing of these queries, there are numerous opportunities in all of that for researchers and decision makers to refocus the approach on regional climate change mitigation with guidelines stressing sustained mitigation, community safety and recovery. This will help the region and nations optimize their respective obligations to climate change mitigation with efficient outcomes in the near future.
References
| [1] | United States Agency for International Development (USAID). (2014 July a). Climate Change and Water Resources In West Africa: Coastal Biophysical and Institutional Analysis. Washington, DC: USAID, 1-87. |
| [2] | Brown, S. (2011). Sea Level Rise and Impacts In West Africa 2000-2100. South Hampton, UK: University of South Hampton. |
| [3] | Sultan, B. (2016 August). Agriculture In West Africa in The 21st Century: Climate Change and Impacts Scenarios and Potential For Adaptation. Frontiers In Plant Review. 7:1262:1-20. |
| [4] | International Union For the Conservation of Nature and Natural Resources (IUCN). (2016). Regional Assessment On Ecosystem Disaster Risk Reduction and Biodiversity In West and Central Africa. OUG, Burkina Faso: IUCN, 1-60. |
| [5] | United States Agency For International Development (USAID). (2012 January). Climate Change Adaptation In Western Africa. Washington, DC: USAID. |
| [6] | World Bank. (2017a). Voluntary Relocation For West Africa’s Coastal Communities; Western Africa Coastal areas Management Program: Washington, DC: World Bank, Knowledge Sheet 8. |
| [7] | World Bank. (2017 b). Coastal Natural Capital and the Economics in the Coastal Zone. Washington, DC: World Bank, Knowledge Sheet 9. |
| [8] | World Bank. (2015 March a). Strengthening Regional Collaboration and Integration. Washington, DC: World Bank, Knowledge sheet 1. |
| [9] | World Bank (2015 March b). Protecting The Regions Natural Resources; West African Coastal Areas Management Program. Washington, DC: World Bank, Knowledge sheet; 4. |
| [10] | International Telecommunication Union. (2015 November December). Ghana’s Vulnerability to Climate Change. ITU News Magazine. 6. |
| [11] | World Meteorological Organization. (WMO). (2014). The Climate In Africa 2013. Geneva, Switzerland: WMO, Observing and Information Systems Department. 1-28. Retrieved On 25th August 2017 From http://www.wmo.int/pages/prog/wcp/wcdmp/documents/StatementAfrica.pdf. |
| [12] | IRIN. (2012). Worst Flooding In Decades Report From IRIN Nigerian Heavy Flooding. Retrieved On 25th August 2017 From http://www.irinnews.org/news/2012/10/10-0. |
| [13] | United Nations. (November 2012). Nigeria: Humanitarian Dashboard - Floods (as of 26 Nov. 2012). UN Office For Coordination of Humanitarian Affairs. New York, NY: OCHA. 1-2. |
| [14] | Serdecyzny, O. (2015 December). Climate Change Impacts In Sub Saharan Africa: From Physical Changes to Their Social Repercussions. Regional Environmental Change. 15:8. |
| [15] | Parker, H. (2017). Did Climate Change Have a Role In West African 2002 Floods. Reading, UK: University of Reading. |
| [16] | Premium Times. (2014 January). Nigeria Loses 20 Percent Of Agric Produce to Climate Change. Premium Times. 1-2. |
| [17] | Davies, R. (2014 July). 1 Dead 6000 Affected By Flood In Jomoro Ghana. Flood List. Retrieved On 25th August 2017 From http://floodlist.com/africa/1-dead-floods-jomoro-ghana. |
| [18] | IRIN. (2014 a). Ivorian Floods Highlights Disaster Preparedness Shortcomings. Retrieved On 25th August 2017 From http://www.irinnews.org/news/2014/07/04. |
| [19] | Ighobor, K. (2013). Storms Stemming The Tide of West Africa. New York, NY: United Nations African Renewal. Department of Public Information. Retrieved On 25th August 2017 From https www.un.org/africarenewal/web-features/floods-stemming-tide-west-africa. |
| [20] | Fagotto, M. (2016). West Africa Being Swallowed by Sea. Foreign. Policy Magazine. 1-10. |
| [21] | World Bank Group. (2015 march c). The Effects of Climate Change On Coastal Erosion In West Africa. Washington DC: World Bank, Knowledge sheet 6. |
| [22] | World Bank Group (2015March d). Managing Coastal Risks In West Africa. Washington, DC: World Bank, Knowledge sheet 3. |
| [23] | University of Pennsylvania. (1999). Nigeria: IRIN Special Report on Environmental Challenges. UN Office For Coordination of Humanitarian Affairs. African Studies Center, 1-2. Retrieved On 25th August 2017 From http://www.africa.upenn.edu/Newsletters/irinw_81199.html. |
| [24] | IRIN (2009 May). Coastal Populations at Risk as Climate Changes. Retrieved On 25th August 2017 From http://www.irinnews.org/feature/2009/05/20. IRIN, Nairobi. |
| [25] | IRIN (2015 November). Rising Seas Ruining Lives in Togo. Retrieved On 25th August 2017 From http://www.irinnews.org/news/. |
| [26] | IRIN (2014 b).Coastal Erosion Threatening to Wipe Out Parts of Cotonou. Retrieved On 25th August 2017 From http://www.irinnews.org/report/80126/benin-coastal-erosion-threatening-wipe-out-parts-cotonou. |
| [27] | USAID (2014 b May). West Africa Regional Workshop On Mangroves and Climate Change; Final Report at Elmina Ghana. Washington DC: USAID, 18-22 May, 1-30 |
| [28] | Perret, C. (2008 January). Atlas On Regional Integration In West Africa. Environment Series: Climate and Climate Change. Paris France, OECD: 1-24. |
| [29] | Oyebade, B.A. (2010). Quantitative Review and Distribution Status of Mangrove Forest Species In West Africa. African Research Review. 4:2: 80-89. |
| [30] | Merem, E. C. (2017 a September). Assessing Variations in Climate Change Parameters In The Lower West African Region. Proceedings of the 14th International Symposium on the Recent Advances in Environmental Health. Jackson, MS. |
| [31] | Riede, J. (2016). What is On The 5th IPCC Report for West Africa. In Adaptation to Climate Change and Variability in Rural West Africa, J.A. Yaro and J. Hesselberg (eds.), Switzerland, Springer International Publishing, DOI 10.1007/978-3-319-31499-0_2. |
| [32] | World Bank. (2017c). Climate Change Portal. D.C: Washington: World Bank Group. |
| [33] | Knippertz, Peter. (2015). The Possible Role of Air Pollution In Climate Change In West Africa. Nature Climate Change. 5:9:815-822. |
| [34] | Unah, L. (2017 May). Floods From Climate Change Are Ravaging Farms In Nigeria. New York, NY: Global Citizens. |
| [35] | Olaide, Aderoju. (2014 October). Impacts of Urban Land Use Change On Flood Events In Warri Delta State, Nigeria. Journal of Environmental Science, Toxicology and Food Technology 8:10:1:37-45. |
| [36] | Makini, B. (December 2015). Climate Change Coastal Erosion Threatens Senegal West African Tourism. The Africa Report. -1-3. |
| [37] | Barbière, J. (2012). Coastal Erosion Major Threat to West Africa. Paris, France: UNESCO-IOC and RTCC.org. |
| [38] | Niang I. (2012). Coastal Erosion Major Threat to West Africa. Retrieved On 6th June 2017 From http://www.climatechangenews.com/2012/01/26/coastal-erosion-major-threat-to-west-africa/. |
| [39] | Merem, E. C. (2012a). Using GIS to Assess the Contributions of Farming Activities to Climate Change in the State of Mississippi. British Journal of Environment and Climate Change, (2)2, 1-15. |
| [40] | Merem, E. C. (2012b). Using GIS and Climate Risk Information Systems to Analyze the Vulnerability of Coastal Counties in Louisiana and Mississippi. Resources and Environment. 1:1: 1-18. |
| [41] | Merem, E. C. (2012c). The Applications of Geo-Info Systems to Gauge The Susceptibility of Coastal Areas in Louisiana and Mississippi. American Journal of Geographic Information Systems. 1:3: 46-65. |
| [42] | Merem, E. C. (2006). GIS and Remote Sensing Applications In The Assessment of Change Within a Coastal Environment in the Niger Delta Region of Nigeria. International Journal of Environmental Health and Public Health. 3:1: 98-106. |
| [43] | Merem, E. C. (2017b). Assessing Ecosystem Liabilities of Oil and Gas Activities in Southern Nigeria. Public Health Research. 7:1: 3-26. |
| [44] | Merem, E. C. (2017c). Techniques of Remote Sensing and GIS as Tools for Visualizing Impact of Climate Change-Induced Flood in the Southern African Region. American Journal of Climate Change. 6: 306-327. |
| [45] | Merem, E. C. (2016). Coupling GIS and Remote Sensing Techniques for Coastal Zone Disaster Management: The Case of Southern Mississippi. Geoenvironmental Disasters, 3:25. |
| [46] | Merem, E. C. and Twumasi, Y. A. (2007). GIS Applications in Global Environmental Protection: The Case of Environmental Monitoring of Fossil Fuel Emission From Oil and Gas Activities in Africa. World Resources Review, 19:3: 657-680. |
| [47] | Brown, O. (2008). Climate Change: A New Threat to Stability in West Africa Evidence From Ghana and Burkina Faso. African Security Review. 17: 3:39-57. |
| [48] | World Bank (2012). The Future of Water In African Cities: Why Waste Water? Washington, DC. World Bank Group. |
| [49] | United Nations. (2009). Floods Affect 600,000 people across West Africa, UN Reports. New York, NY: UN News Center. Retrieved On 25th August 2017 From http://www.un.org/apps/news/story.asp?NewsID=31978#.WkMpMN-nHIU. |
| [50] | Joiner, E. (2012 February). Climate Change and African Political Stability: Vulnerability to Climate Change In West Africa: Adaptive Capacity In the Regional Context. Austin, TX: Robert Straus Center, UT Austin, 1-41. |

 Abstract
 Reference
 Full-Text PDF
 Full-text HTML