-
Paper Information
- Paper Submission
-
Journal Information
- About This Journal
- Editorial Board
- Current Issue
- Archive
- Author Guidelines
- Contact Us
Journal of Safety Engineering
p-ISSN: 2325-0003 e-ISSN: 2325-0011
2017; 6(2): 29-39
doi:10.5923/j.safety.20170602.02

Perception Differences between Contractors and Owners Regarding Drivers of Construction Safety
 Abstract
 Reference
 Full-Text PDF
 Full-text HTML
Elyas Jazayeri, Huang Liu, Gabriel B. Dadi
Department of Civil Engineering, University of Kentucky, Lexington, KY, USA
Correspondence to: Elyas Jazayeri, Department of Civil Engineering, University of Kentucky, Lexington, KY, USA.
| Email: |  |
Copyright © 2017 Scientific & Academic Publishing. All Rights Reserved.
This work is licensed under the Creative Commons Attribution International License (CC BY).
http://creativecommons.org/licenses/by/4.0/

Perceptions about the impact of practices on construction project safety can vary based on the role of the organization on the project. The difference between contractors and owners on what is perceived as important could have an impact on the safety performance of the project. The authors have developed an Operational Excellence Model (OEM) to assess the degree safety related practices are employed on a project. The OEM contains 12 main safety drivers chosen by construction safety experts. In order to evaluate the perception difference, a questionnaire was developed and the data was analyzed using an Analytical Hierarchy Process (AHP). The primary contribution to the body of knowledge is evaluating the perceptions of contractors and owners about the influence that specific practices have on construction safety. The results show that three safety drivers are significantly different between contractors and owners, which are learning organization, training and competence, and owner’s role, which could lead to poor safety outcomes in those areas.
Keywords: Construction Safety, Operational Excellence, Operational Excellence Model (OEM), Analytical Hierarchy Process (AHP), Safety Perception
Cite this paper: Elyas Jazayeri, Huang Liu, Gabriel B. Dadi, Perception Differences between Contractors and Owners Regarding Drivers of Construction Safety, Journal of Safety Engineering, Vol. 6 No. 2, 2017, pp. 29-39. doi: 10.5923/j.safety.20170602.02.
Article Outline
1. Introduction
- The construction industry is one of the most hazardous industries in the United States (Edwards and Nicholas, 2002). Although the trend of construction accidents has recently decreased (Huang and Hinze, 2006), there is still room for improvement. Construction accidents account for 30-40% of all fatalities worldwide (Sunindijo and Zou, 2011) and 20% of all fatalities in the United States (Center of Fatal Occupational Injuries, 2003). The United States is third in industrialized countries in terms of an occupational fatality rate (Georgine et al., 1997). In terms of cost, construction accident costs vary between 7.9% to 15.0% of the total project cost in non-residential projects (Everett and Jr, 1996). In medical case injuries, the indirect cost of injuries could rise to 20.3 times of the direct cost of injuries (Hinze and Appelgate, 1991). Both researchers and practitioners seek improvements in safety, but unsafe conditions continue to plague the industry. Traditionally, construction safety is the sole duty of the prime or general contractor (Tymvios and Gambatese, 2015). This claim is further supported by the Occupational Safety and Health Administration (OSHA), which states that employers are responsible for safe work place of their employees (Hinze and Wiegand, 1992). The other problem that has created a gap between safety responsibilities of parties involved in construction is conventional contracting method such as design-bid-build (Tymvios and Gambatese, 2015). Owners traditionally are not involved in the construction process. However, owners are becoming more active and participating in safety management issues through each phase of the project (Huang and Hinze, 2006), which according to Jazayeri and Dadi (2017), recently, safety management systems have adopted owner’s role as part of their core elements. According to Huang and Hinze (2006), owners can have a positive influence on safety performance of the project. Subsequently, investigating their perceptions regarding construction safety and comparing that with contractors is a valuable exercise. Safety perception has different definitions. For example, Griffin and Neal (2000) defines safety perception as “how workers view safety related policies, procedures, and practices and other workplace attributes concerned with safety”. Reese and Eidson (2006) correlates safety perception to “accident rates, quality of the safety climate, worker’s working attitude, management and equipment, organizational culture and management support”. In the past, owners and designers tried not to involve and interfere in construction safety to avoid liability. Recently, all parties have realized that to achieve a zero accident goal they should all dedicate resources (Huang and Hinze, 2006). Having uncertainty about safety roles in construction codes and regulations (Toole, 2002) could lead to different perceptions in parties about construction safety. Workers react to hazards the way they perceive hazards (Kahneman, 1982), thus, their perceptions effect their decision making process which could lead to injuries (Rundmo, 1995). However, management perceptions and worker perceptions about safety and risk is not always the same (Gilkey et al., 2011) (Pungvongsanuraks and Chinda, 2010), but recognizing the safety perception in upper management is crucial due to their decision making power. Safety perception among workers research have been conducted in the past, but there is lack of research about safety perceptions among parties involved in construction. The primary objective of this research is to discuss safety perceptions between owners and contractors regarding safety procedures and practices based on the Operational Excellence Model (OEM) developed by the authors (Liu et al., 2015).
2. Operational Excellence
- The Operational Excellence (OE) concept has been used in a variety of industries to improve execution and performance of the work across the organization. The concept has not been defined well for the construction industry. One of the main reasons is the uniqueness of the industry due to its dynamic and temporary work environment.This concept leads organizations to desired outcomes such as performance, safety, quality. The first research on Operational Excellence (Operational Effectiveness) was by Porter (Porter and Advantage, 1985). Bigelow (2002) believes that operational excellence needs three pillars; establishing requirements, communicating requirements, and assessing requirements. According to (Liu et al., 2017), creation of a culture focused on safety and operational excellence gives the basis for progression and sustainable improvement in safety performance. According to Gleich (2008), OE is “the dynamic capability to realize effective and efficient core process in the value creation chain utilizing technological, cultural, and organizational factors in an integrative way and based on the respective strategy”. Another OE definition from Sutton (2012) states that it focuses on maximizing the value that being delivered to the customer through leadership power, power of people, and the use of best practices. Operational excellence can be defined and interpreted in each industry. Basu (2004) defines operational excellence as “a broader program of improving and sustaining business performance in which quality management is embedded”. According to Jaeger et al. (2014), “Most Operational Excellence literature is dominated by pursuit if activities to strip away waste and nonvalue-added activities to attain efficient and frictionless process”. Based on all these definitions mentioned in this section, the goal of operational excellence is to engage all the members of the organization to do the right thing, the right way, every time, and even no one is watching. Subsequently, a model of OE for construction project safety helps project participants gauge their holistic level of commitment to safe outcomes.
3. Operational Excellence Model
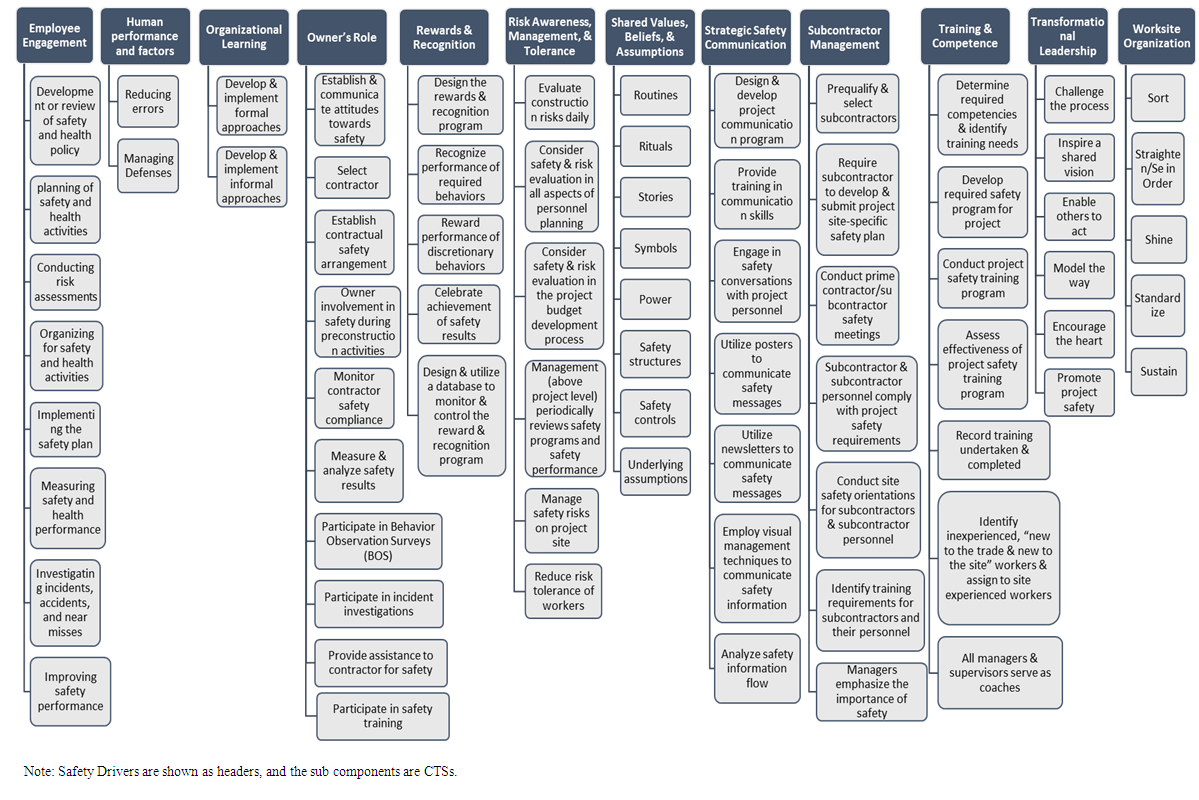
- The Operational Excellence Model (OEM) is based on the Six Sigma Critical to Quality (CTQ) tree concept (Van Aartsengel and Kurtoglu, 2013), since it is used to break broad objectives into smaller, quantifiable elements. To achieve the Operational Excellence Model (OEM), the research team conducted a two-step validation method. After having eight face-to-face internal review session and webinars with an industry research team, a preliminary model was produced. Outside subject professionals, Construction Industry Institute (CII) member companies, and Construction Users Roundtable (CURT) member companies provided additional input through a survey. The extensive survey of the importance of the contents of the model helped validate the conceptual model. Details about this process can be found in Liu et al. (2015).The model has four different levels. The first level is comprised of Safety Drivers (SD) that are used for evaluating the performance of safety program. The next level is Critical to Safety (CTS), which are specific elements to define their corresponding SDs. The third level is Critical to Expectation (CTX), which are behaviors and processes that should be applied and implemented to achieve its CTS. The basic level of the model is Specifications/Measurements (S/M), which help quantify the level of achievement in the corresponding CTXs. The last version of the Operational Excellence Model (OEM) includes 12 SDs, 75 CTSs, 256 CTXs, and 293 S/Ms. Figure 1 below shows the list of SDs and their corresponding CTSs (CTXs and S/Ms are not included for space limitations, but can be seen in full detail in Maloney et al. (2016)).
4. Research Method
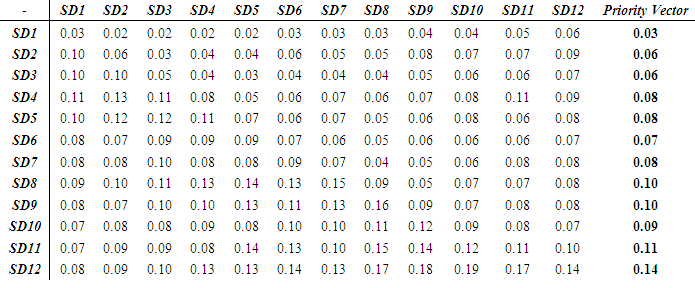
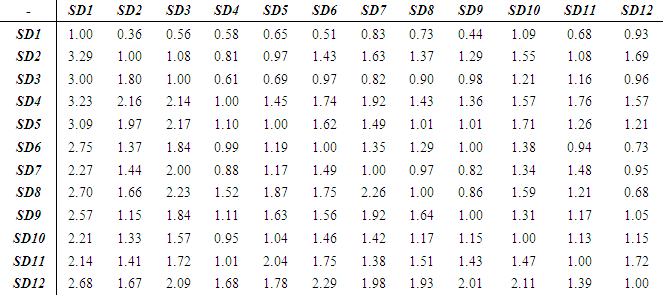
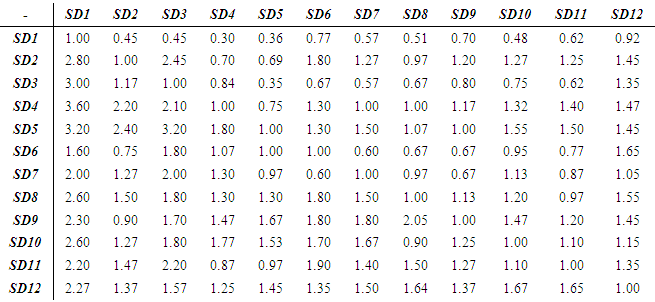
- The research team considered several methods to establish the weight and importance of the contents of the model. The authors decided to use an Analytic Hierarchy Process (AHP) approach as the data collection is straightforward, the analysis is simple, it is an ASTM standard, and its widespread use in publications (Steuer and Na, 2003). A statistical analysis on the results of the AHP follows. AHP ApproachThe critical problem in decision making is how to find priorities for elements based on their importance (Saaty, 1977). To make judgments easier for participants in this research AHP was utilized. AHP has been used widely according to Vaidya and Kumar (2006). Its applications have been conducted on selection, evaluation, benefit-cost analysis, allocations, planning and development, priority and ranking, decision making, forecasting, and medicine related fields. The aim of this research is to identify the different perceptions between contractors and owners about construction safety. There are many publications that have utilized a similar “priority and ranking” category approach. As an example, Alidi (1996) used AHP method to measure the initial viability of industrial projects. Arbel and Vargas (1993) used AHP in preference simulation and performance programming. Hafeez et al. (2002) have used AHP to determine key capabilities of a firm. Jain and Nag (1996) developed a model which was the integration of qualitative and quantitative variables via AHP. Integration of AHP with other approaches is the other feature which makes this method attractive for researchers and decision makers. Weber (1993) used AHP to automate a machine shop, so they modified the AHP to be compatible within a manufacturing environment and integrated into decision support software for microcomputers.AHP should be developed and applied step by step. According to Zahedi (1986), using AHP in decision making problems includes four steps:Ÿ Step 1- Breaking down the elements to develop an AHP matrixŸ Step 2- Collect the input pair wise comparison data to be computedŸ Step 3- Use the “eigenvalue” method to calculate relative weights of elementsŸ Step 4- Aggregate relative weights to have a set of weighted elementsAccording to Carlsson and Walden (1995), AHP has its own strengths and weaknesses like many other approaches. Some strengths are:Ÿ AHP collects the elements under the umbrella of one single model.Ÿ The use of pairwise comparison allows AHP users to find the relative importance of criteria and then see the relative contribution of elements to the criteria.Ÿ Inconsistency measure allows AHP users to make sure that they are aware of the importance of any inconsistent judgments. Weaknesses of AHP include:Ÿ AHP users have to rely on their experiences to make a decision on pair wise comparisons. Respondents in this survey included safety experts from large, multinational organizations. Thus, this weakness should be minimized. Ÿ A starting reference point is essential in AHP because it could have impact on user’s decisions. In this study, the intent and method of the procedure and detailed descriptions of the CTS were presented to the respondents. The thorough orientation language should allow the respondents sufficient information to formulate appropriate responses.
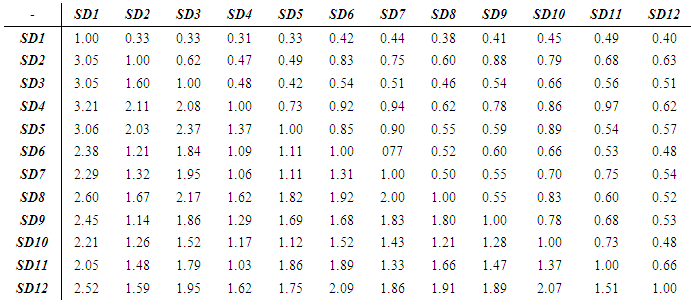
 | Table 1. OEM Structure |
5. Analysis and Findings
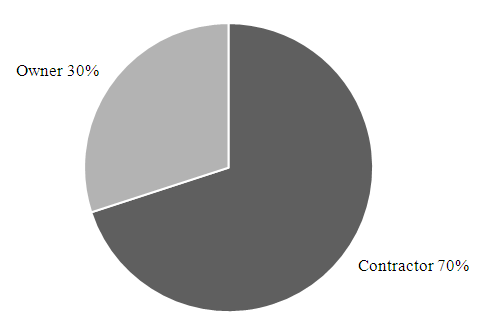
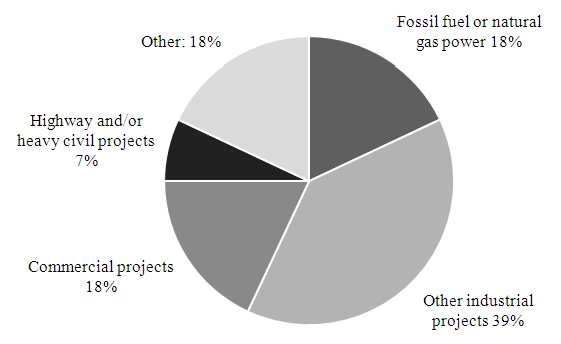
- Survey StructureThe objective of the study is to distinguish the perception of owners and contractors regarding construction safety. This was achieved by collecting data via an electronic survey. The survey was hosted by an online survey platform called Qualtrics. The survey consisted of 66 pair-wise questions followed by some demographic questions. The pairwise comparisons asked respondents to evaluate each safety driver against the other safety drivers. For an example, one of the survey questions is “How much more valuable is Employee Engagement than the Owner’s Role?” Response options range from equal to strongly important based on a 1 to 5 scale. If a respondent assigns 1 to the example question, it means the Employee Engagement safety driver is as important as the Owner’s Role. If a respondent assigns 5 to this question, it means that the Employee Engagement safety driver is extremely more important than the Owner’s Role. Data out of each response goes to an AHP matrix template in Excel to perform data analysis. All 66 questions were shown to respondents in a random order to eliminate any bias or random responses. A consistency ratio calculation confirms this claim. This calculation is outlined in a later section of this paper. The target group for this survey were safety related positions such as safety managers and safety supervisors in owner and contractor firms. Demographic infoThe survey was deployed to Construction Industry Institute (CII) member organizations, Construction Roundtable Organization (CURT) member organizations, and to other employees from the research team companies. Demographic questions such as job title, industry sector, and other project details were asked. Figures 1 and 2 show the number of responses divided into their classification (Owner v. Contractor) and their sectors respectively.
 | Figure 1. Firm Type |
 | Figure 2. Firm Sector |
|
|
|
|
|
|
|
|
|
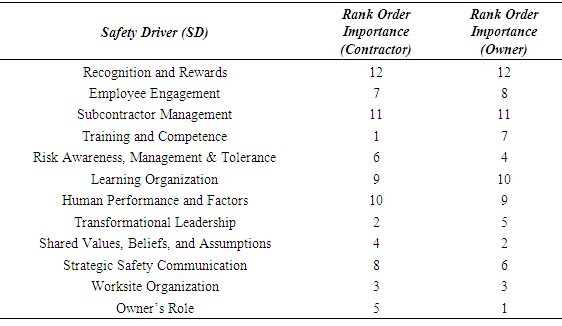
6. Conclusions
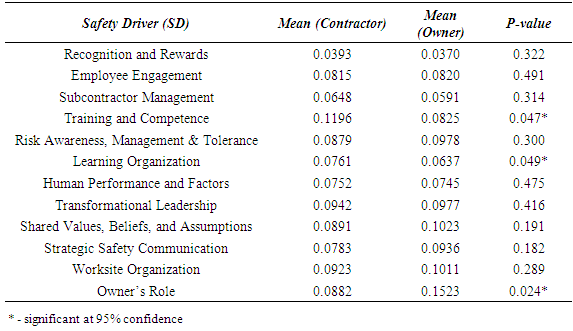
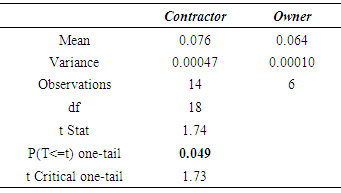
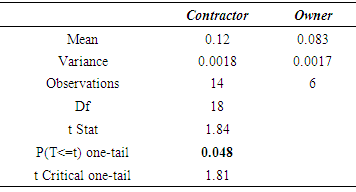
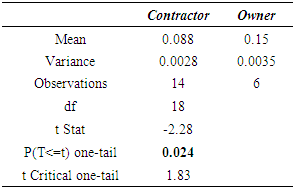
- The primary objective of this research is to investigate perceptions between owners and contractors regarding safety procedures and practices based on an Operational Excellence Model (OEM). The authors presented the concept of Operational Excellence for construction project safety and outlined a weighting process of the model through an Analytic Hierarchy Process (AHP). The participants in the AHP weighting procedure were safety experts in both contracting and owner organizations, thus providing their respective opinions on how impactful certain practices are on improving construction safety. A statistical analysis on their weights provided feedback on the perception differences between owners and contractors.Based on the statistical procedure, three drivers were found to have significant differences (p <0.05) in their perceptions of the impact that they have on safety between owners and contractors, while nine did not have statistically significant differences. The nine drivers that were not found to be different were Rewards and Recognition, Employee Engagement, Subcontractor Management, Risk Awareness, Human Performance, Transformational Leadership, Shared Values, Communication, and Worksite Organization. The three significantly different drivers were Organizational Learning, Training and Competence, and the Owner’s Role.Although there were no differences found between owners and contractors, they both place little value in the role that rewards and recognition programs have on safety outcomes compared to the other drivers. Based on the data, it seems that owners and contractors do not believe that rewards and recognition serve as a motivator towards desired safety behaviors. A survey of site workers is needed to understand motivating factors for safe behaviors to see if there is congruence with this finding.Owners and contractors agree that an organized jobsite and having shared values, beliefs, and assumptions have a stronger impact on safety than the other drivers. The former is a strong behavior based safety element, while the latter is a measurement of a project’s safety culture. While it may seem trivial, having a clean, organized, and ergonomic project can help avoid the frequent subconscious incident. For instance, one working at height should consciously be aware of the need for fall protection. However, a project with multiple extension cords loosely draped across a frequently travelled corridor causes a subconscious tripping hazard. In addition, it is important that labor and management share similar strong values, beliefs, and assumptions about safety. When this occurs, a resilient safety culture drives predictable, desirable, and safe behaviors on the jobsite. Safety is no longer part of the job; it is the job.Contractors believed organizational learning was more important to influencing safety than owners did. Organizational learning is critical process towards continual improvement of an organization. An organization should seek to collect information such as lessons learned and establish a feedback mechanism that allows successes to be repeated and failures to be avoided. While owners are likely not involved in a contractor’s organizational learning program, they should encourage, incentivize, and participate where possible to help the contractor improve in all business outcomes. Ultimately, with continuous improvement, both owners and contractors will see projects delivered faster, less expensive, higher quality, and safer, which benefits all parties.Contractors also ranked training and competence higher in regards to its impact on safety than owners did. Similar to organizational learning, the responsibility of training and ensuring competence of construction workers falls on the contractor. However, if workers are not prepared to do their jobs, project performance can suffer including safety. While owners may not have the expertise to conduct training and competency programs, they can assess them in selecting and evaluating a contractor.Finally, owners believe that they can have an impact on safety, more so than contractors believe the owners can. From the owner’s responses, this is an encouraging finding as the owner has the most influence on the project given their position as financier. A future research effort to study the impact of owner practices and procedures from the contractor’s perspective could help in understanding why the contractor’s responses were lower. Hopefully, the contractors see owner participation in safety related issues as an opportunity to improve safety and shared commitment to safety.In summary, the process of weight and determining the perceptions that owners and contractors have on safety related policies, practices, and procedures yielded some interesting findings. The results of which should help each party understand what the other sees as most impactful on safety. With this information, practitioners can be aware of these differences and seek to understand and agree on what practices should be in place to improve construction project safety performance.
ACKNOWLEDGEMENTS
- The authors wish to thank the Construction Industry Institute (CII) and its members through Research Team 317 for their support and guidance with this research.