-
Paper Information
- Paper Submission
-
Journal Information
- About This Journal
- Editorial Board
- Current Issue
- Archive
- Author Guidelines
- Contact Us
Journal of Safety Engineering
p-ISSN: 2325-0003 e-ISSN: 2325-0011
2016; 5(2): 27-35
doi:10.5923/j.safety.20160502.01

Energy Dissipation Measures on a Hockey Helmet across Impact Locations
 Abstract
 Reference
 Full-Text PDF
 Full-text HTML
Carlos Zerpa1, Stephen Carlson1, Siamak Elyasi2, Eryk Przysucha1, Thomas Hoshizaki1
1School of Kinesiology, Lakehead University, Thunder Bay, Canada
2Department of Chemical Engineering, Lakehead University, Thunder Bay, Canada
Correspondence to: Carlos Zerpa, School of Kinesiology, Lakehead University, Thunder Bay, Canada.
| Email: |  |
Copyright © 2016 Scientific & Academic Publishing. All Rights Reserved.
This work is licensed under the Creative Commons Attribution International License (CC BY).
http://creativecommons.org/licenses/by/4.0/

The objective of this study was to examine differences across hockey helmet impact locations on energy dissipation characteristics when mounted on a NOCSEA headform attached to a mechanical neck and drop carriage. Linear triaxial accelerometers mounted inside the headform were used to compute the energy dissipation across helmet impact locations. The amount of energy dissipated was calculated for five helmet impact locations including the front, front boss, side, rear boss, and rear. Inferential statistical analysis revealed significant differences in energy loading, F(4,21)=19.727, p<0.005, η2 = 0.78 and energy unloading, F(4,21)=56.793, η2 = 0.91 p<0.005 across impact locations. There were, however, no significant differences in the amount of energy dissipated across helmet impact locations, F(4,21)=2.033,p=0.126. This outcome suggests that the hockey helmet mounted on a headform behaves differently on how it loads and unloads energy across impact locations, but appears to behave similarly across impact locations on the amount of energy dissipated due to an impact. These results may have implications on helmet testing and design because they shed light on the use of another measurement technique to assess the effectiveness of hockey helmets in minimizing risk of head injury due to an impact.
Keywords: Concussion, Helmet Impact System, Energy Dissipation, Hockey Helmet
Cite this paper: Carlos Zerpa, Stephen Carlson, Siamak Elyasi, Eryk Przysucha, Thomas Hoshizaki, Energy Dissipation Measures on a Hockey Helmet across Impact Locations, Journal of Safety Engineering, Vol. 5 No. 2, 2016, pp. 27-35. doi: 10.5923/j.safety.20160502.01.
Article Outline
1. Introduction
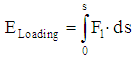
- Hockey is a fast and aggressive sport with high risk of injury [1]. The elevated risk of injury has lead to the development of new equipment technologies for injury prevention [2]. In the sport of hockey, helmets serve as the primary form of head protection [3]; however, injuries to the head and brain remain to be very common at the professional and amateur levels [4]. These types of injuries can be very severe in nature as they may lead to neurological dysfunction and in rare cases, death [5]. In the sport of hockey, helmets are designed to best protect the head against traumatic brain injuries (TBIs) such as skull fractures and subdural hematomas [3]. These severe injuries are caused by sudden accelerations and decelerations on the head and brain, resulting from mechanical impacts [6]. Designing a hockey helmet to prevent head injuries, however, involves many tradeoffs between performance, comfort, and appearance [7], making helmet design a difficult task to master. Even since the mandatory wearing of helmets, head brain injuries continue to increase frequently in the sport of hockey. This increase in the frequency of head injuries may be due to mechanical constrains in the design and development of helmet materials and structures to provide protection to the athlete against head injuries. Furthermore, testing helmet protocols are not specific enough for the sport and have changed very little over the past 50 years [8, 9]. As stated in the literature, direct contact of the human head with an object during a fall or collision can cause serious brain injuries and skull fracture [10]. That is, if the deformation of the helmet is pushed past its threshold, mechanical failure can occur, which may lead to a skull fracture, epidural and subdural hematomas. These types of injuries cause brain bleeds, pressure gradients within the skull and great amount of intracranial damage [11]. While injuries like skull fracture in the sport of hockey have been largely eliminated with the implementation of helmets [12], these injuries still occur in rare cases [13]. According to the International Ice Hockey Federation (IIHF), there are 577 thousand hockey players registered and competing in different age groups and levels of competitiveness throughout Canada [14]. It was reported in 1999 that 3.78% of all sport related emergency room visits in Canada were due to head injuries that occurred while playing hockey. Most common of all these injuries were concussions; in fact, ice hockey has been identified as having the highest incidence of concussion and head injury per participant of all sports [15, 14]. When describing head injuries, they are generally categorized as focal or diffuse. Focal head injuries (e.g., skull fracture), relate to damage to a specific location of the brain. Diffuse head injuries (e.g. concussion) relate to damage to a more widespread portion of the brain. There is little doubt that hockey helmets have been very effective in reducing the occurrence of head and brain injuries, especially those traumatic in nature [16]. The use of helmets in the sport of hockey has also led to the development of helmet testing protocols to assess the ability of the helmet to protect against concussions. Current methods for testing helmets involve a pass or fail criteria based on a single, large impact [5]. To conduct this testing, the helmet is usually mounted on a surrogate “headform”, designed to respond closely to an actual human head. Accelerometers instrumented in the headform measure the peak linear acceleration felt by the headform during an impact [5]. A range of 275-300gs is used as a helmet failure criterion. This threshold was obtained from human cadaver research on skull fractures [17]. The unit “g” is used for any linear acceleration analysis and it is a multiple of the acceleration due to gravity (g=9.81m/s2). If the peak linear acceleration measured during the impact is less than the threshold acceleration measure, the helmet is deemed appropriately protective. While this measure of peak linear acceleration is based on the acceleration experienced by the brain through the centre of mass, this testing method may not be indicative of the rigor of the sport of hockey. Current research in hockey helmet testing has also determined that rotational accelerations contribute to the occurrence of concussion and diffuse axonal injuries in the brain [18]. These rotational or angular accelerations are measured in a similar fashion as linear accelerations; but, are expressed in rads/s2, or radians per second squared, which is a measure of changes in angular velocity over time. This type of acceleration is not generally included in initial testing protocols that evaluate the protective performance of a helmet.Other researchers had examined the relationship between impact location and changes in peak linear accelerations as an avenue to better assess helmet performance. For example, Walsh, Rousseau, and Hoshizaki [21] demonstrated that impacts to different locations on a headform during testing revealed differences in peak linear accelerations. The researchers found that the side location produced the largest peak linear acceleration (132.8g) when compared to the front (121.3g) and rear locations (116.9g). Daniel, Rowson, and Duma [22], also observed the same relationship when analyzing real-life football impacts among youth participants.While current measures of linear acceleration criteria have proven to be useful in the prediction of risk related to skull fracture and other severe head trauma [5], this measure remains a poor predictor of risk related to mild traumatic brain injuries (mTBI). A test focusing on energy dissipation across helmet impact locations should be examined to better understand injury mechanisms and the risk of injury during impact.There is, however, little research work on the use of energy dissipation across helmet impact locations as an avenue to assess helmet performance and risk of injury. Energy dissipation analysis has been used in other studies to examine the protective ability of bicycle face protection and soccer headgear, but not of hockey helmet performance [23, 24]. Energy is dissipated by the helmet mainly through the attenuation layer, when energy is “absorbed” by the crushable foam [25]. Energy dissipation is defined as the conversion of mechanical energy into another form of energy, such as heat. An energy absorbing material would involve a loading and unloading curve [26], as shown in Figure 1. The area between the loading and unloading curves represents the energy dissipated by the foam during the impact. In an ideal situation, the foam would be loaded with the entirety of the incoming impact energy and all the energy would be dissipated out of the system during the unloading phase. This concept would suggest that all incoming energy generated during an impact would be absorbed and directed away from the head and brain.
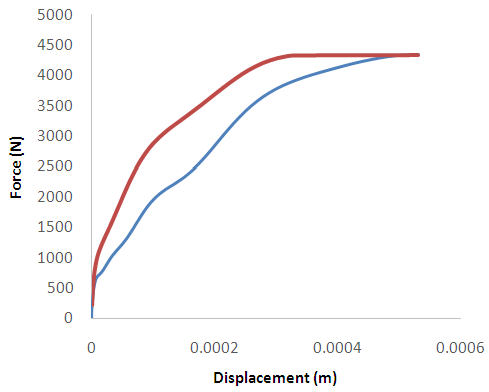 | Figure 1. Example of energy loading and unloading curve during helmeted impact. The loading curve can be seen in red, while the unloading curve is shown as blue |
2. Methods
2.1. Purpose
- Based on the above rationale, the purpose of this study was to examine the influence of impact location on the energy dissipation characteristics of a hockey helmet as compared to traditional measures of peak linear acceleration during simulated free falls.
2.2. Research Question
- The following research question was used to guide the study:What is the influence of helmet impact location on energy dissipation characteristics when mounted on a NOCSAE headform?
2.3. Instruments
- Headform. A medium sized NOCSAE headform as depicted in Figure 2 was used for all impact trials. The headform was developed in order to simulate the dynamic response that a human head experiences during impact. This headform is considered to be more anatomically correct than the Hybrid III headform, which is another commonly used headform in the field of impact research. The NOCSAE headform is considered more anatomically correct due to the inclusion of appropriate facial features and bone structure. The NOCSAE headform is instrumented with an array of accelerometers to measure the acceleration felt at impact in the anterior-posterior, superior-inferior and left-right directions. This headform has been used in many published research studies to simulate the dynamic response of impact including both linear and rotational accelerations [5-7].
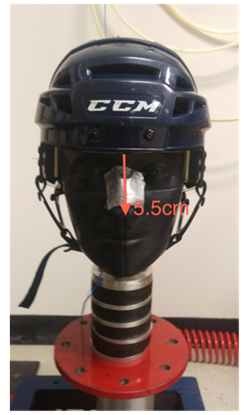 | Figure 2. NOCSAE headform with properly fitted helmet. A distance of 5.5cm is measured between the brim of the helmet and the tip of the nose |
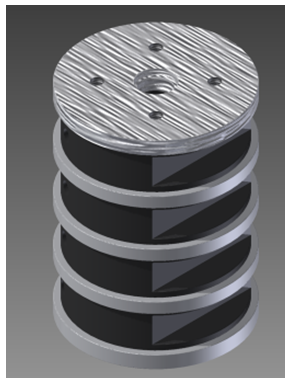 | Figure 3. Mechanical neckform |
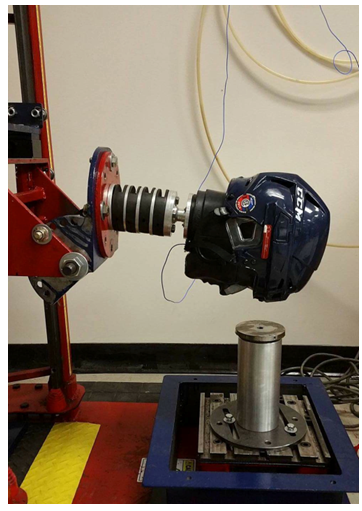 | Figure 4. Drop system and impact anvil |
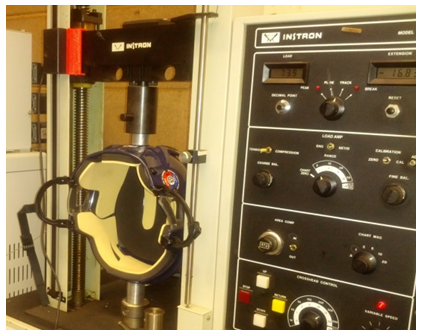 | Figure 5. Instron 1000- test equipment for mechanical properties of materials |
2.4. Procedures and Analyses
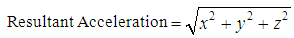
- The helmet was tested statically using a technologically updated Instron 1000 device to assess the mechanical properties of the helmet at the front and side locations. A force was applied at either location using a 31.67 cm2 cylinder with a diameter of 31.75 mm. The force and deflection data at each helmet location were recorded calibrated and computed via labview script and excel software.The helmet was also tested dynamically. To conduct this test, the helmet was properly fitted on the headform prior to each drop by following helmet fitting instructions as defined by NOCSAE standards. To minimize wear and tear of the helmet material, the helmet was switched with an identical helmet after each impact to allow ample time for the impacted helmet to rebound to its resting state. Each identical helmet was impacted three times per location, similar to the research protocol used by Oeur, Hoshizaki, and Gilchrist [28]. The protocol used in the current study, however, included 5 locations as defined in NOCSAE drop test standards, but impacted at a velocity of 4.5m/s. The locations included in this testing protocol were the front, front boss, side, rear boss, and rear. For each impact location, the linear acceleration data (x, y, and z directions) captured by the accelerometers sensors mounted in the headform was fed into an analog to digital amplifier unit and processed via a commercial software package called POWERLAB. Resultant linear acceleration was computed using the POWERLAB software calculation module based on Equation 1
 | (1) |
 | (2) |
 | (3) |
 | (4) |
 | (5) |
 | (6) |
3. Results
- Static measures of helmet stiffness were conducted for the front and side locations as depicted in Figure 6 and 7. The outcome obtained from the ratio calculation of the 2 regression curve slopes (ratio=1.66/0.67) indicate that the front location requires 2.48 times more force to acquire the same deflection as the side location. That is, the helmet has stiffer material properties at the front location than the side location.
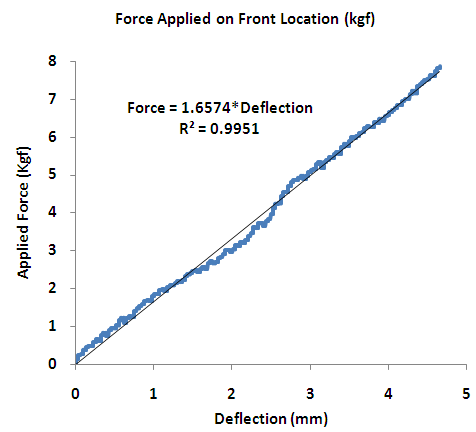 | Figure 6. Force-Deflection Curve for Front Location of Helmet. The figure shows the static loading characteristics of the helmet material at the front location to determine stiffness properties |
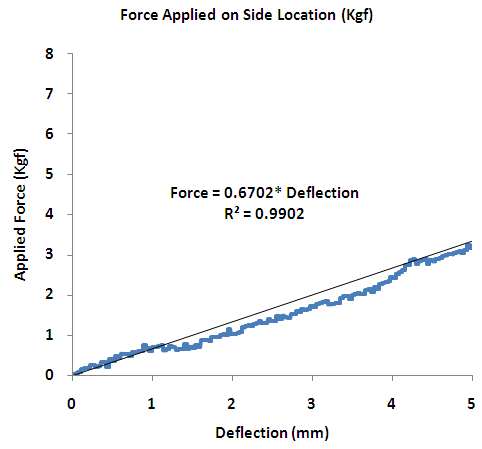 | Figure 7. Force-Deflection Curve for Side Location of Helmet. The figure shows the static loading characteristics of the helmet material at the Side location to determine stiffness properties |
|
|
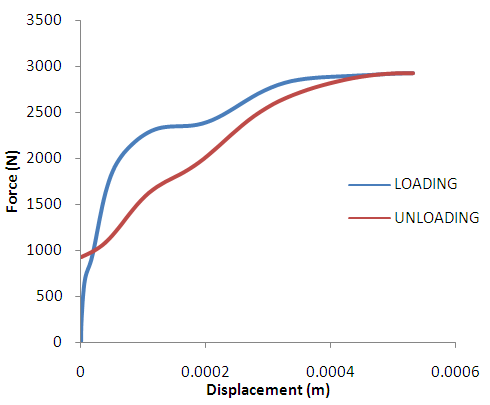
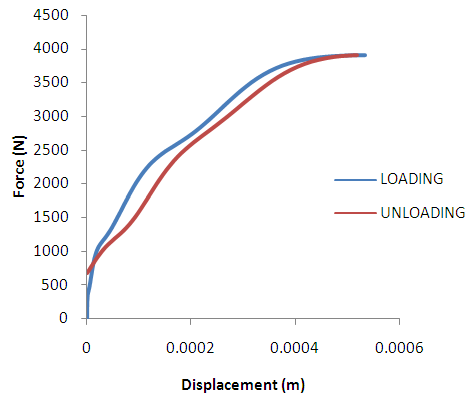 | Figure 8. Force-Displacement Curve for Front Boss Impact. The figure shows the energy loading and unloading characteristics typical of the front boss impact location |
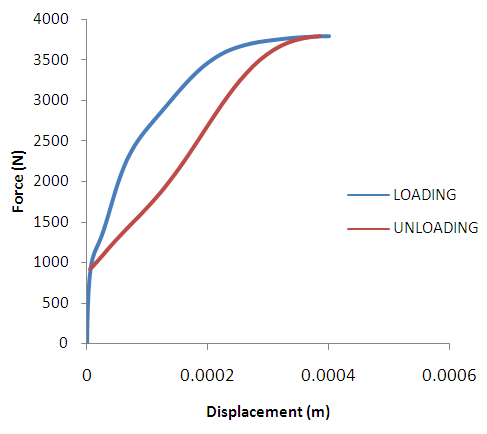
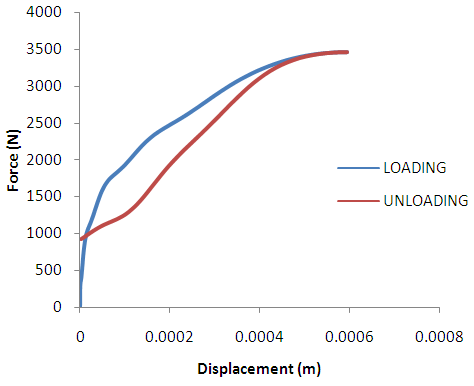 | Figure 9. Force-Displacement Curve for Front Impact Location. The figure shows the energy during the loadding and unloading phases of the impact |
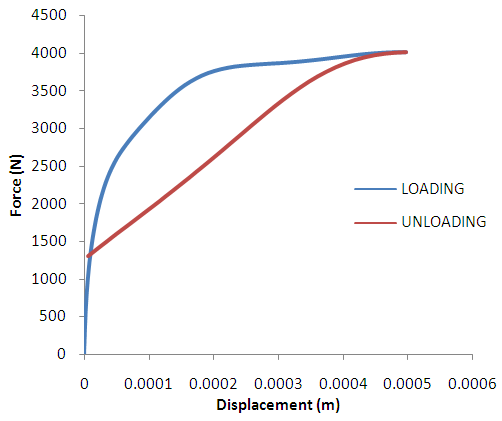
 | Figure 10. Force-Displacement Curve for Side Impact Location. The figure shows the energy loading and unloading characteristics of an impact to the side impact location |
 | Figure 11. Force-Displacement Curve for Rear Boss Impact Location. The figure shows the loading and unloading energy curves during impact |
 | Figure 12. Force-Displacement Curve for Rear Impact Location. The figure shows the energy loading and unloading characteristics of an impact to the rear of the helmet |
4. Discussion
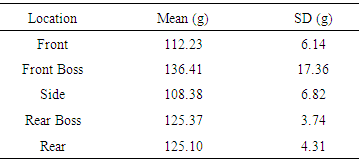
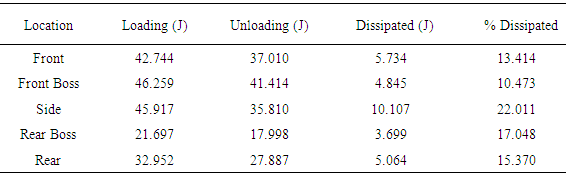
- When analyzing helmet performance using traditional kinematic measures of peak linear acceleration, there appear to be differences in helmet protective ability across impact locations. In the current study for example, the front boss location resulted in the largest amount of peak linear acceleration and the side location resulted in the lowest amount of peak linear acceleration when they were impacted at the speed of 4.5 m/s. Differences across locations on a headform impacted without a helmet at the speed of 5.5 m/s had also been found in previous research [21, 22], but with the side location generating the highest peak linear acceleration. Discrepancies on which location generates the highest or lowest peak linear acceleration when comparing previous research to the current findings may be related to helmet properties and impact velocity. These discrepancies, however, suggest that the helmet properties change the behaviour of the headform and neck, and consequently, minimize the risk of injury across impact locations. The effect of helmet geometry to accommodate comfort and appearance also appears to influence the behaviour of the helmet across impact locations [7]. As the results of the current study indicate, identical impacts across five helmet locations revealed a higher peak linear acceleration for the front boss location and consequently a greater risk of injury at this location. The side helmet location, however, appears to be the most protective against head trauma as it generated the least amount of peak linear acceleration. This outcome is also supported by the static testing conducted on the helmet, which revealed that the helmet is more flexible (more deformation due to a specific force) on the side locations when comparing it to the front location. The energy analysis conducted in this study to determine the influence of helmet properties on the amount of energy dissipated across impact locations also supports the findings obtained with traditional measures of peak linear acceleration. As the results indicate, less energy was dissipated at the front boss location, which related to a higher peak linear acceleration when compared to other impact locations as shown in Table 1 and 2. Similarly, more energy was dissipated at the side location, which related to a lower peak linear acceleration when compared to other impact locations. Although no significant differences were found on energy dissipation across impact locations when conducting the ANOVA, the outcome of this study based on descriptive statistical analysis supports the existing literature. That is, a higher energy dissipation value can result in a lower rebound velocity, which minimizes the chance of brain injury [27]. One advantage of using an energy analysis to examine helmet performance instead of just traditional measures of peak linear acceleration is that, an energy analysis offers an avenue to examine the dynamic response of the helmet material properties in dissipating energy across impact locations. That is, this approach accounts for the force generated during an impact and the deflection of the helmet material to withstand this force at each location, which is very useful information to understand the injury mechanism [6] and the behaviour of the helmet material, as an avenue to possibly improve the protective ability of the helmet.From the structural design perspective, an energy dissipation analysis can provide more information on the behaviour properties of the helmet material locations during impact testing. This information can help helmet manufactures improve weaker helmet areas to better dissipate energy, decrease the rebound velocity and minimize the risk of brain tissue damage during head impacts. As stated by Barth [27], lower rebound velocity during helmet impacts minimizes the risk and occurrence of secondary impact mechanisms, which are also considered to be responsible for post-concussion syndrome and chronic traumatic encephalopathy (CTE). CTE is a rare progressive neurological disorder that can result in cognitive, mood, behavioral, and neurological symptoms negatively affecting the lives of athletes [29].There are, however, limitations in this study when conducting the energy analysis. One of the main limitations is that we did not compute the energy dissipated by the helmet itself across impact locations, but rather the energy dissipated by the helmet, headform and neck across impact locations. To compute the energy dissipated by the helmet itself, similar impacts need to be conducted on the headform with and without a helmet. Differences between energy computations obtained with and without a helmet will indicate the amount of energy absorbed by just the helmet. The issue, however, is that conducting impacts on a bare headform will more likely cause damage to the mechanical structure of the headform designed to simulate the anatomical structure of a human head. Another limitation of the current technique is that the calculations of energy are computational intensive and time consuming, which require the creation of computer software scripts in excel, matlab or other computer software languages. As opposed to traditional measures of peak linear acceleration used to assess helmet performance, in which the measure of linear acceleration is obtained directly from the accelerometer sensors after implementing calibration and noise filtering. Furthermore, the current model only uses one type of helmet brand. Other helmet brands may behave differently across helmet impact locations on energy dissipation. This study, however, sheds light on the use of energy dissipation as a measurement technique, which can be applied to other helmet brands to better understand a helmet protective ability against head injuries.Finally, we did not conduct an energy analysis across impact locations for different impact velocities to examine the effect of speed and helmet impact location on energy dissipation. It is an idea that we want to implement for future research. It is also important to mention that the current study did not include measures of rotational acceleration, which are considered to be a contributor to the occurrence of concussions and the diffuse of axonal injuries in the brain. The reason for not including measures of rotational acceleration in the current study was due to hardware limitations. But also, because, we were more interested in comparing energy dissipation measures to traditional measures of peak linear acceleration, which are used as standard criteria to assess hockey helmet pass or fail performance during impact testing.
5. Conclusions
- The purpose of this study was to determine the influence of helmet impact location on the amount of energy dissipated during simulated impacts when compared to traditional measures of peak linear acceleration. The results indicate differences across impact locations on energy and acceleration measures. From the theoretical and practical perspective, the outcome of this study supports and builds on existing literature [16, 17, 22] and provides another avenue for researchers and helmet manufacturers to assess helmet performance in addition to traditional measures of peak linear acceleration. As previously stated in the literature [3], the idea is to design a helmet to best protect the head against head trauma induced by acceleration and decelerations to head from an impact. The measures of energy obtained in the current study provide a clear trace of the helmet material properties on energy loading, unloading and dissipation to better understand injury mechanisms and deformation of helmet material due to a head impact. In summary, this approach offers an avenue to better understand mechanical failures of helmets when pushed beyond its threshold. Information that is useful in helmet designs to minimize risk of head injuries and possibly the risk of mild traumatic brain injuries.