Stephen Arhin , Paquilla Jones, Melissa F. Anderson
Department of Civil and Environmental Engineering, Howard University, Washington, United States
Correspondence to: Stephen Arhin , Department of Civil and Environmental Engineering, Howard University, Washington, United States.
| Email: |  |
Copyright © 2016 Scientific & Academic Publishing. All Rights Reserved.
This work is licensed under the Creative Commons Attribution International License (CC BY).
http://creativecommons.org/licenses/by/4.0/

Abstract
Engineering solutions are often employed at intersections to improve pedestrian and bicyclists’ safety. Studies conducted have shown that some of such solutions provide marginal to modest safety improvements. It is envisioned that enforcement at intersections, coupled with engineering solutions, could potentially provide substantial improvement in pedestrian and bicyclists’ safety. This study presents the results of an enforcement program at 4 intersections on a corridor in order to improve motorists’ compliance thereby improving safety at intersections. The evaluation focused on the behavioral impact of the enforcement on pedestrians, drivers, and bicyclists using surrogate variables. Prior to the implementation of the enforcement, drivers, pedestrians, and bicyclists behaviors were recorded at 4 selected intersections. Approximately 2 weeks after the implementation of the enforcement program, the same was recorded at the intersections. A statistical comparison of the surrogate variables was conducted to gauge the impact of the enforcement, at 5% level of significance. From the results, the enforcement led to 50% - 100% compliance of no right-turns on red. Pedestrian-vehicle conflicts were also reduced post implementation of the enforcement program by approximately 50% - 66%.
Keywords:
Traffic Enforcement, Traffic compliance, Pedestrian, Driver behaviour
Cite this paper: Stephen Arhin , Paquilla Jones, Melissa F. Anderson , Evaluation of Safety Surrogates of Traffic Enforcement at Signalized Intersections, Journal of Safety Engineering, Vol. 5 No. 1, 2016, pp. 1-7. doi: 10.5923/j.safety.20160501.01.
1. Introduction
The fundamental idea of traffic enforcement is that the threat of apprehension and resulting punishment from the apprehension serves to deter drivers, pedestrians, and bicyclists from violating the rules and regulations. However, many within the transportation engineering community believe that the mere enforcement presence also improves driver attention and vigilance in the vicinity of the enforcement, and may offer additional safety benefits even if there are no changes in operational characteristics. The effectiveness of enforcement as a deterrent to violations hinges on two key factors:1. Proper behavior required by road users must be defined and understood. 2. The swiftness, severity, and certainty of the punishment given for the violation.An enforcement program on an arterial corridor was implemented in Washington, DC 2012. This study evaluated the impact of the enforcement on driver, pedestrian and bicycle behaviors at 4 particular intersections. The four intersections along the corridor for the enforcement had experienced high frequency crashes including incidents resulting in fatalities, injuries, and property damage. Even though engineering solutions, such as prohibiting right-turns on red, illuminated crosswalks, improved signal timing, among other treatments were implemented, crashes resulting in injuries and property damages persisted. This led to the implementation of a pilot enforcement program to curb such incidences. The evaluation assessed the impact the enforcement on pedestrian, driver and bicyclist behaviors using six surrogate variables.On this basis, this paper has the following objectives:● To obtain and conduct analysis on safety surrogate variables at four intersections using closed-circuit television (CCTV) and video playback.● To determine whether the impact of the enforcement program changed drivers’, pedestrians’ and/or bicyclists’ behavior using statistical inferences at 95% confidence interval.The results show that the safety surrogates can be used to evaluate the effectiveness of enforcement in improving safety at intersections.
2. Literature Review
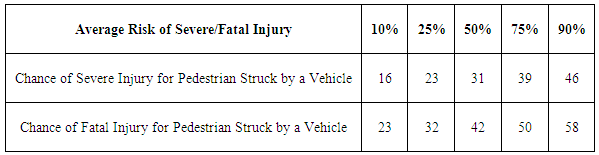
Pedestrians are one of the most at-risk group of roadway users. According to the National Center for Statistics and Analysis [1], 14% of all traffic fatalities involve pedestrians; however, they only account for 3% of all Americans involved in traffic crashes. Though the percentages are relatively low, pedestrian safety still remain a substantial traffic safety issue. Since 2009, pedestrian and bicycle injuries have steadily increased in the United States. In 2012 [1], there were 4,743 pedestrian fatalities and approximately 76,000 pedestrians injured in traffic crashes in the United States. Pedestrian fatalities are more likely to occur in urban areas at non-intersections and at night. Urban areas accounted for 73% percent of fatalities of which 70% occur at non-intersections [1]. Crashes involving pedestrians often occur at intersection crosswalks where motorist and foot traffic conflict and may be caused by the drivers, pedestrians, or bicyclists. The types of intersections that are most dangerous for pedestrians are those that are high volume, high speed and multi-lane with complex signal phasing or an intersection with no form of traffic control. There are many factors that contribute to all crashes including unsafe pedestrian crossing behaviors, drivers failing to yield to pedestrians (and vice versa), and speeding. Drivers failing to yield results in approximately 42% of pedestrian crashes in marked crosswalks and 32% in unmarked crosswalks. According to a 2014 report prepared by the National Highway Traffic Safety Administration [2], approximately 67% of fatal and non-fatal crashes cited unsafe pedestrian behavior as one of the contributing factors. The report also noted that the faster a vehicle is traveling, the more likely a pedestrian involved will be seriously injured or killed in a collision. The average risk of severe or fatal injury for pedestrians struck by a vehicle at various speeds is shown in Table 1. From the table, for example, there is a 90% chance of a fatal injury if a vehicle moving at 58 mph strikes a pedestrians.Table 1. Average Risk of Severe or Fatal Injury (%) for Pedestrians Struck by a Vehicle at Various Speeds (mph) [2]
 |
| |
|
In District of Columbia [3], between the years 2005-2010, the average number of pedestrian and bicyclist crashes averaged 653 and 334, respectively. The District makes efforts to educate commuters of roadway rules and regulations. To better enforce these laws, the District Department of Transportation (DDOT) funded the Street Smart and Smooth Operator Campaigns which is one of the initiatives that deploy enforcement to focus on specific violations in a certain area for a period. The Smooth Operator Campaign targeted the behavior of aggressive drivers while the Street Smart Campaign used education to increase awareness of pedestrian and bicyclist safety and focused on changing the behavior of all road users. The National Highway Traffic Safety Administration (NHTSA) recommends the implementation of engineering, education, and enforcement for the reduction of pedestrian injuries and fatalities. It is noted that pedestrian safety significantly increases when pedestrians are educated in addition to drivers yielding to the former while turning. It is suggested that a combination of enforcement and engineering improvements result in higher driver and pedestrian compliance [2].One of the key components of implementing enforcement is knowing where it is needed. Problem locations must be identified in order to deploy enforcement to potentially improve safety. The locations are often determined based on the frequency of crashes, fatalities and injuries. Departments of Transportation in various jurisdictions in the United States often deploy red light cameras, deploy engineering countermeasures, video cameras and enforcement to improve safety. Several jurisdictions have been able to increase pedestrian and bicycle safety and reduced the number of fatalities that occur at high-density crash locations based on a combination of such deployments.In 2004, Van Houten et. al [4] evaluated an enforcement program to increase driver yielding to pedestrians in three Canadian cities. The combination of warnings, use of decoy pedestrians, information flyers, community feedback, and the use of law enforcement deployment produced a marked and sustained increase in drivers yielding to pedestrians on selected streets in the cities. The mean percentage of drivers yielding to pedestrians in crosswalks increased from 36% to 73% and pedestrian crashes in crosswalks decreased by 50% in these three cities following the introduction of Courtesy Promotes Safety program.Similarly in 2003, Makinen et al. [5] examined traffic law enforcement in the European Union to identify important issues, such as non-compliance and its contribution to accidents. The study focused on four major factors: aggressive driving, speeding, driving under the influence of alcohol, and non-use of personal safety devices. The results found that subjective-based traffic enforcement would not achieve adequate levels of traffic rule compliance. Traffic enforcement is an integral part of traffic safety, but unrealistic pressure and demand will create public resistance. Thus, extensive monitoring of road users based on fear and punishment will not yield the required level of outcome. While there is genuine effort to improve traffic enforcement, the challenge facing traffic enforcement is recognizing that improving driver behavior by just policing is not possible. The use of speed bumps, small roundabouts, and sophisticated traffic signals may yield better results than excessive traffic enforcement. Vehicle systems such as intelligent speed-limiter and alcohol interlocks are other options suggested in the literature, which could improve compliance and safety.In 2003, a speed photo enforcement safety program evaluation was performed at 48 intersections in the City of Winnipeg, Canada. The main objective was to estimate the program’s outcomes on speeding behavior by comparing before and after photo enforcement scenarios over a period of 15 years from 1994 to 2008. Monthly crash frequencies and roadside data on speeding were analyzed. The results showed that the presence of cameras was not related to the increase or decrease of crashes. However, there were less red light violations after the cameras were installed. The study concluded that the photo enforcement program had a protective effect on speeding behavior and an overall positive net effect on traffic safety. On the other hand, the authors indicated that the program might be less effective in preventing serious speeding violations at intersections [5].Similarly, the Federal Highway Administration (FHWA) awarded the cities – San Francisco, California Las Vegas, Nevada, and Miami, Florida – with a grant to conduct a study on pedestrian fatalities in an attempt to improve pedestrian safety. Each city identified and evaluated its high-density crash locations by determining factor(s) that contributed to the crashes and implementing countermeasures tailored to the site based on those factor(s) [6]. The study consisted of two phases in which phase one entailed a zone analysis method developed by the National Highway Traffic Safety Administration (NHTSA). This method was used to identify the locations where the countermeasures were more likely to reduce the number of collisions and injuries. Phase two involved the implementation of the countermeasures before conducting data collection. The countermeasures were evaluated and each field team used the results to develop strategies that improve the safety of pedestrians throughout the United States. Since the impact on crashes could not be determined until years after the deployment of the countermeasures, the teams focused on surrogate measures of effectiveness (MOEs) to determine whether there was a safety improvement in pedestrian and driver behavior. The MOEs included vehicle speed, percentage of drivers braking, percentage of pedestrians in the crosswalk during conflicting traffic, percentage of drivers stopping or yielding, pedestrian crossing time, pedestrian delay, and percentage of pedestrians making illegal crossings [6]. In Miami, the field team tested more than one surrogate MOE at one location to determine which one was more effective. For example, one location had on the electronic NO TURN ON RED (NTOR) sign as well as the static NTOR sign. Although there was a decrease in pedestrian crashes during phase one of the study, a larger reduction was observed after the implementation of the countermeasures at the locations by an average of 51 crashes per year [6]. The San Francisco team also tested more than one countermeasure at each location. To determine the impact of the countermeasures, the team installed cameras to record pedestrian and driver behavior and interviewed pedestrians as well. In contrast, the Las Vegas team tested various countermeasures at specific locations in a series of stages. Each stage allowed for a before-and-after analysis of the impacts; however, the impacts of the countermeasure(s) were compared to the true baseline only in the first stage [6]. The results of the comparison indicated that there were seven countermeasures that were highly effective in improving pedestrian safety in all three cities. These were: leading pedestrian interval, pedestrian countdown signals, in-street pedestrian signs, activated flashing beacons, rectangular rapid flash beacons, rectangular rapid flash beacon, call buttons that confirm the press, Danish offset combined with high-visibility cross-walk, advance yield markings, and YIELD HERE TO PEDESTRIANS signs. The remaining countermeasures were categorized as either “moderately effective” or “having low effectiveness”. Overall, FHWA determined that certain countermeasures are only effective in specific jurisdictions. For example, Las Vegas has fairly wide roads while Miami has more narrow roads. Some pedestrian signs may be more effective in Miami where they can be seen better while a different and more noticeable countermeasure should be used in Las Vegas [6].A driver enforcement program that included the distribution of educational material was implemented in Miami Beach for two weeks in 2004 along two major corridors. Data on pedestrian behavior in crosswalks were obtained after which enforcement was implemented a week later. The results of the evaluation showed that the enforcement was successful as an increased percentage of drivers yielded for crossing pedestrians which continued for a year thereafter, even though there was no presence of law enforcement. The authors stated that the reasons to believe there is the presence of police enforcement made a significant impact in the driver yielding percentage. [7] In all, it was observed that the combination of police enforcement and crosswalk traffic signals enhancement both contributed to the safety improvements.A report prepared in 2013 [8] presents the results of a case study on automated speed enforcement in Washington, DC. The study contedns that about 62% of in Washington DC ranked dangerous driving as their top concern, above crime and other issues. As a result, one of the options to curb such adverse behavior was to implement automated speed enforcement program. The report indicates that the program has yielded improvements in safety. Speeding of over 10 pmh above the posted speed limit has reduced from 33% to 25% of all drivers as of 2013. In additon, the number of traffic fatalities in DC has also reduced from 68 in 2003 to 19 in 2012.In an effort to reduce crashes to zero violations based on enforcement and to eliminate traffic fatalities and serious injuries by 2024 in the City of New York, a report card on the progress made was publihed in February 2015 [9]. Based on the review, some of the recommendations made to achieve the objectives included the following: publish complete traffic enforcement and crash data that can be easily analyzed so all New Yorkers can better understand the pervasiveness of traffic violence on city streets; use data to drive traffic enforcement, focusing on the violations and locations most likely to kill and injure pedestrians and cyclists; Enforce New York City’s new Right-of-Way Law to send a clear message that drivers who fail to yield will be held accountable [9].From the literature review, there is strong evidence that the implementation of engineering countermeasures, enforcement programs, installation of cameras, and the distribution of educational material leads to the increase of pedestrian and bicycle safety. As noted in the literature, the outcomes vary by jurisdiction and potentially reduce crashes involving pedestrians and/or bicyclists. It is also noted that a decrease in traffic violations was sustained especially after the first enforcement deployment. Therefore, traffic enforcement programs have proved to result in beneficial outcomes for the communities that implement them.
3. Methodology
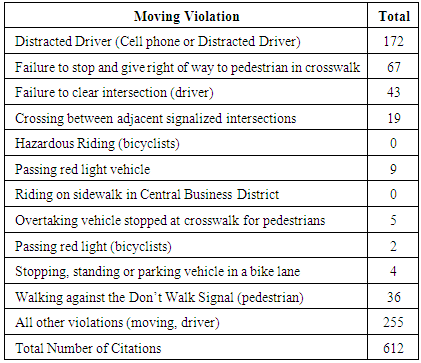
In this study, four intersections were selected based on the high volume of pedestrians and bicycles together with the high frequency of crashes experienced over the years. The four intersections also had closed circuit video cameras which was used to capture data. The Traffic Safety and Specialized Enforcement Branch of the Metropolitan Police Department (MPD) conducted law enforcement at the intersections for a period of 10 days. The law enforcement targeted pedestrian-vehicle and bicycle-vehicle violations. Table 2 presents the breakdown of citations that were given to motorists, pedestrians and cyclists at the intersections over the period.Table 2. Breakdown of citations given to motorists, cyclists and pedestrians
 |
| |
|
3.1. Intersections
The enforcement program was implemented in 2012 at the following selected intersections in the District of Columbia:1. Georgia Avenue NW and New Hampshire Ave., NW2. 16th Street NW and Columbia Street NW3. 16th Street NW and U Street NW4. 16th Street NW and Irving Street NWThe intersections were identified based on crash history and low compliance rate regarding adherence to traffic laws by drivers, pedestrians, and bicyclists.
3.2. Data Collection
Closed circuit television (CCTV) was used to record the “pre” and “post” enforcement scenarios at the selected intersections. The “after” scenario behaviors were recorded two weeks after the completion of the enforcement campaign. The recording were done for 5 weekdays (Monday through Friday) from 7 A.M. through 7 P.M. for each scenario.
3.3. Extraction of Surrogate Variables
Video playback was used to extract the proxy or surrogate driver, pedestrian and bicyclist behavioral data for the “pre” and “post” scenarios. The frequencies of the following variables were extracted from the video playback (data for a 6-hour duration was used):Pedestrian-vehicle conflict: When a pedestrian is walking in the crosswalk (while having the right-of-way), drivers from the parallel traffic may turn right across the crosswalk. This conflict occurs if a driver comes within 5 to 10 feet of a pedestrian or the pedestrian took evasive action due to a turning vehicle.Right-Turn on Red conflicts: When a vehicle turning right on red did not come to a complete stop affecting pedestrians’ inability to enter the crosswalk, or the latter takes an evasive action.Illegal pedestrian crossing: Pedestrians who do not cross at a crosswalk or crossed against the signal, which might have caused drivers to brake or take evasive action. “Right Hook” - Cyclists-vehicle conflicts: This occurs when drivers turn right across bike lanes causing cyclists to brake and/or take evasive action. Cyclist violations include wrong way riding, running red lights, etc.Red light running: The frequency of red-light running violations at the intersections was also be recorded. The video files obtained were reviewed for the selected six-hour duration period on a typical weekday. The extraction periods were from 7:00 A.M. to 1:00 P.M. and 12:00 P.M. to 6:00 P.M. for a typical weekday. For the purpose of maintaining consistency, the selected data extraction period on a given weekday was paralleled for both “pre” and “post” scenarios. From the video playback, road users including pedestrians, cyclists, and motorists (i.e., vehicles and motor bikes) who traversed the study crosswalks were evaluated for moving violations or conflicts based on the surrogate variables. Generally, emergency response vehicles and police patrol vehicles were also included in the study but were excluded when such vehicle(s) were responding to an emergency or incident. The data extracted was tallied and recorded.
3.4. Data Reduction and Statistical Analysis
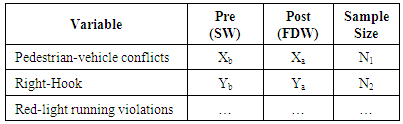
The test statistic used in this study was primarily that of proportions. For example, the number of pedestrians who experienced a particular surrogate variable within a timeframe was obtained which was divided by the total number of pedestrians observed within the same timeframe. This proportion was obtained for the “pre” and “post” scenarios, and a summary table, as shown in Table 3, was developed for each intersection.Table 3. Sample Summary of Frequencies for Intersection 1 for the Surrogate/Proxy Safety Variables
 |
| |
|
3.5. Hypothesis
The sample proportion obtained for each proxy variable for the “pre” and “post” scenarios was compared using classical statistical test of hypothesis. It was hypothesized that the sample proportion for each of the proxy variables obtained during the “post” scenario will be less than those obtained for the “pre” scenarios at all the intersections. Given that Pb is the sample proportion for say the pedestrian-vehicle conflict variable for the weekdays reviewed for the “Pre” scenario, and Pa is the same for the “Post” scenario for, say intersection 1, then the 1-tailed hypothesis test can be expressed mathematically as:H0: Pb ≥ PaH1: Pb < PaThe population sample size was large (n > 30), thus the z-test was used to test the hypothesis at 5% level of significance, using a pooled-variance of sample proportions. It was assumed that the sample was normally distributed. The test was conducted for each variable for the four intersections.
4. Results
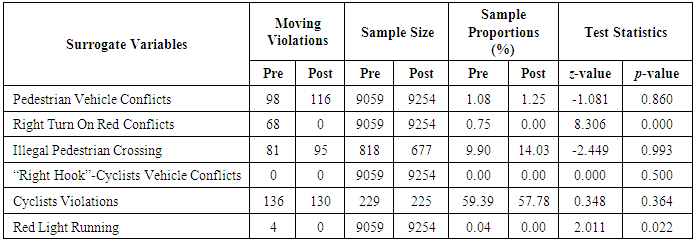
Summaries of the frequencies for the four study intersections are presented in Tables 4 through 5, which also present the statistical results of the hypotheses tests. Table 4. Results Summary – Georgia Avenue/ New Hampshire Avenue, NW
 |
| |
|
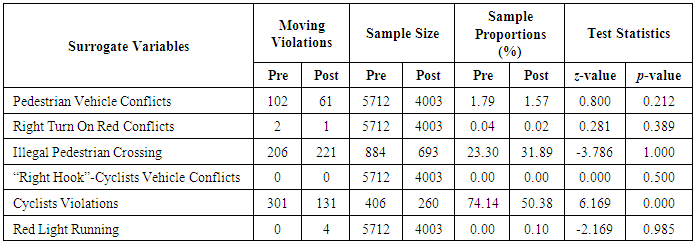
Table 5. Results Summary – 16th Street/ Columbia Road, NW
 |
| |
|
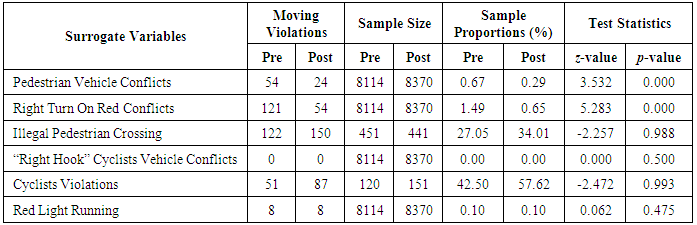
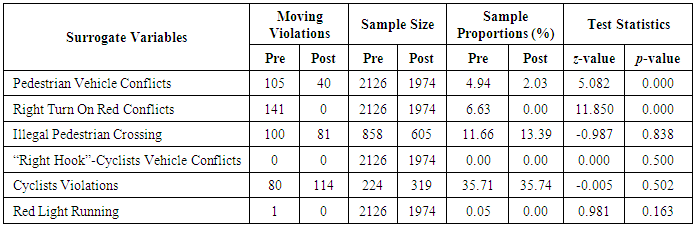
a) Georgia Avenue and New Hampshire Avenue, NWTable 4 shows that there were reductions in the frequencies for pedestrian-vehicle conflicts and right-turns on red conflicts in the “after” scenario. However, increases in the frequencies for illegal pedestrian crossings as well as cyclists’ violations were recorded. Frequencies for red-light running and “right hook” conflicts remained the same. The reductions in the sample proportions for the pedestrian-vehicle conflicts and right-turn on red conflicts in the “post” scenario were found to be statistically significant at 95% confidence interval. The increases in the proportions for illegal pedestrian crossings as well as cyclists’ violations were not statistically significant (at 5% level of significance).b) 16th Street and Columbia Road/Harvard St, NWTable 5 presents the summaries of the data extraction and statistical analyses. From Table 5, there were reductions in the frequencies for cyclists’ and red-light running violations in the “post” scenario while increases in frequencies were recorded for illegal pedestrian crossings and pedestrian-vehicle conflicts. “Right hook” conflicts were not observed at this intersection for the “pre” and “post” scenarios. The reductions in the sample proportions for red-light running and right-turn on red conflicts in the “post” scenario were found to be statistically significant at 95% confidence interval. The increases in the proportions for illegal pedestrian crossings as well as cyclists’ violations were not statistically significant (at 5% level of significance).c) 16th Street and U Street, NWThe summaries of the data extraction and statistical analyses for this intersection are presented in Table 6. As shown in Table 6, there were reductions in the frequencies for pedestrian-vehicle conflicts, right-turn on red and cyclists’ violations in the “post” scenarios while increases in frequencies were recorded for illegal pedestrian crossings. “Right hook” conflicts were not observed at this intersection for the “pre” and “post” scenarios. Only the reduction in the sample proportion for cyclists’ violations in the “after” scenario was found to be statistically significant at 95% confidence interval. The remaining reductions (with the exception of “right-hook” conflicts) were not statistically significant, using 95% confidence interval.Table 6. Results Summary – 16th Street/ U Street, NW
 |
| |
|
d) 16th Street and Irving Street, NWTable 7 presents the summaries of the data extraction and statistical analyses. It can be observed in Table 7 that there were reductions in the frequencies for pedestrian-vehicle conflicts, right-turn on red, illegal pedestrian crossing and red-light running violations in the “after” scenario while increases in frequencies were recorded for cyclists’ violations. “Right hook” conflicts were not observed at this intersection for the “pre” and “post” scenarios. The reductions in the sample proportions for the pedestrian-vehicle conflicts and right-turn on red conflicts in the “post” scenario were found to be statistically significant at 95% confidence interval. The reduction in the proportion of red-light running violations was not statistically significant. The increases in the proportion for illegal pedestrian crossings as well as cyclists’ violations were not statistically significant (at 5% level of significance).Table 7. Results Summary – 16th Street/ Irving Street, NW
 |
| |
|
5. Discussions
The reductions in the percentage of pedestrian-vehicle conflicts observed at the intersections ranged from approximately 50% to 66% (58% on average). The reductions occurred at 3 of the four intersections studied. Two of the reductions were found to be statistically significant at a 95% confidence interval. The remaining intersection experienced an increase of 18% in pedestrian-vehicle conflict after the enforcement implementation. This increase was not statistically significant at 5% level of confidence. The enforcement program potentially enabled a reduction of right-turn on red conflicts at all 4 intersections, with the reductions ranging from 50% to 100%. Of the reductions analyzed, 3 were found to be statistically significant at 95% confidence interval.From the results of the analysis, it appeared that the enforcement program did not have an effect on pedestrian illegal crossings at the 4 intersections studied. There were increases in the percentage of pedestrian illegal crossings at 3 of the 4 intersections that ranged from 7% to 23% while a reduction of 19% was observed at the remaining intersection. However, the changes observed were not statistically significant, at 5% level of confidence. During the review of the video playback for the “pre” and “post” scenarios, bicycle-vehicle conflicts (“right-hook”) were not observed.A review of the results showed that there were increases in the percentage of cyclists violations ranging between 43% and 62% were observed at 2 of the four intersections. These increases were not statistically significant, at 95% confidence interval. The remaining intersections experienced a reduction in the violations ranging from 5% to 51%. The reduction in violation was found to be statistically significant at one of the two intersections. Violations involving red-light running was found to be the same at one intersection while there were reductions in the number of violations in the “after” scenario at 2 intersections. The reductions were not statistically significant. There was an increase in this violation at one intersection which was also not statistically significant.The changes in the proportions of pedestrians and drivers in the analyses could be generally attributed in part, to the enforcement deployed at the intersections. It is thought that drivers and pedestrians generally tend to alter behavior in the presence or perception of citation and punishment for violation of traffic laws.
6. Conclusions
The implementation of education, engineering and enforcement programs are known to improve safety at high crash locations. It is important to know how, when and where to apply these programs to provide the best safety improvements based on jurisdictional preferences. The study confirms that enforcement in particular, in addition to engineering and outreach countermeasures, provides a marked reduction in moving violations at high crash frequency intersections. It is recommended that, for intersections prone to a high frequency of crashes, occasional enforcement activities could help improve safety in addition to other engineering and outreach stations, which may be effective beyond the period of enforcement deployment.
References
| [1] | National Highway Traffic Safety Administration. “Traffic Safety Facts 2012”. Available at http://www-nrd.nhtsa.dot.gov/Pubs/812032.pdf Accessed on December 24, 2015. |
| [2] | National Highway Traffic Safety Administration. “Pedestrian Safety Enforcement Operations: A How-To Guide.” Available at www.nhtsa.gov/staticfiles/nti/pdf/812059-PedestrianSafetyEnforceOperaHowToGuide.pdf. Accessed on December 24, 2015. |
| [3] | Annual DC Crash Statistics Report, 2005-2012. District Department of Transportation. Available at http://ddot.dc.gov/publication/traffic-safety-report-statistics. Accessed on December 26, 2015 |
| [4] | Tefft, B. C. (2011). Impact Speed and a Pedestrian’s Risk of Severe Injury or Death. Washington, DC: AAA Foundation for Traffic Safety. Available at www.aaafoundation.org/sites/default/files/2011PedestrianRiskVsSpeed.pdf . Accessed on December 24, 2015. |
| [5] | Van Houten R, Malenfant JEL., (2004). Effects of a driver enforcement program on yielding to pedestrians. Journal of Applied Behavior Analysis; 37(3):351-363. |
| [6] | Mäkinen, Tapani, David M. Zaidel, and Gunnar Anderson. "Traffic Enforcement in Europe: Effects, Measures, Needs and Future.” Final Report of the ESCAPE Consortium. Apr. 2003. Web. 19 Dec. 2014. |
| [7] | Vanlaar, W., Robertson, R., Marcoux, K., (2014). An evaluation of Winnipeg's photo enforcement safety program: Results of time series analyses and an intersection camera experiment, Accident Analysis & Prevention 62 (0), 238-247. |
| [8] | Enforcement Washington, DC; “Automated Speed Enforcement: A Community Speed Reduction Case Study”. December 2013. Available at: http://www.hria.org/uploads/catalogerfiles/2013-speed-reduction-resources/DCCaseStudy_120313.pdf . Accessed on December 27, 2015. |
| [9] | New York. 2014 NYPD Report Card: Year One of Vision Zero Traffic. February 2015. Available at https://www.transalt.org/sites/default/files/news/reports/2015/2014_NYPD_Report_Card-Year_One_of_Vision_Zero_Traffic_Enforcement.pdf. Accessed on December 27, 2015. |

 Abstract
 Reference
 Full-Text PDF
 Full-text HTML