Abbas Matooq, Saad M. A. Suliman
University of Bahrain, College of Engineering, Department of Mechanical Engineering
Correspondence to: Abbas Matooq, University of Bahrain, College of Engineering, Department of Mechanical Engineering.
| Email: |  |
Copyright © 2012 Scientific & Academic Publishing. All Rights Reserved.
Abstract
Measuring occupational safety and health (OSH) performance is required by many parties; such asthe top management of a company, the national authorities and an OSH specialist. Measuring of OSH performance is a very difficult task due to absence of a single measurement scheme.This paper reviews the existing models to evaluate OSH performance and develops a model to help OSH specialist to evaluate OSH performance of workplaces.The model established a scale system to evaluate workplaces by a single measure based on the current OSH regulations in Bahrain. All the regulations were sub-classified into a number of attributes that describe each regulation. Two different types of approaches were used. One is the Average Weights Model (AWM) which is used to create relative weights for each attribute depending on the results of the preference expressed by a questionnaire targeted a sample of manufacturing and construction companies. The other approach to create relative weights for the attributes is the Analytic Hierarchy Process (AHP) method based on opinions of15 OSH experts. An extra approach,called Combined Average, is added by finding the average of the weights calculated by WSM and AHP. The generated weights are used to evaluate the overall performance by a simple rating system. A validation step is carried out by selecting twenty latest inspection cases from the OSH enforcement body record for which the overall scores are calculated. The results and the final decisions for these cases are compared to the decisions taken by the OSH inspectors. The AHP model has shown accurate and more consistent results as testified by the OSH inspectors and experts. The model's generated results can be classified as leading indicators.
Keywords:
OSH, Performance Measurement, AHP
Cite this paper: Abbas Matooq, Saad M. A. Suliman, Performance Measurement of Occupational Safety and Health: Model for Bahrain Inspectorates, Journal of Safety Engineering, Vol. 2 No. 2, 2013, pp. 26-38. doi: 10.5923/j.safety.20130202.03.
1. Introduction
1.1. Safety Measurement
The problem of safety measurement is confronted by the problem of standardization. Many researchers[1],[2]&[3] stated that still there is no term of definition of safety which is accepted universally.The notation “safety” has many definitions,referring to Cambridge dictionary; ‘safety’ is defined as ‘the state in which or a placewhere you are safe and not in danger or risk’. However, safety has been defined also as ‘the relative protection from exposure to hazards’, ‘no accidents’, ‘the opposite of hazard’ while the hazard is something that can cause harm, ‘the appropriate handling of a substance or carrying out of an action with the view to efface the possibility of causing an injury or damage’[3], ‘the conservation of human life and its effectiveness, and the prevention of damage to items as per mission needs[1].Because of the various definitions that are given to the notion of “safety”, it is difficult to give one-way definition to safety measurement[3]. So, along the past decades researchers did not agree on a single way to measure safety performance. Can safetybe measured by just counting the number of accidents, the size of losses and resulted damages, or the way that all workers perceive or acknowledge safety?Measurement as defined by Stevens (1951) is the assignment of numeral to objects or events according to rules [1]. Or it is the comparison process among the existing objects or the natural qualities of incidents[3]. The problem is how to convert the safety performance to a single numerical measure that states the situation of safety in a workplace. Safety measurement will assist to locate and identify areas of potential hazards. It also can be used for trend comparison or to describe the current state of a company. Knowing what is happening in terms of safety, helps for predicting future problems and hence prevents accidents that may cause harm to people or any kind of losses to properties. Moreover, safety measurement can be used as a decision making tool. For example, to decide about the allocation of suitable resources in order to rectify problematicOSH areas or the establishment of long term preventive controls by the management. Evaluation of efforts or programs reserved to improve safety performance cannot be done without a measuring tool.There are many attempts to classify occupational safety measurements or indicators. However, researchers agreed on two main classifications despite the different naming. OSH measurements can be classified into leading indicators (prospective) and lagging indicators (retrospective),in other words, indicators that depend on pre-incidents’ data and those depend on post-incidents data.
1.2. Lagging Indicators
The lagging indicators refer to the measurement tools that use post incidents data or the data resulted from occupational accidents, injuries or losses occurred in the workplace. The incidence rate, the incident frequency rate or the severity rate are examples of this category of indicators. For example the American Occupational Safety & Health Administration (OSHA) which is a part of USA Department of Labour uses the incident frequency rate which can be calculated based on the following formula: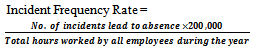 | (1) |
The 200,000 hours in the formula represent the equivalent of 100 employees working 40 hours per week, 50 weeks per year as used by OSHA.The normal risk assessment, which defined as an evaluation of risk in terms of probability and severity, is a tool that uses accidents data to evaluate the likelihood of occurrence and severity.Despite the wide use of lagging (retrospective) indicators in the industry, they have a number of disadvantages. Depending on accidents data only to evaluate the risk or safety performance is considered as a measurement of failure rather than success. Also it is a sort of frustration and does not give any praise.The lack of data about accidents is the most critical area. Accidents data should be collected over a long period of time or from a large group of similar conditions to be approved statistically[3]. Many establishments collect data regarding the accidents, injuries or damages happened under their scope. However, this data totally depends on the user as each organization has its definition for reported accidents rather than on unified investigation techniques and procedures. The investigation normally comes out with direct causes and little of root causes which can be rectified to improve the situation. From the other hand, recording the root causes of each accident reported is not an easy task for an organization as it requires professional investigation teams and strong data infrastructure. One extra reason is that investigators and reporters of accidents will face the problem of recording multi-causality of accidents and deciding about the cause that has more effect on an accident than other causes. Moreover, reported accidents are rarely compared to different events that disturb the production in a workplace. Some organizations will get a long period of time before having a reported accident which really does not show the real situation of safety and healthperformance. The rewarding schemes for reporting or non-reporting accidents applied by some companies are another reason for the lack of accidents data. Some organizations depend on appraising the lapse of the time without occurrence of a lost time accident (LTA). The LTA is considered when a worker gets an injury that causes absence from work. This type of schemes may lead to hide the exact number of accidents occurred.Mangers or supervisors do not want to be pointed out for breaking an achievement recorded by the company. Some other companies reward on reporting accidents, this will cause an over-reporting situation as a lot of accidents will be reported without necessity. Another reason that may cause the under-reporting, which is not reporting serious accidents by workers or supervisors, is the reluctance of management because of the blame culture in the organization or being afraid from facing sanctions either from company or local authorities.Reported accidents may show vague condition also. For example, when a sub-contractor reports an injury to a social insurance organization, usually the sub-contractor will not state the exactworkplace that may got involved directly to the accident because of poor safety conditions. Likewise, the company involved in the accident will not record it as the worker harmeddoes not belong to it.Accidents rates or data do not allow the evaluator to include the current efforts taken by management to improve the safety and health conditions in the workplace. Also, management will not be able to evaluate the effectiveness of applying new measures or systems to improve the safety conditions unless they wait till collecting sufficient data. Here is the point; it is not accepted to put human beings under experiments through subjecting them to a new system or improved machinery just to proof that the system is safe. Similarly, for reliability evaluation, devices or electronic equipmentcould pass through a reliability experiment or an overload test. However this type of experiments could not be carried out involving people. The normal risk assessment, which defined as an evaluation of risk in terms of severity and probability, is a tool that uses accidents data to evaluate the likelihood of occurrence and severity.Risk assessment usually uses a two dimension matrix, one axis contains the probability segregations and the other axis holds the severity. The risk evaluated as the multiplication of probability and consequences (severity).The ordinary risk assessment matrices are always criticized for their subjectivity and relying on the estimation of likelihood and severity that depend on judgment rather than valid data[4].
1.3. Leading Indicators
The second classification of OSH performance indicators is the leading (prospective) indicators. These types of indicators depend on pre-accident data such as inspection data, surveys, audits, sampling workers'behaviour or corrective action achieved.Inspections usually address the work process and consider aspects of working activities and compare them with a set of predetermined standards, while the audits subject the whole working system to a closer examination. Both inspection and audits require the comparison with predetermined standards, without it they will be considered as only observations.Inspection and audits are powerful tools to monitor unsafe acts and conditions in a workplace. They have some advantages as they can provide direct and clear picture of the current situation of the workplace. They can discover the mistakes and problems that may lead to accidents or damages before they occur. Normally, both are accepted as administrative tools. The disadvantages are the requirement of experience and knowledge for the person who carries out the inspection or audit. Inspection or audit may lose their importance with frequent repetition.Another type of leading indicators is the monitoring of safe and unsafe behaviour of workers. This tool is the key element of behaviour-based safety programs (BBS). It depends on recording of random samples of workers acts while working and compare it with predetermined behaviors. This method requires time to come out with a conclusion, high expenditure and special expertise. Similarly, using of questionnaires, as a sort of leading indicators, to measure the safety culture of workers or to test how the management acknowledge safety. Questionnaires should be clear and do not create misunderstanding in order to get the best result. However, repeating questionnaires during the same year may cause the exhaustion of workers.
1.4. Safety Performance Measurement
Literature[3],[5]&[6] contains a lot about characteristics of sufficient OSH measurements. The OSH measure should show the current performance level. Also it should be able to locate and identify problems' areas and predict future accidents and problems. Many papers[2],[5],[7] &[8] discussed how safety performance could be measured by a single indicator. Using a single indicator to measure OSH performance has many advantages. For example, it is powerful in monitoringthe improvement of a system. It also allows comparing between different sites or workplaces by the same measure. A single indicator can be easily understood and communicated. Moreover, it will be a powerful tool for decision making.Bu-Khamsin[1] has designed a computer-based safety performance Evaluation tool for contractors. He refers to the literature to identify the main important factors that affect safety performance of contractors, and then he classifies them to 20 main factors and 85 sub-factors. The model utilizes a dimensional weighting approach based on multiple criteria for measuring contractor safety performance. A survey is conducted to determine the weight assigned for each factor and sub-factor. The weights are determined as a result of the preference expressed by the contractors. A simple weighted sum of all ratings is used by a PC program where the user can enter the evaluation done to the company and get out the final score. The tool created by BuKamsin is a very simple tool, and it provides a systematic, structured approach for OSH evaluation. Cuny and Lejeune[7] discussed modeling of severity. Theyadopted a continuous scale to measure the severity by using the number of days lost for each accident rather than using discrete one. Then they suggestedcarrying out a statistical test to find the mean and standard deviation of the log normal fit of the distribution. Although their model is intelligent, however, it needs more than 20 records for each category in order to be appliedcorrectly. Thisis because it depends on the Central-Limit Theory applied to Normal Distribution model. It is considered as a lagging indicator.An attempt was carried out by Acikalin[8] to combine both risk assessment using accidents data and the evaluation of safety management in one model. He suggested that each organization shall carry out two types of risk assessment, one using accidents data and the other by evaluating management efforts. The writer evaluated safety management efforts by using a linear logarithmic formula to generate a management risk factor. The method relates the management risk factor and the risk assessment accident-based factor, and it states that the change of any of them will affect the overall measure. As the effectiveness of the management goes down the total risk of the establishment will increase. The model showed very convenient way to combine leading and lagging indicators. However, in the absence of accident data this method will not be applicable.Keren[9] has presented a discussion on how to evaluate safety performance within the facilities, among different number of facilities and across a whole type of industry. The aim was to develop a model for safety performance evaluation that will be independent from users’ opinion and will give a sort of standardization. She has created an index-aided model to measure safety performance of an organization using the science of multi-disciplinary decision making. Keren suggested a hierarchy scheme for OSH performance as the one used by the Management of Change (MOC) practice. She segregated the problem into layers, and then conducted a survey involving a panel of experts including six members to determine the relative importance of each attribute. Using AHP analysis,Keren has determined relative weightsforeach factor and sub-factor. Then shedesigned an evaluation form to measure OSH performance of workplaces. The overall performance rate is calculated by using simple weighted sum of all factors.
2. OSH Enforcement in Bahrain
2.1. Introduction
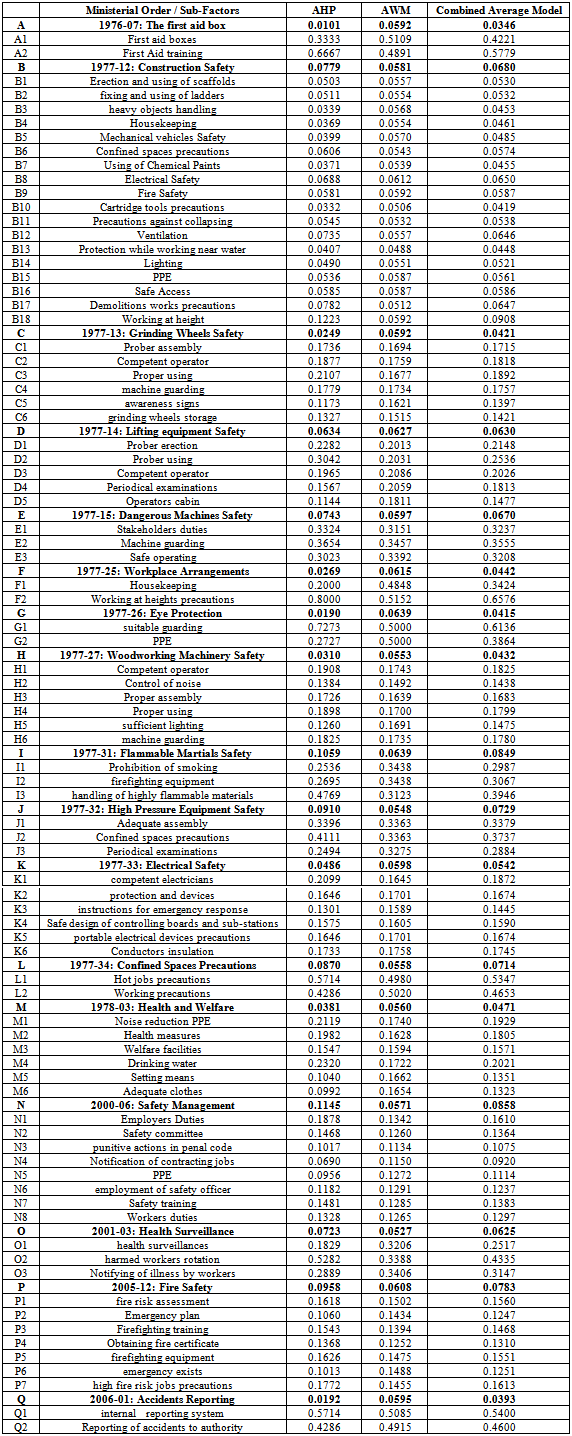
Table 1. Final weights found by the three models
 |
| |
|
Chapter 12 of the Labour Law of Kingdom of Bahrain for the private sectors(No. 23-1976( dealed with safety and health at work. This chapter stated the duties of employers and workers as well as the duties and powers of Ministry of Labour in that field. It gives the Ministry the power of imposing sanctions to the employers who failed to provide the necessary precaution to protect their workers from the hazards and risks raised from the working activities. Chapter 18 of the same law establishes the concept of labour inspection along with the power of the inspectors appointed forthat function. It also appointed the Minister of Labour to regulate the operation and policy of labour inspection[10]. Under the umbrella of this law there are 20 ministerial orders issued to regulate OSH at workplaces. These orders covered the management of OSH on establishment level, operations safety, health and welfare and fire prevention. Each Ministerial Order will be divided into a number of sub-factors (j), and each sub-factor consists of a set of legal articles that deal with the selected subject. For instance, the First Aid Ministerial order consists of 6 articles, it can be divided into 2 sub-factors as mentioned below, one is “Providing suitable first aid boxes” and the other is “First Aid training”. The first sub-factor will represent the articles numbers (1), (3) and (4) while the second one represents article (5) only. The rest of articles are usually describing administrative issues. These will guide the focus of the inspector rather than just seeking for the compliance of each article. Eighty four sub-factors were assigned to all articles included in the selected Ministerial Orders, (the Ministerial Orders and their sub-factors are shown in column 2 of Table 1).
2.2. Occupational Safety Section
Along with the dramatic developments in Bahrain, Ministry of Labour and Social Affairs established the “Occupational Safety Section” (OSS) as part of the Labour Directorate. It consisted of limited number of engineers and specialists to carry out the main duties. In 1976, the ministerial order number (8) issued by the Minister of Labour stated the functions of OSS section as follows:● Conduct periodical inspection for factories, establishments and various workplaces. The objective of visits is to provide both employers and workers with the necessary information and instructions to avoid work related hazards. Also these visits aim to enforce complying with OSH rules and regulations.● Investigating complaints communicated to the section regarding OSH violations in workplaces.● Organizing awareness activities to raise the preventive OSH culture among employers and workers.● Registration of occupational accident notifications sent by the employers or workers themselves.● Carry out occupational accident investigation.● Be aware of the latest studies and researches in the field of OSH.
2.3. OSS Procedures
OSS carries out its inspections on random basis. Different types of establishments or workplaces are selected and distributed among the team. There are no specialized campaigns based on the level of existing hazards or on the basis of past history. On field, the inspector will study the existing hazards and the level of risk based on his/her experience and will check out whether the measures taken by the establishment to protect workers are adequate enough. The inspector may question managers regarding the status of recent accidents and injuries. Photos of the workplace may be taken by the inspector to document any noticed violations to OSH regulations. The main reference for inspection is the Labour Law and OSH ministerial orders mentioned above. Based on field visits, OSH inspectors may decide upon the actions that will be taken to ensure complying with OSH standards and regulations as follows:● Initiate a verbal notice to the employer.● Initiate an “Improvement Notice” which is a written document showing the violations found on field and warning him/her to comply with rules.● Initiate a “Prosecution Notice”; a document to be transferred to the judicial authorities to decide upon the necessary judgment based on the local law.● Order for closure of the establishment totally or partially by prohibiting one operation or more.
3. OSH Measurement Modeling
3.1. Introduction
As mentioned previously, OSH factors and sub-factors should have relative weights or measures that can be used to establish a single measurement for OSH performance within the National Enforcement Model. The following sections will discuss the development of these relative weights, recalling that the main factors are the OSH Ministerial Orders, and the sub factors are the groups that subdividing the articles of each Ministerial Order as explained before.The review of the Kingdom of Bahrain OSH frame work showed that it is not suitable now to depend on accidents or injuries data to develop an evaluation model even on sector basis. This is because of the lack of accident data and the different definitions approved by the concerned parties, i.e. MOL and SIO. So building a leading measurement model using a multi-decision criterion will be the best option in order to help the OSH inspectorate to evaluate companies’ compliance with OSH standards and regulations.Two different methods aretested to select one for building a model, the Average Weights Model (AWM) and the Analytic Hierarchy Process (AHP) method. The Average Weights Model is a straight forward simple method to apply. The AHP analysis is a multi-criteria decision making tool,it is one of the best known methods in the multi-criteria decision making environment[11]. AHP assists the evaluator in dealing with complex situations. It has the ability to define the problem in a number of simple layers that can be compared independently of other layers designed in the problem. AHP does not require consensus, it can represent outcome from diverse judgment[9].Three models are used to find relative weights for OSH factors and sub-factors that affect the OSH performance in workplaces: one using simpleAverage Weights,another using Analytic Hierarchy Process (AHP), and a third model (Combined Average) created by finding the mean of bothAverage Weights and AHP.
3.2. Average Weights Model (AWM)
In order to build relative weights for all safety attributes that will be used in the model, i.e. OSH factors and sub-factors, the opinion of the customers, i.e. the companies, is sought.Following the methodology described by bu-Khamsin[1] a questionnaire is designed to find out the importance of each factor and sub-factor that affects safety and health performance. For the purpose of the questionnaire a scale from Zero, indicating no impact, to four,indicating very high impact, is used. The questionnaire is distributed for a sample of 150 selected companies. The sample is selected from manufacturing and construction companies that employ more than 100 workers as per the database of Ministry of Labour. The aim of this criterion is to insure that the selected companiesare well established and have at least one occupational safety officer or specialist in charge.Seventy one (71) replies are received from the distributed questionnaire.The collected responsesfrom the companies participated in the questionnaire are translated to relative weights using the following steps:1. The mean impact for each sub-factor is established by calculating the average importance from the questionnaire responses using the rating scale in the questionnaire (Very high = 4, High = 3, Moderate = 2, Low= 1, No impact = 0).2. The weight of each sub factor is determined by using: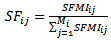 | (2) |
where;SFij is the weight of the sub factor j that is associated with the main factor i,SFMIij is the mean impact of the sub factor j that is associated with the main factor i,Mi is the number of the sub factors in the main factor i.3. The mean impact of the main factor is determined using: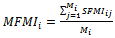 | (3) |
where;MFMIi is the mean impact of the main factor i.4. The weights of the main factors are calculated by using: | (4) |
where;MFi isthe weight of the main factor I, n isthe total number of main factors used.The weights are subject to the following constraints: | (5) |
and | (6) |
The final calculated relative weights for the Ministerial Orders and their associated sub-factors are included in column 4 of Table 1.
3.3. Analytic Hierarchy Process
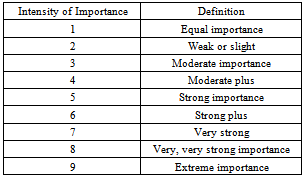
AHP method has the following steps as described by[12]&[13]:a. Define the problem.b. Structure the decision hierarchy. The top will be the goal which is OSH performance in our situation, then the objectives and sub-objectives.c. Construct the pair-wise comparison matrices.d. Use the priority weights calculated to determine the level of importance for each objective and sub-objective.Similar steps are followed in order to generate AHP relative weights for OSH factors and sub-factors selected as described above. AHP decisions’ matrices can be build using the user own opinion:a. Definition of the problem:The problem is how to calculate the safety performance of a company as a single measure by measuring the level of compliance with OSH regulations.b. Structure the decision hierarchy:The same classification done for all 17 selected OSH Ministerial orders are used as the structure of the decision hierarchy. The Ministerial Orders (main factors)are considered as the first level while the sub-factors are the second level. The decision tree is partially shown in Appendix.c. Construct the pair-wise comparison matrices:In order to build the matrices a questionnaire consists of 850 pair-wise questions is prepared and distributed for 15 selected OSH experts to evaluate individually the level of importance the 84 selected sub-factors.This step is inspired by the Model created by Kern[9]. The OSH experts are from different entities. Some of them work as OSH inspectors in Ministry of Labour, the OSH enforcement body, and some are either private consultants or work for an industrial firm in the field of safety and health. So, the AHP questionnaire seeks the opinion of independent parties.The concept of the pair-wise comparisons is to compare the relation between two choices with respect to each other. For example, the Ministerial Order No. 1977-15 which deals with safety of dangerous machines has 3 groups, i.e. sub-factors:1. Duties of designers, manufacturers, importers and exporters of dangerous machines.2. Providing adequate guarding.3. Safe operating of dangerous machines.So it must have a set of 6 pair-wise questions in order to decide upon the important group, the questions should be as follows:1. Which is more important “The duties of designers, manufacturers, importers and exporters of dangerous machines” or “Providing adequate guarding”?2. Which is more important “Providing adequate guarding” or “The duties of designers, manufacturers, importers and exporters of dangerous machines”?3. Which is more important “The duties of designers, manufacturers, importers and exporters of dangerous machines” or “Safe operating of dangerous machines”?4. Which is more important “Safe operating of dangerous machines” or “The duties of designers, manufacturers, importers and exporters of dangerous machines”?5. Which is more important “Providing adequate guarding” or “Safe operating of dangerous machines”?6. Which is more important “Safe operating of dangerous machines” or “Providing adequate guarding”?Table 2 illustrates the scale of comparison which indicates the level of importance for one element over another element with respect to the selected criterion.Table 2. AHP scale of comparison
 |
| |
|
Assume that aij is the value of comparison of element i with element j. aij will represent the ratio between the weights of element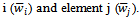 If the average weight for question 1 is 8, i.e.
  and that for question 2 is 2, i.e.
  will lead to that:
  and so on. Whenever j=i the element value aii=1 as the element is compared with itself.All the selected attributes are put into a matrix A to show the compared data as follows:
 | (7) |
where 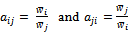 The result of all replies to the experts’ AHP questionnaires are collected and averaged to obtain the nearest best value for AHP scale.d. Calculating Priority Weights:The normalized matrix is calculated for matrix A by dividing each element by the sum of its column to find matrix B:
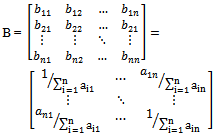 | (8) |
To find the final relative weight, the average of each row is calculated: | (9) |
To measure the inconsistency, matrix A is multiplied by the relative weight vector calculated above to produce vector C: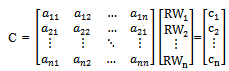 | (10) |
Then each element of vector C is divided with the corresponding relative weight to produce vector D: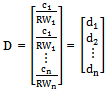 | (11) |
The average of vector D is calculated to obtain the value of the factor λ: | (12) |
Finally The Consistency Ratio for a vector with size n is calculated by the following formula: | (13) |
Where RI represents the random coherence index provided by Saaty[12] who recommends that if the CR value exceeds 0.10, the judgments should be reviewed. If not, that will verify the coherence of the relative weights calculated. As the available literature do not provide the RI value for matrix above size of n=10, the RI is derived using the equation developed byAlonso & Lamatafor any size of matrix n[14]. Applying the method mentioned above will result in the relative weights shown in column 3 of Table 1 for the Ministerial Orders and their associated sub-factors. The AHP calculated weights show consistency ratios within the feasible range which is less than 10%. This supports also the feasibility of the model.
3.4. Combined Average Model
As discussed before, the data collected and used inthe Average Weights Model represents the opinion of the companies while the one used in AHP model represents the opinion of independent OSH experts. The companies may be conservative about giving high importance to some OSH points especially if it requires high budget such as providing first aid training. Onthe other hand, experts are very ideal while dealing with OSH matters. To bridge that gap, it is worth to see the effect of combiningthe results by finding the average relative weights for OSH main factors and sub-factors foundabove. This combination generated what is called the Combined Average Model that may generate more acceptable relative weights for both companies and experts. The results of the Combined Average Model are shown in column 5 of Table 1.
3.5. Comparing the Generated Relative Weights
To compare the results of the three models, the relative weights produced by each modelare plotted as shown in Figure 1.It can be noticed that the relative weights generated by AWM are approximately evenly distributed among all selected OSH Ministerial Orders. This means that all Ministerial Orders have equal importance to the companies who responded to the survey. This is not always true, for sure that an OSH specialist will see that protecting people while working at height is more important than just providing First Aid Facility. On the other hand, the AHP relative weights show totally different distribution. AHP gives high importance to a number of Ministerial orders and varied with others, which means more realistic relative weights and more accurate results will be generated.It can be realized that the average weights of the Combined Average Model are in between the AWM and AHP relative weights. 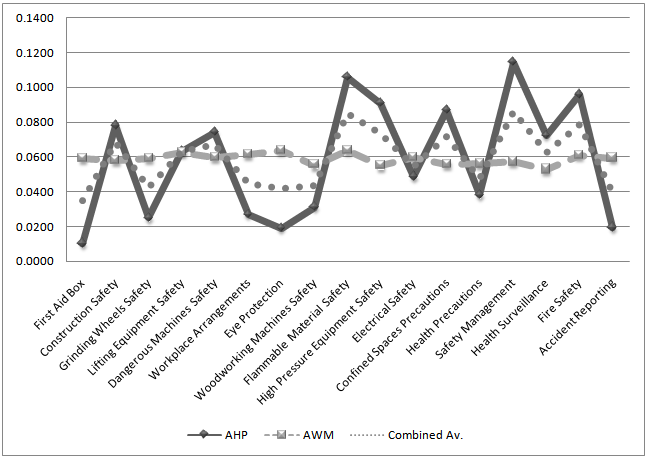 | Figure 1. Comparison between the models calculated weights |
3.6. OSH Performance Index
This step describes the numerical part of the OSH enforcement model by suggesting a method to calculate the OSH performance of an establishment. After deciding on a suitable relative weight for each main factor and sub-factor the performance calculation can be performed using a simple summation model as follows:a. The aggregate weight for the case is established usingBu-Khamsin’s[1]equation :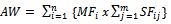 | (14) |
where:AW is the aggregate weight, MFi is the weight of the main factor i, n is the number of main factors, SFij is the weight of sub-factor j associated with main factor i, and m is the number of sub-factors. b. Then any non-applicable items are excluded to find the overall safety performance Index (SP%) by using: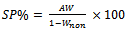 | (15) |
Where:SP is the Safety Performance Index as a percentage, Wnon is the weight of non-applicable sub-factors.After calculating the SP index, Figure 2 illustrates the criteria can be used to select the suitable legal action. The criteria was put in order to standardized the decision making process. It considered not to impose difficulties on the companies to comply with OSH regulation and not to endanger the life of the workers by let them expose to high risk conditions.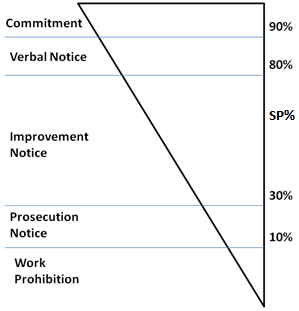 | Figure 2. Mapping of the SP index with legal actions |
If the score of the company is more than 90% then a commitment letter shall be issued for their high compliance with OSH regulations. If the SP% is between 80% and 90% then the OSH inspector can verbally instruct the company to rectify any minor violations found in the workplace such as non-providing enough first aid boxes.If the SP% lies between 30% and 80% an improvement notice shall be issued, which is a written notice states the violations found and the time allowed for the company to comply with OSH standards otherwise the company will be prosecuted.For the SP% between 10% and 30%, a prosecution notice shall be imposed as the score shows that there are major violations in the workplace. Finally, if the score is less that 10% it means that the company is totally not committed to OSH regulation and the workplace is very risky so a prohibition notice shall be issued and the work shall be stopped until the company rectifies all problems.The scoring system should reflect the size of the problem that a workplace is suffering. The actions are varied from the commitment letter to work prohibition for the most serious cases.
4. Models Validation
4.1. Validation Steps
To validate the models, the following steps are considered:1. Twenty cases are selected from the Occupational Safety Section Database, ten from the manufacturing sector and ten from construction sector. All the cases were inspected in 2011 by various OSH inspectors.2. The violations recorded by the inspectors and the approved decisionsare kept for final comparison.3. The inspectors are consulted in some cases in order to reflect thecorrect situation about the case.4. The final Safety Performance Indices are calculatedand the suitable legal actions are selected using the procedures of Section 3 for each of the three models.5. All resultsare communicated to the OSH inspectors from the Occupational Safety Section and to the Experts who joined the AHP questionnaire. The question is:Which model do you prefer and which one do you feel that is more realistic and fair?
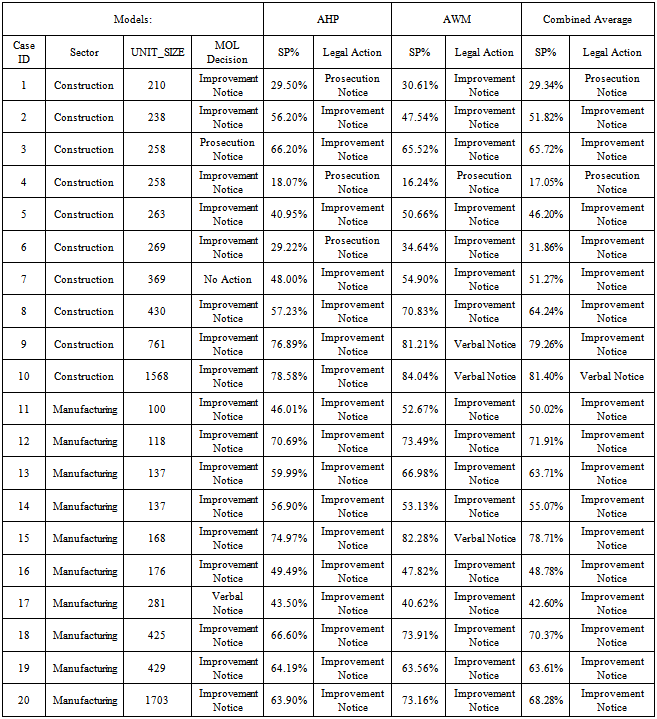
4.2. Validation Results
Table 3 shows the final results after calculating the Safety Performance Index using the weights found by AHP Model, Average Weights Model and Combined Average Model.The legal actions selected for the different cases tested by the models do not show big differences. They seem to be identical for most cases exceptfew of them. The Safety Performance Indices show slightly different values. This has led to some differences in the legal actions selected for cases at marginal limits of the mapping criteria of Figure 2.Comparing these legal actions with the decisions taken by MOL inspectors, it can be noticed that there are no significant difference between taken decisions and models results. Most of the companies are given “Improvement Notice” while the inspectors agreed about the OSH existing violations. There is only one case prosecuted for its past history of non-compliance with OSH regulations. MOL database shows one case with no disciplinary actionbeing taken while there are existing OSH violations.
4.2.1. The View of OSH Inspectors
The view of the OSH inspectors in MOL is that the AWMModel is reducing the legal actions which may not be very helpful in their duty. They see that either the AHP or theCombined Averagemodel could be applied. Also, they expressed that the results and the legal actions may not vary from the actions taken by the inspectors themselves but it will create a standard method for decision making.
4.2.2. The View of OSH Experts
The experts generally agree with OSH inspectors. However, they prefer to use the weights calculated by AHP model. The reason they expressed is that AHP weightsare more realistic than the Average Weightsbecause it differentiates between the Ministerial Orders, i.e. the main factors. Such differentiation is not shown by the weights of Average Weights Model.As an example the case of the first aid Ministerial Order is rated the same as the construction safety Ministerial Order. As per the prospective of the experts that could not be acceptable because the risk from violating safety measures in construction sector is morethan that of not providing first aid box.Generally, the model shows the ability to assist the inspectorate to standardize the safety inspection procedure and to promote consistency and fairness.Table 3. Models Validation Results
 |
| |
|
5. Conclusions
The paper shows that the developed numerical method and the relative weights build up using the AHP give valid results and reasonable evaluation to OSH in workplaces. They also make an easy and understandable approach in this regard. The model shows the ability to standardize the inspection work carried by OSH inspectorate. Applying such model may promote consistency and fairness and increase the level of trust between the inspectorate and employers.By testing the validation of the models, the AHP method shows more accurate relative weights over the AWM; it clearly distinguishes between the high ranked violations and other minor ones. The decisions selected by the model are valid and accepted by both the OSH experts and OSH inspectors who are consulted.
Appendix
Part of AHP structure chart: 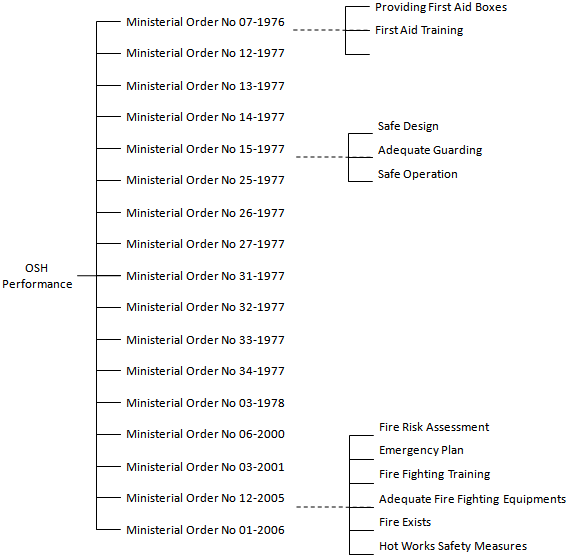
References
| [1] | Bu-Khamsin, Mohamed Ali Saleh.Safety Performance Measurement - A PC-Based Evaluation Tool for Industrial Contactor in Saudi Arabia. King Fahd University of Petroluem & Minerals. 1999. M.Sc Thesis. |
| [2] | Suddle, Shahid. The Weighted Risk Analysis. Safety Science. 2009, Vol. 47, pp. 668-679. |
| [3] | The Measurement of Health and Safety Conditions at Work. Giovanis, Nikolaos. 2010, International Reserach Journal of Finance & Economic, Vol. 36, pp. 87-95. |
| [4] | What is Wrong with Risk Matrices. Cox, Lousi Anthony. 2008, Risk Analysis, Vol.28, pp. 497-512. |
| [5] | Methodology to Develop an Effective Safety Performance Measurement Technique. Ahmad, R Kunju, Gibb, A.G.F and McCaffer, R. Hughes: University of Reading, 1998. 14th Annual ARCOM Conference. pp. 183-191. |
| [6] | Baig, Mirza Mansoor.Safety Assessment in Industrial Construction Projects in Saudi Arabia. King Fahd University of Petroluem & Minerals. 2001. M.Sc Thesis. |
| [7] | Occupational Risks and the Value and Modelling of a Measurement of Severity. Cuny and Lejeune, M. 1999, Safety Science, pp. 213-229. |
| [8] | Intergration of Safety Management Effectivenss into QRA Calculation. Acikalin, Aydan. 2009, Process Safety Progress, Vol. 28(4), pp. 331-337. |
| [9] | Keren, Nir.Models for Multi-Strata Safety Performance Measurement in the Process Safety. Texas A&M University. 2003. PhD Dissertation. |
| [10] | MOL.Labour Legislations. Manama : Ministry of Labour, 1985. |
| [11] | Using the Analytic Hierarchy Process for Decision Making in Engineering Applications. Triantaphyllou, Evangelos and Mann, Stuart H. 1995, International Journal of Industrial Engineering: Application and Practice, Vol. 2 (1), pp. 35-44. |
| [12] | Decision Making with the Analytic Hierarchy Process. Saaty, Thomas L. 2008, International J. Services Science, pp. Vol.1, 83-98. |
| [13] | How to Make a Decision: The Analytic Hierarchy Process. Saaty, Thomas L. 1990, European Journal of Operational Resrearch, Vol. 48, pp. 9-26. |
| [14] | Consistency in The Analytic Hierarchy Process; A New Approach. Alonso, Jose Antonio and Lamata, M Teresa. 2006, International Journal of Uncertainty, Fuzziness and Knowlege-Based Systems, Vol. 14 (4), pp. 445-459. |
 Abstract
 Reference
 Full-Text PDF
 Full-text HTML