-
Paper Information
- Paper Submission
-
Journal Information
- About This Journal
- Editorial Board
- Current Issue
- Archive
- Author Guidelines
- Contact Us
Regent Journal of Business and Technology
2024; 1(1): 31-35
doi:10.5923/j.rjbt.20240101.02
Received: Mar. 30, 2024; Accepted: Apr. 26, 2024; Published: Jul. 19, 2024

Investigating the Relationship between Financial Risk Ratios and Earnings Management of Companies Listed on the Tehran Stock Exchange
 Abstract
 Reference
 Full-Text PDF
 Full-text HTML
Kianoosh Esmaeilpoortehrani, Alireza Maetoofi
Azad University of Aliabad Katool Branch, Golestan, Iran
Correspondence to: Alireza Maetoofi, Azad University of Aliabad Katool Branch, Golestan, Iran.
| Email: |  |
Copyright © 2024 The Author(s). Published by Scientific & Academic Publishing.
This work is licensed under the Creative Commons Attribution International License (CC BY).
http://creativecommons.org/licenses/by/4.0/

Given the issue of separation of management from ownership, managers guide the movement of the company and are trying to create a better future at every moment. Thus, they select a method that maximizes the company's benefits and utility from among the existing methods. The issue of conflict of interest and managers' exclusive access to a part of the information, and the preparation and presentation of information such as financial information, increase the motivation of service compensation so managers seek their benefit. Hence, the possibility of earnings manipulation increases. Earnings manipulation displays a different picture of the company's future regarding the continuity of activity, flexibility, and fulfillment of its obligations, which are referred to as financial risk. Thus, the present study investigates the relationship between financial risk ratios and earnings management of companies listed on the Tehran Stock Exchange between 2017 and 2020. Panel data regression and fixed effects model were used for this purpose. In this regard, 96 companies were selected as the statistical sample of the study using Cochran's formula. To investigate earnings management in this study, discretionary accruals criteria were used. According to the statistical tests used to test the research hypotheses, an inverse and significant relationship were found between financial leverage and earnings management. Also, a positive and significant relationship was observed between the results of Altman's bankruptcy prediction model and free cash flow and earnings management as a dependent variable.
Keywords: Financial Risk, Financial leverage, Earnings management, Bankruptcy, Free cash flow
Cite this paper: Kianoosh Esmaeilpoortehrani, Alireza Maetoofi, Investigating the Relationship between Financial Risk Ratios and Earnings Management of Companies Listed on the Tehran Stock Exchange, Regent Journal of Business and Technology, Vol. 1 No. 1, 2024, pp. 31-35. doi: 10.5923/j.rjbt.20240101.02.
Article Outline
1. Introduction
- The management of a business unit is responsible for preparing financial statements, and they may adjust earnings for various reasons. Financial analysts often view reported net earnings as distinct from accounting earnings due to the potential for manipulation by managers (Makaram and Roberts 2020). Users of financial statements are aware that earnings can sometimes be manipulated. The extent of users' understanding of the reliability of earnings can help them make more informed decisions (Palepu et al 2011) Investors pay close attention to earnings, leading company managers to smooth and manage earnings to take advantage of investor behavior (Shojaei, 2011).Regarding the management criteria (such as earnings smoothness), earnings are considered high-quality that is less managed, the effect of bad news is reflected in it and has a strong association with the stock price (Bulo and Mirzaei, 2007). Given the conflict of interests between information providers and investors, the use of estimates in the calculation of some elements of earning and loss, the possibility of using various accepted accounting methods, and issues such as smoothing and earnings management threaten the use of earning as a criterion for decision-making. This issue highlights the need to examine earnings management (Asghari, 2010). In other words, the earning and loss statement reflects the performance of the business unit and includes the returns from resources under the control of the business unit's management. It might result in earnings management (earnings smoothing) for various reasons (Poorheidari, 2014). According to Kilestic etal’s, cash is one of the elements that management can manipulate in smaller economic units, making it a more practical measure of the business unit's economic performance. Therefore, business units experiencing poor performance may be more inclined to boost their reported earnings through earnings management (Kilestic et al 2021). In contrast, the possibility of adoption of methods to artificially increase earnings by management will be less in the business units that have used good performance (Asghari, 2011). Regarding the relationship between financial statements in financial management, they use a tool called analysis of financial ratios (Nikoomram et al., 2006). It is possible to analyze the probability of the occurrence of risk phenomena through some ratios by establishing a relationship between the variables of financial statements. These elements in this study will be considered under the title of financial risk ratios to examine the phenomenon of earnings management. Earnings management considers accounting accruals (Salahudin et al., 2014). Company size, bonus, and debt-to-capital ratio are considered among the factors affecting accounting accruals. A high debt-to-capital ratio can prompt companies to engage in earnings management. Alkaran etal found that as the debt-to-capital ratio rises, management is more likely to choose earnings-enhancing strategies (Alkaran et al., 2023).The provided results explores the impact of earnings management on financial statements and the potential consequences for investors and decision-making. However, there is a gap in existing research regarding the relationship between specific financial risk ratios and earnings management across various industry sectors and market conditions. Most research has focused on general trends and broad categories, but there is limited investigation into how the explanatory power of financial risk ratios may vary across different industries, company sizes, and market environments. A more nuanced understanding of how financial risk ratios influence earnings management within specific contexts could provide valuable insights for both investors and managers. Additionally, there is an opportunity to study the long-term effects of earnings management on a company's financial health and investor trust, particularly in terms of how earnings management may affect sustainable growth and market stability over time.
2. Methodology
- The method of the present study is applied, descriptive-analytical, and post hoc. The statistical population of this study is the companies listed on the Tehran Stock Exchange from 2017 to 2020. Accordingly, 135 companies that have the mentioned characteristics were considered members of the statistical population. Given the dependent variable and the type of research, the sample size of the research was considered 96 companies. Thus, the total number of observations during 5 years is 480 companies. The summary sheet and table were used to classify and determine the studied variables. Since the theoretical basis of this study has been implemented in two countries, Malaysia and Thailand, to examine the research model, we will act as follows to examine this model in the Tehran Stock Exchange:Where,
 Definition of variables (Selahudin et al., 2014)TACCit: earnings management (discretionary accrual items) = Y.LEVit: leverage ratio = T1.DISTRESSit: Bankruptcy (according to Altman's model) = T2.FCFit: free cash flow = T3.The measurement of variablesY: research dependent variable = earnings management or total accruals (TACC); Accrual variable, according to Decho et al.'s (1995) research and the Jones model, is defined as the following formula:
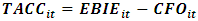 Where, EBIE: Earnings before unexpected items, CFO= operating cash flow, TACC= total accruals (left side of main equation).The following formula is used to calculate accruals (Selahudin et al., 2014):
 = Changes in revenue from the previous yearTAit-1= total assets of company i at the end of the previous yearPPEit= property, machinery, and equipment amount
 changes in accounts receivable from the previous year until nowTACCit= total accruals of company i in year t(Ts)= the independent variables of the researchLeverage variables, bankruptcy prediction model variables, and free cash flows (Selahudin et al., 2014):T1 = leverage ratio variable (LEV), which means debt ratio in this study:
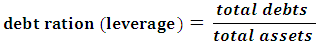 T2= The variables of the bankruptcy prediction model (DISTRESS) in this research were considered bankruptcy prediction based on the Altman model, so the variables of this bankruptcy prediction model are:
 x1: Working capital to total assets, x2: accumulated earnings to total assets, x3: earnings before interest and tax to total assets, x4: market value of equity to total debts, x5: sales to total assets.T3 = free cash flows, which is obtained from the following formula based on Asghari's research (2013) in this study:
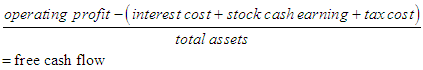 Classification of variables Y: dependent variable; T1: The first independent variable, T2: The second independent variable, T3: The third independent variable.Linear regression relation:
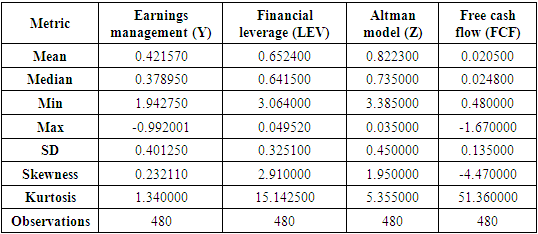
 Relation measurement Y = It is estimated through multivariate regression estimation by estimating α and β parameters.After collecting relevant information, Excel spreadsheet software is used to classify information and calculate variables. Finally, Eviews software is used to analyze descriptive statistics, normality of data, and normality of errors, testing hypotheses, and analyzing the data.Table 1 shows central and dispersion indices:
|

|
3. Determining Multi-Collinearity
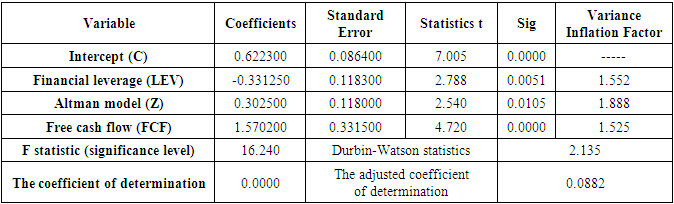
- The variance inflation factors in the last column of Table 2 are all below 5, indicating acceptable values. This suggests that there is no collinearity issue between the independent variables, which supports the use of regression analysis. Based on the adjusted coefficient of determination, the model explains approximately 8.8% of the changes in the dependent variable through the changes in the independent variables. The Durbin-Watson statistic is 2.135, which falls within the range of 1.5 to 2.5. This indicates there is no autocorrelation among the errors in the regression model, and the model's errors are random.The estimated coefficient of the independent variable of financial leverage (LEV) demonstrates a significant and inverse relationship between financial leverage and earnings management at the 0.05 error level. With a t-value of -2.788 and a significance level under 5%, it can be confirmed that there is a significant inverse relationship between financial leverage and earnings management at the 95% confidence level.The estimated coefficient of Altman's bankruptcy prediction model (Z) reveals a significant positive relationship between Altman's bankruptcy prediction model and earnings management at the 0.05 error level. Given its t-value of 2.540 and a significance level under 5%, there is a significant positive relationship between Altman's bankruptcy prediction model and earnings management at the 95% confidence level. The estimated coefficient of the independent variable of free cash flow (FCF) demonstrates a significant relationship between free cash flow and earnings management at the 0.05 error level. With a t-value of 4.720 and a significance level under 5%, there is a significant positive relationship between free cash flow and earnings management at the 95% confidence level.
4. Results and Discussion
- The results showed revealed an inverse and significant relationship between financial leverage and earnings management. The results of this study are consistent with those of the study conducted by Hashemi and Kamali. Hashemi and Kamali (2021) stated that high financial leverage potentially increases earnings management through the use of earnings accruals and other earning-increasing accounting choices. For managers who have willing to manage earnings, paying attention to leverage ratios is crucial since it combines different effects (Selahudin et al., 2014).Based on Aman (2008), there is no significant difference between leverage and earnings management. Also, companies with large leverage ratios manage earnings to violate debt contracts (Chen and Liu, 2010). Accordingly, the managers select certain methods among the available methods to neutralize the possible effects such as debt contracts so they can still get their desired earnings as a result of their performance to continue the company's activity away from any internal and external borrowing risk. It was a logical expectation based on the results of this study. The results also revealed a positive and significant relationship between the results of Altman's bankruptcy prediction model and earnings management. The results of this study are inconsistent with those of the study conducted by Ahmadpour and Shahsavari (2016).They examined the relationship between earnings management and the financial incapacity of companies. The results showed a strong and positive correlation between the research variables regarding real earnings smoothing. However, no significant relationship was observed between the research variables regarding artificial earnings smoothing (Ahmadpour and Shahsavari, 2016).According to the theoretical foundations, financial helplessness causes financial concern for the government and shareholders since it will reduce financial performance and may finally lead to bankruptcy or increased costs. If a company experiences financial failure, it may not fulfill its business obligations and not pay the bonus of managers. Thus, managers select certain methods among the existing methods to neutralize the possible effects of the risk of facing bankruptcy, so they can manage their desired earnings as a result of their performance in addition to managing the company. Based on the results, this was the logical expectation. Additionally, a positive and meaningful relationship was found between free cash flow and earnings management. These results are inconsistent with those of Kardani and Sinaei (2018). However, these results are consistent with those of Sari et al (2021), and Panata et al. (2020).Cohen and Zarvin (2015) stated that manipulation of real activities is not a means of changing the arrangement of accounts. In this method, managers change the time of operations, the way of allocating resources, or the time of implementation of investment projects. Earnings management activities based on accruals are not directly associated with cash flow implications (Cohen and Zarvin, 2015). Thomas and Zhang (2000) presented evidence about the manipulation of real activities through overproduction. In other words, managers produce more than the required level for sales and the normal level of inventory. Hence, they underreport the cost of goods sold, resulting in increased reporting of earnings. Although this strategy improves the profitability margin, the company incurs costs, and the normal level of operating cash flows of the company decreases (Thomas and Zhang, 2000).Gholinezhad and Jafari (2015) stated that companies with good performance are willing to manipulate earnings to reduce it. However, the rate of earnings management in portfolios with positive operating cash is generally at a low level. Also, the results show that companies with poor performance are willing to manipulate earnings to increase them (Gholinezhad and Jafari, 2015). Salehi etal and (2017) concluded that there is a significant and direct relationship between earnings management and free cash flows. In other words, the free cash flows of companies can be considered as a stimulus for earnings management (Salehi etal 2017). Free cash flow may cause agency problems. Agency problems are worst when investment opportunities are few and the company has many free cash flows since their use raises doubts about the conflict of interest regarding how to select growth and investment opportunities.Hence, managers select certain methods among the available methods to neutralize the possible effects of agency problems so they can still manage the earnings as a result of their performance. Therefore, the relationship between these two elements was logical. Based on the results, it is recommended to pay attention to the total accruals instead of its discretionary accruals in using leverage ratio and earnings management, so the effects of creating debt can be investigated better than before. It is also essential to improve the level of financial knowledge of managers to make correct decisions about capital expenditures. This issue will lead to more coherent planning to deal with financial incapacity, so the optimal level of borrowing and cash will be accessible for the company in advance and solve the problem of financial incapacity regarding cash. Accordingly, the effect of financial risk ratios on earnings management is investigated.
5. Conclusions
- • In conclusion, the study highlights a significant inverse relationship between financial leverage and earnings management, emphasizing the importance of monitoring leverage ratios to manage earnings effectively and mitigate potential financial risks.• The results align with some prior research, suggesting that companies with high financial leverage may be more prone to earnings management through accrual adjustments to fulfill their financial obligations and achieve desired performance.• Inconsistencies with other studies highlight the complexity of the relationship between free cash flow, financial leverage, and earnings management, underscoring the need for further research to understand the nuances in different contexts.• It is recommended that companies pay attention to total accruals rather than discretionary accruals when assessing leverage ratios and earnings management, to better understand and manage debt effects.• Improving managers' financial knowledge and planning for optimal borrowing and cash management is crucial for addressing financial incapacity and achieving sustainable company performance while avoiding internal and external borrowing risks.