Razafindravao Charline Roberte
Chemistry Department, Ressources and Environment, University of Antsiranana Faculty of Science, Madagascar
Correspondence to: Razafindravao Charline Roberte , Chemistry Department, Ressources and Environment, University of Antsiranana Faculty of Science, Madagascar.
| Email: |  |
Copyright © 2025 Scientific & Academic Publishing. All Rights Reserved.
This work is licensed under the Creative Commons Attribution International License (CC BY).
http://creativecommons.org/licenses/by/4.0/

Abstract
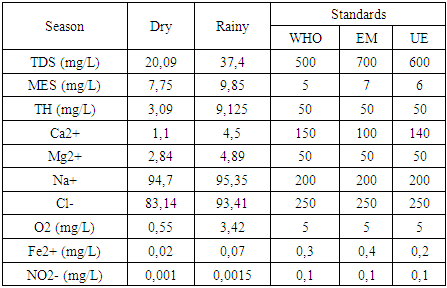
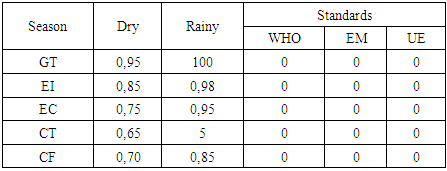
The district of Antsohihy is the capital of the SOFIA region, located between the geographical coordinates of 14°89' south latitude and 47°99' east longitude, at an altitude of 23 meters. It covers an area of 4,787 km² and has a population of 250,532. In terms of physical parameters, the pH is 6.53 during the dry season and 6.69 during the rainy season; pH values in both seasons are within norms. Temperature is 25.62°C in the dry season and 27.075°C in the rainy season; temperatures in both seasons are deemed inadequate. Turbidity is 1.88 NTU in the dry season and 1.9 NTU in the rainy season, and these values are considered acceptable for drinking water. In terms of chemical parameters, TDS is 20.9 mg/L in the dry season and 37.4 mg/L in the rainy season, indicating good water quality. TSS is 7.750 mg/L in the dry season and 9.85 mg/L in the rainy season, indicating good water quality. TH is 3.093 mg/L in the dry season and 9.125 mg/L in the rainy season, showing low calcium and magnesium content. The Ca2+ concentration is 1.1 mg/L in the dry season and 4.5 mg/L in the rainy season, indicating a calcium deficiency. The Mg2+ concentration is 2.84 mg/L in the dry season and 4.89 mg/L in the rainy season, indicating a low magnesium content compared with standards. Na+ is 94.7 mg/L in the dry season and 95.35 mg/L in the rainy season, making the water acceptable in both seasons. Cl- is 83.04 mg/L in the dry season and 93.41 mg/L in the rainy season, confirming good water quality throughout the year. O2 concentration is 0.55 mg/L in the dry season and 3.42 mg/L in the rainy season, with no sign of pollution. The Fe2+ concentration is 0.02 mg/L in the dry season and 0.07 mg/L in the rainy season, indicating the absence of toxic risks. Finally, the NO2- concentration is 0.001 mg/L in the dry season and 0.0015 mg/L in the rainy season, with no associated toxic risks. With regard to microbiological parameters: for GT 0, the standard is acceptable in the dry season, but rejected in the rainy season with a threshold of 100 MPN/100 mL; IE must be less than 1 MPN/100 mL in the dry and rainy seasons, but the values observed in both seasons do not meet the standards; EC must be less than 1 MPN/100 mL in the dry and rainy seasons, but both values measured are outside the standards for drinking water; CT must be less than 1 MPN/100 mL in the dry season and 5 MPN/100 mL in the rainy season, but both values are not acceptable; finally, CF must be less than 1 MPN/100 mL in the dry and rainy seasons, but both results are also excluded from drinking water standards.
Keywords:
Water, Physico-chemical, Microbiological parameters
Cite this paper: Razafindravao Charline Roberte , Comparative Analysis of Physico-Chemical and Microbiological Parameters of Well Water During the Dry and Rainy Seasons in the Tsaramandroso Neighborhood, Located in the Antsohihy District, Sofia Region, Resources and Environment, Vol. 15 No. 1, 2025, pp. 6-10. doi: 10.5923/j.re.20251501.02.
1. Introduction
The district of Antsohihy is the capital of the SOFIA region, located between the geographical coordinates of 14°89' south latitude and 47°99' east longitude, at an altitude of 23 meters. It covers an area of 4,787 km² and has a population of 250,532.The objective of our research work is entitled “Comparative analysis of physico-chemical and microbiological parameters of well water during the dry and rainy seasons in the Tsaramandroso district, located in the Antsohihy district, SOFIA region”. This study is structured as follows: a bibliographical synthesis including physico-chemical parameters, materials and methods of analysis, results and corresponding discussions, ending with a conclusion.
2. Literature Review
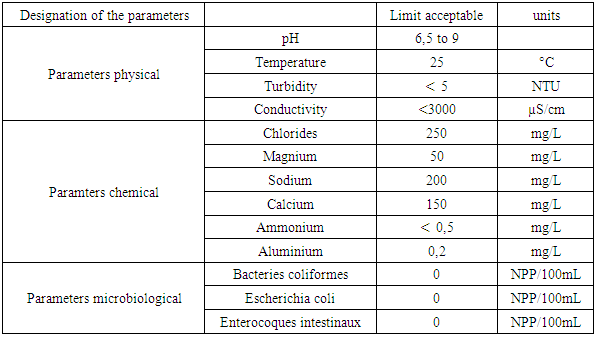
Groundwater represents the main reserve of continental freshwater, and humanity depends on the availability and quality of this limited resource. Today, water supply is a crucial issue in various sectors of daily life, due to the increasing population and its standard of living. Water intended for consumption requires verification of three essential parameters: physical characteristics, chemical criteria and the presence of pathogenic germs.a- Physical parametersTemperature influences the solubility of salts, with the required drinking water concentration below 25°C. Turbidity determines whether the water is clear or turbid, with the content required to be less than 5 NTU. As for pH, its value in water intended for human consumption must be between 6.5 and 9.b- Chemical parametersTDS: measures the level of salinity in the water. Although the value obtained is not exact, the concentration remains low in drinking water. TH: water hardness, which depends on calcium and magnesium content, must be less than 50°f. Calcium: the concentration required in drinking water varies between 100 mg/L and 140 mg/L. Magnesium: concentration must be equal to 50 mg/L. Sodium: its concentration in water varies between 150 mg/L and 200 mg/L. Chloride: its concentration in drinking water is 250 mg/L. Dissolved oxygen: although the value is not exact, the concentration limit is 5 mg/L.c- Pathogenic germs The total germ count is used to assess water pollution and the total bacterial load; for water to be considered clean, the count must be zero. The total coliform count refers to a heterogeneous group of bacteria of fecal and environmental origin; for drinking water, their number must also be zero. Fecal coliform counts indicate fecal contamination of the water. Finally, the presence of Escherichia coli in water suggests fecal contamination and a potential risk of pathogenic microorganisms.a- Norm of quality Recommendation of the EMRecommendation of EU Recommendation of the WHORecommendation of the EM [1]Table 1. Drinking water standard according to the Malagasy State (EM)
 |
| |
|
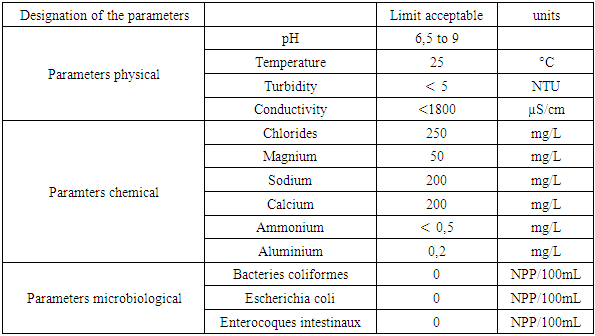
Recommendatin of the EU [1]Table 2. Drinking water standard for the European Union (EU)
 |
| |
|
Recommendation of the WHO [1]Table 3. Drinking water standard for the World Health Organization (WHO)
 |
| |
|
3. Materials and Methods
For physical parameters: a thermometer is used to measure temperature, a pH meter to determine pH, and a turbidimeter to assess turbidity.For chemical parameters: colorimetry is used for dosing, where measurement is based on color change, as for calcium and magnesium. Spectrophotometers allow direct reading of concentrations, notably for sodium and total iron. In the UV-visible range, the spectrophotometer is used to determine nitrite and ammonium concentrations.For pathogens, the M-endobross is used to measure total and fecal coliforms, incubated at 37°C and 44°C respectively for 24 hours, while the MFC is incubated at 37°C for 48 hours. Finally, the Mac Grady table is used to determine the number of total coliforms and Escherichia coli present in 100 mL of sample.
4. Results and Discussion
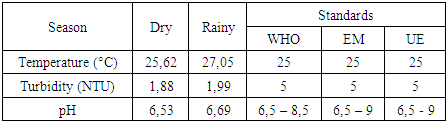
a- Physical parametersThe summary of physical parameters during the dry and rainy seasons is presented in the following table:Table 4. Phisycal parametrs
 |
| |
|
Curve representing the result: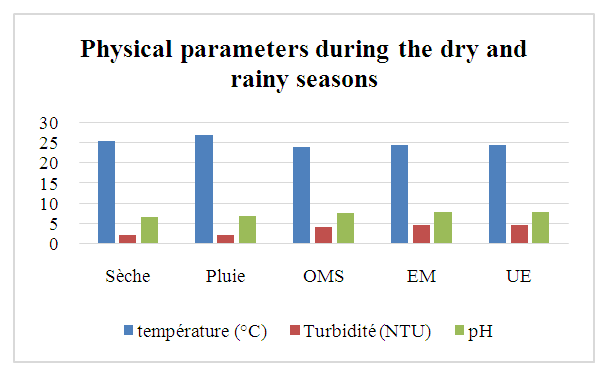 | Figure 1. Physical parameters during the dry and rainy seasons |
b- Chemical parameters:The results of the chemical parameters obtained during the dry and rainy seasons are summarized in the table 5 below:Table 5. Chemical parameters
 |
| |
|
Curve illustrating results as a function of chemical parameters: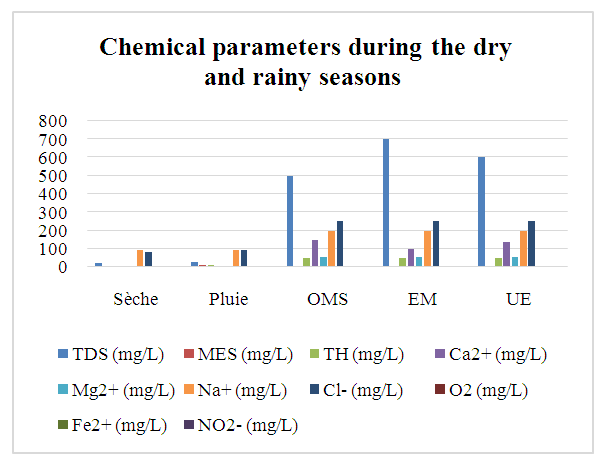 | Figure 2. Chemical parameters during the dry and rainy seasons |
c- Microbiological parametersThe results of microbiological parameters obtained during the dry and rainy seasons are summarized in the table below.Table 6. Microbiological parameters
 |
| |
|
Curve illustrating results as a function of microbiological parameters: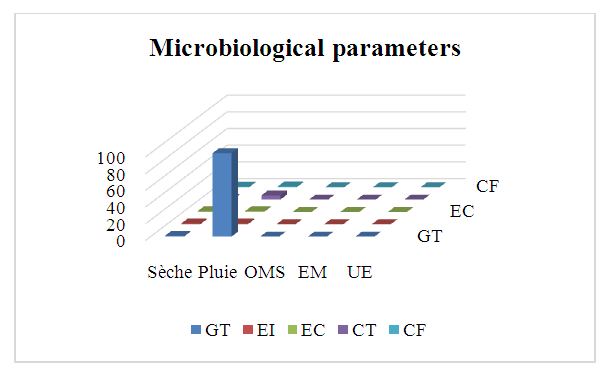 | Figure 3. Microbiological parameters |
5. Discussion
Physical parameters:Temperature: the value obtained is excluded for both seasons, as it exceeds 25°C.Turbidity: the two values measured comply with drinking water standards, as they are less than 5 NTU.pH: the two values obtained for both seasons comply with the criteria for water intended for human consumption.In physical terms, therefore, the water is of good quality despite the concentration of temperature during the rainy season. [1], [2], [3].Chemical parameters:For TDS: the values observed are low for both seasons, but remain acceptable for drinking water, as the standard imposed for the latter is less than 500 mg/L.For TSS: both measured values exceed the authorized drinking water limit of 5 mg/L, which rules out these values.For TH: the values found for both seasons are low, acceptable but insufficient for drinking water.Calcium: the concentration is very low, as the drinking water standard requires a concentration of 150 mg/L.For magnesium: the concentration measured is also very low compared with the 50 mg/L standard required for drinking water.For sodium: the concentrations measured for both seasons comply with the requirements for water intended for human consumption.For chloride: measured concentrations comply with requirements for drinking water.For dissolved oxygen: the concentrations observed for both seasons comply with the requirements for drinking water.For iron: the concentration measured complies perfectly with the standard required for water intended for human consumption.In conclusion, although certain concentrations are insufficient, the water is considered potable from a chemical point of view. [4], [5], [6], [7], [8], [9].For microbiological parameters:According to the results obtained, the water is contaminated with micro-organisms and needs to be treated before use. I therefore suggest a sodium hypochlorite treatment for disinfection.Chlorination treatment of drinking water, using the break-point chlorination method, is a commonly used method for disinfecting water by eliminating pathogenic microorganisms. This method is based on the progressive addition of chlorine to the water up to a point where the chlorine demand is fully satisfied, and beyond this point, effective disinfection is achieved. [10], [11], [12], [13], [14], [15].Principle of the Break-Point methodChlorination is used to kill micro-organisms through the oxidizing action of chlorine. However, water often contains organic and inorganic matter which reacts with chlorine, forming intermediate compounds such as chloramine (NH2Cl) and other chlorides.The break-point chlorination method involves adding chlorine to the water until all chlorine demand is met, then adding even more chlorine to achieve complete disinfection. Here's how it works:Adding chlorine to water: Initially, chlorine reacts with organic and inorganic matter in the water. This creates chloramines (NH2Cl) and other intermediate compounds. This constitutes the “chlorine demand” or chlorine consumption.Saturation point: As chlorine is added, it reacts more and more with these substances. The concentration of free chlorine decreases, and at a certain point, all the chlorine added is used for this reaction. At this point, chlorine demand is satisfied.Break-point: When chlorine addition exceeds chlorine demand, excess free chlorine appears in the water. This is known as the break-point. At this point, chloramines (and other reactive organic compounds) are destroyed, and the excess free chlorine begins to act as an effective disinfectant.Complete disinfection: Beyond the breakpoint, water becomes effectively disinfected, and the excess free chlorine concentration ensures pathogen destruction.Break-point chlorination curveA typical break-point chlorination curve is obtained by plotting the concentration of free chlorine (in mg/L) against the dose of chlorine added (in mg/L). Here are the various stages of the curve:- Zone 1: Initially, free chlorine concentration falls rapidly as chlorine is used to react with organic and inorganic matter in the water (chlorine demand).- Zone 2: Then, free chlorine concentration reaches a plateau (saturation), indicating that all chlorine demand has been met.- Zone 3: When the chlorine dose continues to increase beyond this plateau, a rapid increase in free chlorine concentration is observed, marking the breakpoint.- Break-point: This is the point at which the concentration of free chlorine begins to rise rapidly and exponentially. This indicates that excess chlorine has become available for disinfection.Importance of the Break-Point method- Efficiency: This method ensures that the water is disinfected, with total elimination of pathogenic microorganisms.- Control of free chlorine concentration: After the breakpoint, excess free chlorine is controlled to prevent over-chlorination (which can be harmful to health or the environment). | Table 7. Chlorination dosage cuve |
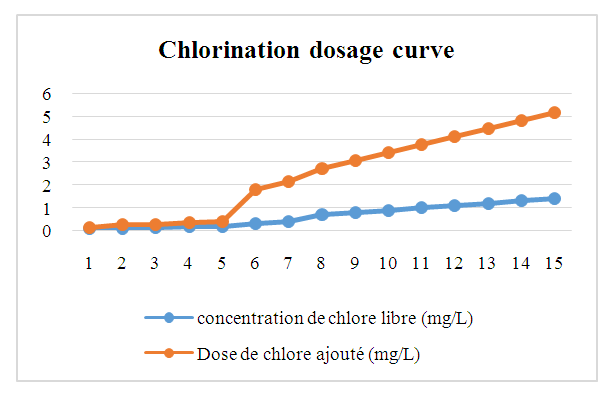 | Figure 4. Chlorination dosage curve |
Explanation of curve zonesZone 1 (from 1mg/L to 2mg/L Chlorine demand): Initially, the water contains organic and inorganic matter that consumes the added chlorine. The concentration of free chlorine is low.Zone 2 (from 2mg/L to 4.5 mg/L Saturation): Chlorine demand is saturated, and the concentration of free chlorine no longer changes significantly. At this stage, the amount of excess chlorine is still insufficient to ensure complete disinfection.Zone 3 (from 4.5 mg/L to 6 mg/L Break-point): The addition of excess chlorine leads to the destruction of intermediate compounds such as chloramines and an increase in the concentration of free chlorine. This is where effective disinfection begins.Chlorination treatment of drinking water using the break-point method is a well-established technique for guaranteeing water disinfection, ensuring that excess free chlorine remains available to kill pathogens. The chlorination curve, showing the different phases of the reaction of chlorine with the substances present in the water, makes it possible to determine the exact moment when the water reaches optimum disinfection.In my research, I suggest using a chlorine dose of at least 5 mg/L to eliminate pathogens, so that people can drink the water in complete safety.
6. Conclusions
According to the results of analyses carried out during both the dry and rainy seasons, water quality is satisfactory in terms of physical parameters, despite temperatures exceeding 25°C. As for chemical parameters, concentrations are in line with the standards required for water intended for human consumption, despite low concentrations of certain elements such as calcium and magnesium. As for microbiological parameters, the water is microbially contaminated, requiring treatment before use. I therefore recommend the use of chlorination as a method of pathogen disinfection, applying optimal doses of between 4.5 mg/L and 5 mg/L, to guarantee the population safe drinking water in both seasons.
References
| [1] | Standard Methods for the Examination of Water and Wastewater, 23rd Edition, American Public Health Association (APHA), American Water Works Association (AWWA), and Water Environment Federation (WEF), 2017. |
| [2] | USEPA (United States Environmental Protection Agency). "Temperature." In Water Quality Standards Handbook, 3rd Edition. |
| [3] | Hach Company. "Turbidity Measurement - Applications in Drinking Water." |
| [4] | U.S. Environmental Protection Agency (EPA). (2020). National Primary Drinking Water Regulations. EPA 816-F-20-004. |
| [5] | Kadir, T. et al. (2018). "Concentration of various ions and heavy metals in drinking water." Journal of Environmental Sciences, 42, 97-103. |
| [6] | Verma, S. et al. (2019). "Assessment of the quality of drinking water: A study on the concentration of calcium, magnesium, and other ions." Water Research, 158, 121-129. |
| [7] | Ministère des Solidarités et de la Santé, France. (2020). Qualité de l'eau potable en France: Recommandations sanitaires. |
| [8] | ANSES. (2018). Valeurs guides pour les paramètres de qualité de l'eau potable. |
| [9] | American Water Works Association (AWWA). (2017). Water Quality and Treatment: A Handbook on Drinking Water. 6th ed. McGraw-Hill Education. |
| [10] | Golub, H. L. (2007). Drinking Water Quality: Problems and Solutions. CRC Press. |
| [11] | Leclerc, H., & Dufour, A. (2009). Germes totaux et leur importance dans la qualité microbiologique des eaux. Journal of Water and Health, 7(4), 605-617. |
| [12] | American Public Health Association (APHA) (2017). Standard Methods for the Examination of Water and Wastewater. 23rd Edition, APHA, AWWA, WEF. |
| [13] | Bennett, R. W. (2000). Enterococci as Indicators of Water Quality: A Review of Current Literature. Journal of Environmental Health, 62(1), 25-30. |
| [14] | Leclerc, H., & Seegers, G. (2007). Total Coliforms and Their Use as Indicators of Contamination in Drinking Water. Journal of Applied Microbiology, 95(4), 616-624. |
| [15] | Kouadio, L. G., & Bamba, M. S. (2011). Fecal Coliforms as Indicators of Contamination in Tropical Waters. Journal of Applied Microbiology, 111(5), 1133-1139. |

 Abstract
 Reference
 Full-Text PDF
 Full-text HTML