E. C. Merem 1, Y. A. Twumasi 2, S. Fageir 3, D. Olagbegi 1, J. Wesley 1, R. Coney 1, Y. Babalola 1, T. Thomas 1, A. Hines 4, G. Hirse 4, G. S. Ochai 5, E. Nwagboso 6, M. Crisler 1, S. Leggett 7, J. Offiah 1, S. Emeakpor 8
1Department of Urban and Regional Planning, Jackson State University, 101 Capitol Center, Jackson, MS, USA
2Department of Urban Forestry and Natural Resources, Southern University, Baton Rouge, LA, USA
3Department of Social Sciences, Alcorn State University, 1000 ASU Drive, Lorman, MS, USA
4Department of Public Policy and Administration, Jackson State University, 101 Capitol Center, Jackson, MS, USA
5African Development Bank, AfDB, 101 BP 1387 Avenue Joseph Anoma, Abidjan, AB 1, Ivory Coast
6Department of Political Science, Jackson State University, 1400 John R. Lynch Street, Jackson, MS, USA
7Department of Behavioral and Environmental Health, Jackson State University, 350 Woodrow Wilson, Jackson, MS, USA
8Department of Environmental Science, Jackson State University, 1400 John R. Lynch Street, Jackson, MS, USA
Correspondence to: E. C. Merem , Department of Urban and Regional Planning, Jackson State University, 101 Capitol Center, Jackson, MS, USA.
| Email: |  |
Copyright © 2024 The Author(s). Published by Scientific & Academic Publishing.
This work is licensed under the Creative Commons Attribution International License (CC BY).
http://creativecommons.org/licenses/by/4.0/

Abstract
In the last several decades, the southern portion of Florida continues to be an attraction, and destination for tourism given its warm environment. Aside from the benefits that accrues the region, with that have come many challenges rooted in climatic uncertainty. To that effect, it is inconceivable to venture into climate change risks analysis overtime, without cognizance of the scale and responses in Florida as a mitigation template considering the frequency therein. In the process, no matter what, the Southern Florida zone remains an epicenter of most natural disasters in the Southeast region of the US based on location and physical attributes. From the gravity of changing climatic risks, the number of hurricane landings along the coastlines of the state has intensified so much that the dangers to communities manifest regularly through damages to the environment. Since this results in the displacement of people, property destruction and ecosystem degradation. South Florida has been at the receiving end of climate change induced hazards over the years. This is evidenced by incessant hurricanes, severe flooding, and unending nature of heavy downpours in built up areas. Just as the impacts are manifested through the displacement of people, periodic closures of common activities, and environmental degradation. The spatial mappings of the trends pinpointed dispersal of climate change indicators clustered around spots deemed at risk in the region. Accordingly, the issues are compounded by a range of factors made up of ineffective policy, fragile ecosystem, climatic uncertainty, and socio-economic forces. Notwithstanding current mitigation plans, the paper proffered solutions in the form of education, effective policy, the design of climate change information systems and installation of innovative early warning devices to alert communities about the scale of impending disasters.
Keywords:
Climate change, Hazards, Region, South Florida, GIS, Impacts and Factors
Cite this paper: E. C. Merem , Y. A. Twumasi , S. Fageir , D. Olagbegi , J. Wesley , R. Coney , Y. Babalola , T. Thomas , A. Hines , G. Hirse , G. S. Ochai , E. Nwagboso , M. Crisler , S. Leggett , J. Offiah , S. Emeakpor , Assessing Climate Change Dangers within the South Florida Region of US Southeast, Resources and Environment, Vol. 14 No. 1, 2024, pp. 1-20. doi: 10.5923/j.re.20241401.01.
1. Introduction
In the last several decades, the South Florida, continues to be an attraction, and destination for tourism given its warm environment. Aside from the benefits, with that has come many challenges rooted in climatic uncertainty. To that effect, it is inconceivable to venture into climate change risks analysis without looking at Florida’s experience as a mitigation template considering the frequency therein [1]. In the process, no matter what, the Southern Florida zone remains an epicenter and ground zero of most natural disasters in the Southeast region of the US based on location and physical attributes [2-6]. From the gravity of the changing climatic risks, the number of hurricane landings along the coastlines of the state has intensified so much that, the dangers to communities manifest regularly through damages to the environment [7-9]. Since this results in the displacement of people, property destruction, ecosystem degradation and rising temperature [7-9]. From all the assessments, the state of Florida is sinking. Drawing on the calibrations of several conditions, sea levels are expected to increase by 31in in 2060. This seems like an overly disturbing prediction for a zone with a history of recurrent occurrence of tidal flooding. This is also where about 120,000 homes adjacent to water are deemed to be at greater peril. Seeing the dangers of sea level rise, South Florida should be highly worried, since sea level rise along shorelines in the zone is estimated to surge by 81 inches in 2100. This volume of sea level rise can undoubtedly drive sea water inward and inundate coastlines further over significant amounts of time [10-16]. To that effect, The Biscayne Aquifer, that delivers potable water to the mostly 8 million inhabitants of South Florida, and situated at low depths is vulnerable to saline incursion and pollution Aside from the hazards of sea level rise, saltwater will infiltrate into aquifers and canals pushing freshwater further inland. This potentially changes the distribution of habitats in the Everglades, while further reducing the supply of fresh water for people. Presently, in the study area, water from sea level rise is trickling gradually deeper further towards the state’s permeable limestone bedrock and polluting subterrain freshwater sources, particularly along the Biscayne aquifer, the 4,000-sq mile narrow limestone basin. While this is where people get their fresh water in southern Florida. The record pace of water mining and contaminated overflow of effluents from many years of farm activities and sugarcane operations in central Florida and the Everglades, have compounded the situation a bit further [17-19].When tropical Storm Isaac besieged South Florida with ruthless rain in 2012, it wreaked havoc in Palm Beach County. Considering that South Florida's coastal waters could rise 10 to 17 inches by 2040, and 21 to 54 inches in 2070, over the 2000 mean. Sea-level rise is projected at 40 to 136 inches in 2120. In that way, the zone remains ground zero in the Southeast region of the US based on location and climate change. Being a place where it took 31 years for the waters within Miami to rise to six inches, whereas the next six inches will occur solely in 15years. At that level, many of the attractions in Miami Beach such as the globally acclaimed legendary South Beach, together with the colorful art deco hotels at Ocean Drive, will all vanish by the next 30 years based on current projections. Although the mitigation costs run in the billions of dollars, the counties, and municipalities at risk, are responding as part of a statewide $4 billion mitigation fund. This includes Miami Beach’s $400 million Forever Bond, a $1 billion stormwater plan and $250 million of enhancements together with Broward county’s sewage systems to protect against flooding and seawater leakage. Yet, despite all this, the intensity of hurricane landings continues to occur at a cost [20-24].On the economic side, the Florida industry risks being damaged more through sea level rise than tourism. In a state where over 71 million folks visited in 2000. Based on the info from the state’s tourist development agency, around $51 billion from the sector went into the state’s treasury. Seeing that the beach stands as main attraction for inhabitants and vacationers and others, from available regional data. Miami Beach alone generates $2 billion a year in tourism revenues. In line with tourism expenditure, along the Florida Keys, where yearly figures therein amount to $1.8 billion annually [1]. Should current projections of extreme sea level destroy the beach fronts, the fiscal fortunes of the state will incur considerable blow. At the same time, the degradation of coral reefs, shoreline creeks and common fishery stocks will also hurt economic activities of distribution and exchange. In as much as saltwater angling, brings annual sum of $4 billion through both commercial and sporting activities in Florida with lots of implications in the study area. The practice of outdoor sport diving activities heavily dependent on stable benthic ecosystem sustained by some 3 million inhabitants stands to be fully impacted in the process [1,25-30]. The sequence of emerging negative impacts of climate change in those settings does not operate in a vacuum. From available regional data, they stem from a set of socio-economic and physical factors located within the larger ecology. Aside from measures in place, the situation seems to have magnified alarmingly year after year [31]. For that, very little has been done in the literature in terms of assessment from a mix-scale perspective [32-37]. Accordingly, this study will fill that void in the literature by analyzing the growing incidence of climate change risks in the study area over the years using mix-scale tools of GIS connected to descriptive statistics [38-41]. Emphasis is on the issues, factors, efforts, and the impacts. For the purposes of analysis, the paper has five objectives. The initial aim consists of the use of geo-spatial technology to analyze the status of climate issues and changes, while the second one provides a support tool for policy makers. The third goal stresses the design of a new approach for standardizing climate shift index. The fourth objective is to design a framework for regional environmental impact analysis. Just as the fifth objective is to appraise climate risks trends. The study covers five sections consisting of introduction, methods, results, discussions, and conclusion.
2. Methods and Materials
The study area South Florida [Fig. 1] stretches through 30 large cities in diverse ecosystems. With a population of more than 9.3 million in 2019, the greater region with 1/2 of the population of the state of Florida sits on a land area of 23,000 miles [42]. Also, the South Florida ecosystem holds the single largest subtropical ecological communities in the continental USA, comprising of around 60% of the native flora varieties. The other enduring natural element of the South Florida ecosystem covers freshwater and terrestrial systems from marshes, forests, and coastal systems such as bays, coral reefs, and mangroves [42]. The study area also contains two major life support ecosystems, most notably Biscayne aquifer and the Everglades that are under heavy disturbance but threatened by climate change [43-45]. On the one hand, the Biscayne Aquifer as a source of fresh water for over 8-9 million people, lies within an area of South Florida confined by the Atlantic Ocean and the Gulf of Mexico. On the other hand, the Everglades, a unique complex wetland ecosystem located around the city of Miami and delineated by complex system predicated on the contours of geology, hydrology, and climate, remains imperative in the analysis herein [Fig. 1.1-Fig. 1.2].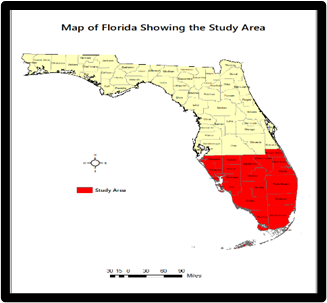 | Figure 1. The Study Area South Florida |
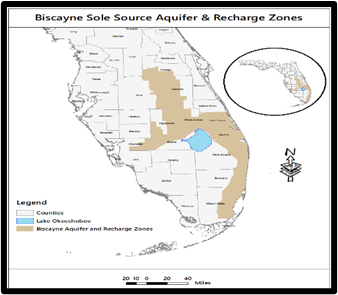 | Figure 1.1. Biscayne Aquifer Recharge Zones |
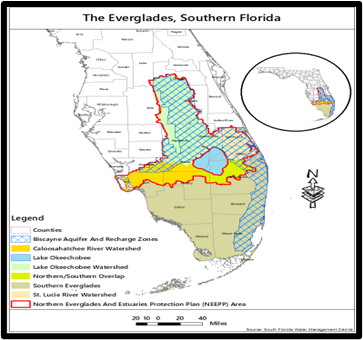 | Figure 1.2. The Everglades |
From the disaster risks index, both the natural and human environments are now faced with challenges and threats [Fig. 1.1-Fig. 1.1]. For that, there is ample need for a mix-scale analysis [46-50]. Recent information indicates that climate uncertainty in Florida within the Southern zone can possibly induce hotter temperatures and changes in recurring precipitation intensity. These shifts will over time prompt an uptick in the gravity of drought and heavy downpour occurrences. The fact that South Florida always faces the combined effects of aridity and torrential precipitations. However, due to the zone’s hot surroundings, all these effects are expected to rise enormously. Intense downpour can overstretch the loads’ limits of drainage facilities resulting in inundation. In the surrounding places, extended aridity can decrease the accessibility of water destined for community usage and the Everglades. Such shifts also can also decrease and destroy marine environments. Ultimately, widespread fire outbreak and soil oxidation emanating from intense droughts will possibly wipe out range and marsh refuges, significant for the Everglades biodiversity.Furthermore, being the country’s major source of sugarcane, Florida is responsible for over 50% of the country’s sugarcane transactions, with the South Florida zone a major player. Viewed as an almost half billion-dollar ($473 million) sector, largely situated in the Palm Beach County area. In context of other aspects of the economy, the changing global climate risks repeatedly felt in the zone, could harshly impede output and supply, with a strong likelihood of endangering the sector’s continual operations in the state of Florida [1]. For that, should the current speed of sea level rise move to 18 to 20 inches. This can accelerate flooding and reduce sugarcane harvests because of rootstock impairment triggered through the intensity of soil moisture. Sadly, the damaging impacts of shifting change in South Florida will also be intensified by population surge and urbanization. Accordingly, it is crucial to augment current knowledge regarding the exact impacts of changing climate in South Florida and integrate this information into rehabilitation programs. Seeing the policy and planning importance, regional analysis of climate change remains vital, given its place in the attainment of environmental protection. For that, this enquiry provides opportunities for integrated mix-scale analysis across time [51-53].
2.1. Methods Used
The paper applies a mix scale approach comprising of descriptive statistics and secondary data connected to GIS to evaluate the changing climatic parameters coupled with the related issues in the South Florida region of the US over the past several years. The spatial information for the enquiry was obtained principally from several agencies consisting of the United States Department of Energy Department (US DOE), The United States Energy Information Administration (US EIA), the United States Geological Survey (USGS) and the University of South Florida. Other sources of spatial info originated from the Federal Emergency Management Administration, The National Oceanic and Atmospheric Administration (NOAA), The National Agency for Space Administration (NASA), the United States Bureau of Ocean Energy Management, Tetratech and Natural Resources Defence Council. In addition to that, Climate Central, Accucentre, Florida Fish and Wildlife Conservation Commission, Florida Department of Agriculture and Consumer Services, Flood Observatory, the National Weather Center and the Gulf of Mexico River Forecast Center also offered other essential information in the research. Generally, for the most part, climate risks indices relevant to the South Florida region and the counties were obtained from the Oak Ridge National Laboratory, the US Army Corps of Engineers, The City of Miami, Miami Dade county, Brevard County, Southeast Florida Regional Climate Change Compact, Nature Conservancy and The Florida Tourism board, and the US Department of the Interior (DOI) and the Environmental Defence Fund for some of the years.Essentially, group entities made up of Forbes magazine, Gavop, the US Census. The US Department of Agriculture and Natural Resources Conservation Service, provided the secondary data highlighting sea level rise, hurricane hazards and vulnerable coastal zone tracts while the US Department of Energy, Florida Energy and Climate Commission, Florida Bureau of Beaches and Coastal Systems, US Energy Information Administration and US Department of Interior, Bureau of Land Management, Florida Oceans and Coastal Councils, ensured data access to ranking, averages and totals of capacity, percentages and averages of climate indicators. These same organizations also offered the time series data and physical information on projections over time highlighting the risks in the region. Pertaining to additional data needs, NASA, Florida Climate Center, UC Davies climate cool data system, National Weather Service, National Hurricane Center (NHC) and Florida Tourism board were respectively critical in the procurement of information on the availability of info on rain data, houses endangered by floods, tourism revenues, tourism costs of hurricane damage, Greenhouse Gas and CO2 emissions by region stressing the susceptibility to changing climate. Elsewhere, Florida Department of Environmental Protection added deeper insights on pollution dangers, while the US Environmental Protection Agency, Natural Resources Défense Council, The South Florida Water Management District, the South Broward Drainage District, Tetra Tech, Intergovernmental Panel on Climate Change, Sierra Club, and the Environmental Defence Fund were critical also on data related to hydrological stress. Given that regional and federal geographic identifier codes of the state were used to geo-code the info contained in the regional data sets. This information was processed and analyzed with basic descriptive statistics, and GIS with attention paid to the temporal-spatial trends at the national, state, and regional levels in South Florida. The relevant procedures consist of two stages listed below.
2.2. Stage 1: Identification of Variables, Data Gathering and Study Design
The initial step in this research involved the identification of variables required to analyze the extent and form of climate change trends, the impacts, factors, liabilities, damages, the risks indices, and parameters at the regional level from 1980-2022. The variables consist of socio-economic and environmental information, climate risks indicators, made up of sea and flood levels and years, ranks, volumes, percent, average, mean annual precipitation volume, mean low temperature, storm frequency and population, the number of visitors or tourists under demography. Across the individual groups, the socio-economic variables consist of precipitation costs, average and total values, monetary costs of damages, number of houses and structures damaged, residential costs, $ revenues from tourism, real estate damage costs, hurricane damage costs, electricity damage, tourism damage costs, bond $ value, hurricane insurance deductibles $ value, and houses. This is followed by physical indicators made up of elevation, sea level rise values, greenhouse gas emission volume, greenhouse gas emission volumes across sectors, greenhouse gas emission volume for transportation and greenhouse gas emission volume for industrial. The others listed cover greenhouse gas emission volume for residential, greenhouse gas emission volume for commercial sector, temperature levels, drought index, heat index, heat, and index days. The others encompass heavy precipitation over a period of 3 days, saltwater intrusion length, frequency and number of storms, precipitation volume, and precipitation averages. These variables as mentioned earlier were derived from secondary sources made up of government documents, newsletters, and other documents from NGOs. This process was followed by the design of data matrices for socio-economic and climate risks variables covering the periods from 2007, 2010, 2014 to 2018. The design of spatial data for the GIS analysis required the delineation of county boundary lines within the study area as well. Given that the official boundary lines within the state and its regions remained the same, a common geographic identifier code was assigned to each of the states’ area units for analytical coherency.
2.3. Stage 2: Data Analysis and GIS Mapping
In the second stage, descriptive statistics and spatial analysis were employed to transform the original socio-economic, energy and bio-geoclimtatic data into relative measures (percentages, ratios, averages, and rates). This process generated the parameters for establishing, the extent of climate change, the impacts, factors, trends, frequencies, output in socio-economic indicators, projections, and quantities, temperature, storm frequency, number of heat days, three days of heavy precipitations, average annual rainfall and temperature, regional energy indicators like greenhouse gas emissions and emission by sectors, monetary costs of hurricane disasters, dollar costs of disasters on tourism, and the costs on real estate. This is attributed to unprecedented development and policy ineptitude as manifested in counties in the South Florida region via measurement and comparisons overtime. While the spatial units of analysis consist of counties, region, the boundary, and locations where changing climatic parameters, the growing frequency and projected, and current risks remain imminent. This approach allows for the detection of change, while the tables highlight the actual frequency and impacts, rankings, emission volumes, volume of precipitation and the intensity of heavy down pours and the trends over 3-day span coupled with the economic costs. The remaining steps involve spatial analysis and output (maps-tables-text) covering the study period, using Arc GIS 11.0 and SPSS 29.0. With the spatial units of analysis covered in the region and counties (Figure 1), the study area map indicates boundary limits of the units and their geographic locations. The outputs and indicators for the state and counties were not only mapped and compared across time, but the geographic data for the units which covered boundaries, also includes ecological data of land cover files and paper and digital maps from 2007-2018.This process helped show the spatial evolution of location of various activities and the trends, the ensuing economic and environmental effects, potentials, benefits, as well as changes in other variables and factors driving climate change in South Florida.
3. The Results
This part of the analysis focuses on temporal and spatial analysis of the climate change dangers in the study area. Using descriptive statistics there is an initial focus on the analysis of Green House Gas (GHG) emissions, rain fall and temperature snapshot, chronicle of key climate events that plagued the zone in nearly four decades. The other sections delve on the pollution audits. This is followed by the remaining portions of the section encompassing of an impact assessment, GIS mappings, and the classification of the factors fuelling changing climate in the South Florida region.
3.1. Green House Gas Emissions by Sectors 2005-2009
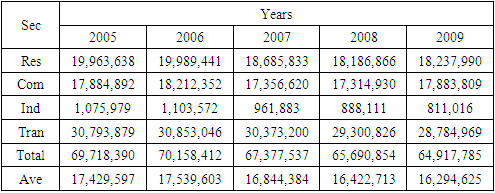
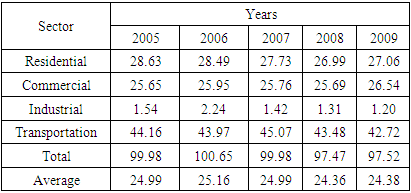
Considering the significance of changing climate indicators in the study area and the connections to the uncertainties emanating from fluctuations in the climatic patterns across variety of sectors over the time. Emphasizing the synopsis of the annual discharge of Green House Gases is of great importance in providing deeper insights into the actual volumes generated, the sectorial source, the percentage totals, and the average emissions. Added to that, the relative comparison among the sectors injects new dimensions regarding the pace of Green House Gas emissions under categories of high, medium, and low concentrations in yearly production levels. In the context of the actual Green House Gas emission inventory distribution for the area. Note that the emission budget covers 5 different sectors made of residential, commercial, industrial and transportation spread over multiple years starting from 2005 through 2009. Out of an average of 19,012,554 tons for the residential areas, throughout the years 2005-2009, the sector posted an individual total of 95,063,738 tons. In the commercial sector of the zone, where the average emission values stood at 17,730,541 tons from 2005-200. The overall volumes of Greenhouse reached 88,652,603 tons. Among the other sectors, the industrial operators who were responsible for the discharge of a total of 4,840,561 tons saw an average of 968,112 tons. Being the largest source in the zone, the total and mean values in GHGs emissions under a spate of 5 different periods from transportation operators consists of 150,105,920 tons to 30,021,184 tons respectively. In the average percentage breakdown of GHG emissions, the rates stood in the order of 24.99%-25.16% to 24.99% in 2005, 2009 and 2007. By 2008 -2009 the levels stayed stable at 24.36% to 24.38%. A further look at the tables involves the average percentage distribution of each sector’s activities from 2005-2009. Of these four sectors, as expected and given the influx of people into the South Florida region amidst. The heavy dependence on various aspects of transportation that emerged, underscores the rationale behind its ranking in the prime spot with highest concentration of GHGs emission level of 43.88%. Among the other sectors, know that as the residential and commercial sectors of the economy posted slightly identical percentage ratios of 27.28%-25.91%. The industries accounted for just only a single digit value of 1.54% of all the emission volumes generated in the South Florida area from 2005-2009. This is much lower than the high double digits percentage rates in the trio of others such as residential, commercial and transportation respectively (Table 1-Table 2).Table 1. Regional Emission of Green House Gases By Sector C02e in tons 2005-2009
 |
| |
|
Table 2. The Percentage distribution of Green House Emissions Gases By Sector CO2e in tons
 |
| |
|
3.1.1. The Temperature Patterns 1980-2022
In the context of temperature trends, in the South Florida region, the average level of degree of hotness in the entire region, stands at 73.96°F degree under a total of 443.74°F between 1980-2022. When added as total temperature, across the individual 16 counties. The temperature figure reached an average of 1185°F and total of 7114.7°F. Of great importance in the individual counties, where average temperature stood firm at 74.10°F degree, is the relative closeness in place at the respective counties in average temperatures recorded therein. As such, the degree of hotness across most of the counties ranged from upper, mid to low 70s. Further along the counties, Miami Dade county and Monroe not only emerged as the duo of areas with higher temperature levels during through the periods 1980-2022 at 76-76.5°F, but it was followed closely by Collier and Broward with temperature estimates of 75.23-75.63°F during the 1980-2022 season. From thereon, the remaining 12 other counties Brevard to Lee held on to 72.86°F -74.55°F as well in temperature values. Looking at the regional temperature, total levels, which started at 1165 to 1203°F degree Fahrenheit between 1980-1990. Over time, from 2000-2010, the degree of hotness shifted from 1176.3°F to 1149.6°F. By 2020-2022, the region’s total temperature values fluctuated further from 12153°F to 1204.1°F. Besides, of all the years, note that the periods 2002 and 2022 stood out as the warmest followed by the 1990 period, while 1980, 1990, 2000 and 2010 seemed somewhat lower. Considering that this comes in the wake of higher levels of temperatures among the various counties in the region measured at 1215-1204°F. Along these lines, from the unfolding temperature levels, the computed average values in the Florida’s southern region went from 72.8- 74.38°F degree Fahrenheit during 1980 -1990, but only to change by 73.5°F in the period 2000. During the same time, in 2020-2022 seasons, the region experiences relatively similar proportions in temperature values at 75.95-75.25°F degree Fahrenheit (Fig 2.-Fig 2.1).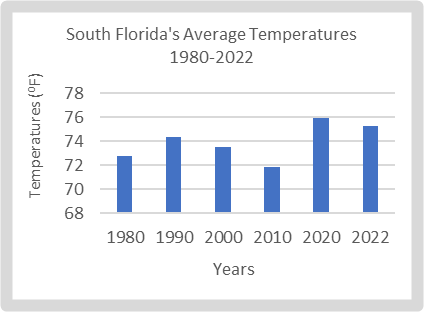 | Figure 2. South Florida’s Average Temperature 1980-2022 |
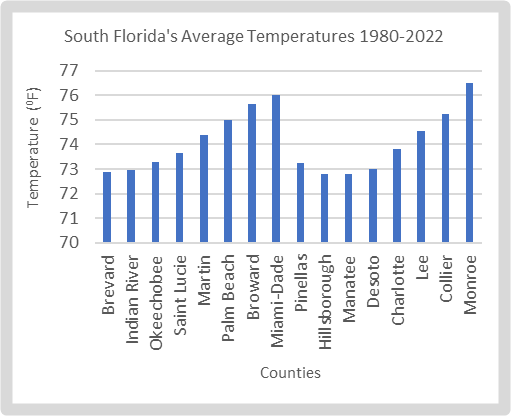 | Figure 2.1. South Florida’s County Mean Temperatures 1980-2022 |
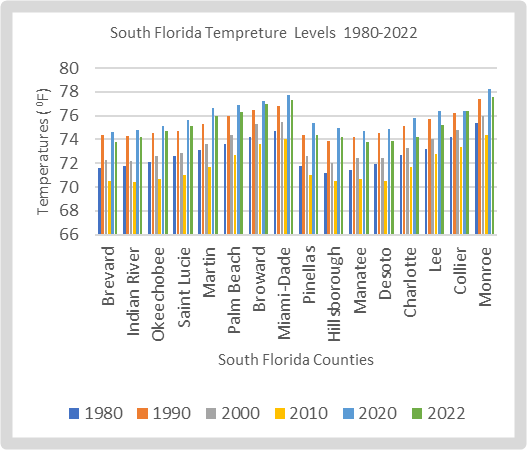 | Figure 2.2. South Florida’s County Temperature Levels 1980-2022 |
3.1.2. The Rainfall Patterns 1980-2022
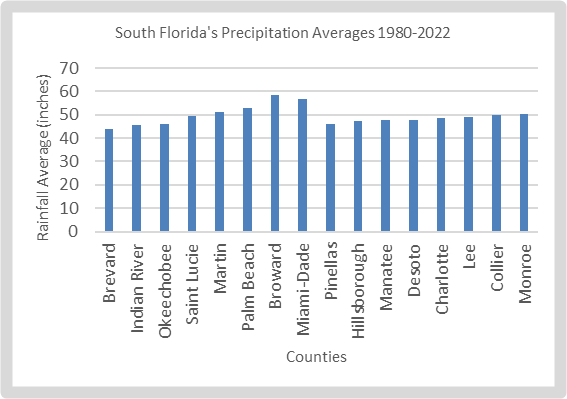
In the context of rainfall, based on the records for the counties, see that the values stand at an average of 297.30 inches to total of 47,569 inches in 1980-2022. A further look in the records shows that the zone averaged about 45.56 inches to 297.30 inches out of a total 47,569 inches. Even though 10 counties posted a rain fall average of 47.7-46.41 inches. Among the counties, Broward County emerged as the area with the most rains at 58.48 inches in average levels out of individual total of 350.09 inches all through 1980-2022. Added to that are other instances of the rain fall trends where 6 counties posted average values of over 50 inches. Of the group of areas in that category that were ranked higher in the classification order of precipitation values, Broward County as mentioned exceeds the counties in total values listed therein within the zone. Within the rest of the counties, where the breakdown of the average precipitation values of these areas points to rainfall value of 50 inches plus concentrated in a quartet of areas beginning with Collier, Monroe, Martin, and Palm Beach. Nevertheless, these same rainfall estimates are still below precipitation estimates in the counties of Broward, and Miami-Dade who maintained 58.4 to 56.19 inches.
3.1.3. Regional Rainfall Total for 1980-2022
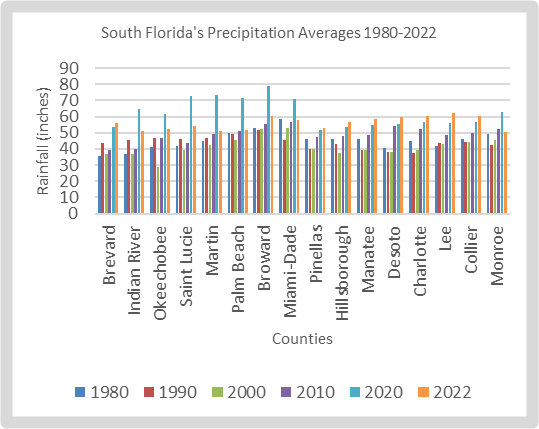
The regional total for 1980-2022 shows opening rainfall volume of 721.9-703.1 inches between 1980-1990. After such a drop in the first decade in the zone. From the information in place, the precipitation total for the South Florida region, shows an uptick from 660.04 inches to 781.9 inches during the periods 2000-2010. This is followed by a surge of 993.3 inches in 2020, but only to drop by 896.7 inches. At the average level, where the information seems similar in the patterns of precipitation from the existing records. Accordingly, the South Florida region saw average rainfall values of 45.11-43.94 inches from 1980-1990.While in 2000-2010, the precipitation values at that period went from 41.27 inches -48.86. By 2020-2022, the region’s rainfall distribution over 2 cycles fell from 62.08 inches to 56.01 inches. Of all the years under analysis in which the South Florida’s rainfall patterns and volumes came under further view at different scales. Both the 2020 and the 2022 seasons stood out as periods with the highest volumes of precipitation with some relative level of closeness. From a much closer look, instances of heavy precipitation among the counties over the years based on 2020 info, Broward County stood out alone in the study area’s rain belt as manifested. In the adjoining areas in the zone, both the counties of St Lucie and Martin ended with same values in precipitation with Palm Beach at similar levels as well. Seeing the other years depicted in diverse colors of varying scales highlighted in blue, dark red, purple, and orange representing the individual years of 1980,1990,2000,2010,2020 to 2022. For the periods 1980 -2022, the average precipitation levels added interesting twists of valuable importance. From the graphic summaries, the counties of Broward and Miami Dade stood outpaced by its neighbours with more rainfall averages. In the other areas, Palm Beach County followed up in the mix at the third spot in ranking as well. The other indicators on the right- and left-hand sides of the figures affirms the slight similarities and closeness in the precipitation values among the cities and the years as well (Fig 2.3-Fig 2.5).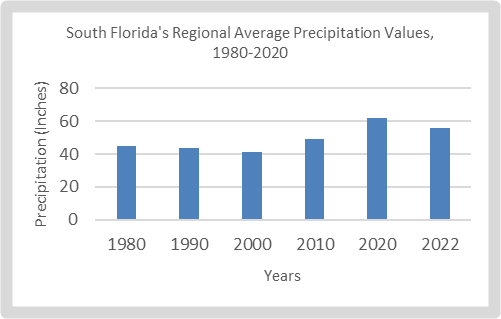 | Figure 2.3. South Florida’s Average Precipitations 1980-2022 |
 | Figure 2.4. South Florida’s County Mean Rainfalls 1980-2022 |
 | Figure 2.5. South Florida’s County Precipitations 1980-2022 |
3.1.4. Climate Events: Heavy Precipitations 3Days or More in Miami Dade County 1950s-2014
Within the South Florida area, Miami Dade’s history of heavy rainfalls attests to the varying number or length of precipitation days lasting over 36 hours. Accordingly, in the context of number days with or over three days of rain from 1950s, 1960s 1970s, 1980s through 2000s (1950-2014). Note that in the 1950s during which the area saw heavy dose of precipitation, the length of times in rainfall exceeding the 3 days mark vacillated from 8-10 days. By the 1960s, the county’s heavy precipitation days jumped further from 11-13 days as at 1960-1969, whereas in the number of times pertaining to more rain in 3 or more days during1970-1979, dropped by 7-6 days until a jump in the 1980s -1988 of 11 to 14 times. In the following periods of the 1990s. Considering its significance in climate uncertainty, the number of times went from 14 to 10 as indicated by the trends in the 2000s. From then on and towards the period 2009, the three-day threshold as a measure of the intensity of rainfall and over three days category fell from 8-7. In the ensuing time 2010-2012 or 2014, it jumped up to 12 days respectively (Figure 2.6). 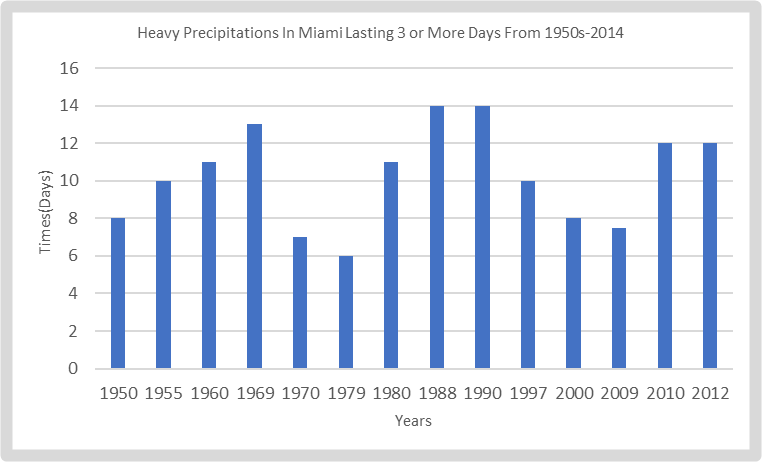 | Figure 2.6. Heavy Precipitations In Miami 1950-2014 For 3or More Days |
3.2. Impact Assessment
Looking at the recurrent risks from climate change in the South Florida region. The built and natural environments were always at the receiving end of sustained and future impacts of varying proportions under the rubrics of fiscal or economic and ecological effects. These impacts are highlighted one after the other below.
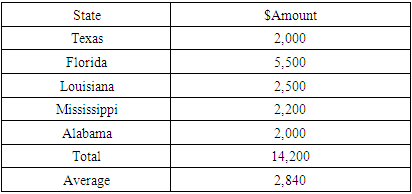
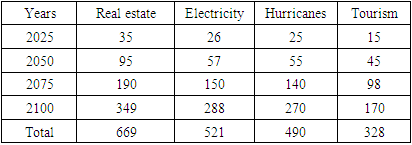
3.2.1. Economic Impacts: The Value of Hurricane Costs on Home Insurance
The tabular display of hurricane deductible amounts by average among the five South Eastern States over time covers the actual costs that accrues individual homeowners in each of the listed states in the zone. Taking a cue from the information tendered, the distribution of the dollar amount in premiums for Florida at $5,500 not only doubles the costs among the other states, but it surpasses her neighbors in the category. Except for Louisiana and Mississippi with home insurance premiums of $2,500- $2,200, the other remaining states (Texas and Alabama) posted relatively identical costs of $2,000 in hurricane deductible home insurance respectively (Table 2.1). In a similar vein, based on summary of hurricane impacts damage costs across sectors, the projections for climate change over a host of sectors, offers some interesting insights highlighting the spectra of liabilities for 2025 through 2100. For that, beginning in 2025, going by the numbers, note the primacy of costs in real estate, electricity, and hurricanes as the most vulnerable sectors, coupled with the tourism industry as well. Turning to the 2025 period, the figures for real estate led the way at $35 billion along with electricity and hurricanes at the projected costs of $26 billion-$25 billion while tourism finished at $15 billion. Accordingly, in the year 2050, again real estate comes out in front with $95 billion, while electricity and hurricanes stood firm at $57-55 as tourism incurs $45 billion. By 2075-2100, the costing gets much into the hundreds of billions with the real estate sector incurring between $190-$349 billion. Elsewhere in the same order at $150-$288, comes damages to electricity as hurricanes’ side of the liability amounts to $140-$270. This leaves tourism costs in the balance sheet at an estimated price tag of $98-170 billion respectively. When tallied up individually based on the projected damage estimations, both the real estate and electricity at $690-$521 gulped up over a trillion dollars while the costs for hurricane and tourism stands at $490 billion to $328 billion (Table 2.2). This puts the overall dollar sectoral damage values at $ 2 trillion from 2025-2100.Table 2.1. Hurricane Deductible Amount by Average Home Insurance Premium
 |
| |
|
Table 2.2. Hurricane Impacts on Various Sectors in 2025-2100: Dollar Values Across Sectors In Billions
 |
| |
|
3.2.2. Physical/ Environmental Impacts (Heat, Saltwater Intrusion Risks and Sea Level Rise)
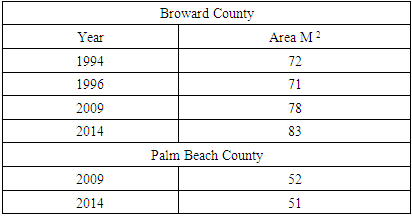
Seeing the heat index for Miami Dade pertaining to the actual days during 2002-2050, the city has combined average of 103 days and total of 301 days overall. While this comes under a span of 30 to 20 years intervals between the projected periods. There seems to be a disparate pattern over the years, even if in the initial period 2000, the area posted much lower index days than the other years. Yet during the period 2000, Miami Dade county seems besieged by about 24 days under a heat front deemed damaging enough to the ecosystem over such extended period in heat days. Again by 2030 to 2050, under 2 decades of punishing heat days, the index days in mostly triple digit went from 126-151 days (Fig 2.7). Drawing from the saline water side of the impact assessment, understand that the fact that sea water incursion originates from both rising sea levels or due to decline in inland stream volumes. Such intrusion has the potential to trigger pollution of coastline potable water distribution. For that, in the past years, the recurrent pace of saltwater flow into inland sources poses numerous concerns in the South Florida area. This is happening in places where vast proportion of several well fields threaten water quality. In the face of rising sea level, more increases in saline water are abound based on the vulnerability of the state from Broward to Palm Beach experience. This is evident with an average of 74 miles2 in salt water. In the case of Broward County, the distribution patterns from 1994-2014 show the opening levels in salt water between the years, ranged from 72, 71 to 78 m2 until 2014 when saltwater intrusion reached 83 m2. This is different during the periods 2009-2014 at Palm Beach County, where saltwater intrusion went from 52-51 m2 (Table 2.3). From the inferences in place in these counties, as the sea level rises, further intrusion will occur. For more on future sea level rise projections see Table 2.4. 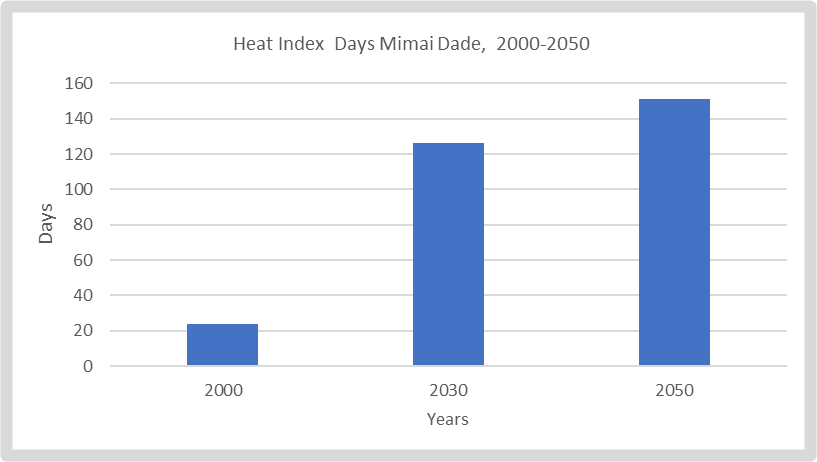 | Figure 2.7. Heat Index Days Miami-Dade County 2000-2050 |
Table 2.3. Saltwater Intrusion Threats in South Florida
 |
| |
|
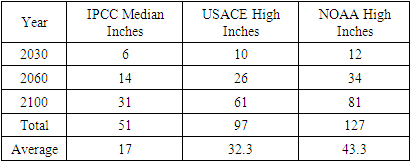
Table 2.4. Unified Sea level Rise Projections; Southeast Florida Regional Climate Change 2030-2100
 |
| |
|
3.2.3. Flood Risks
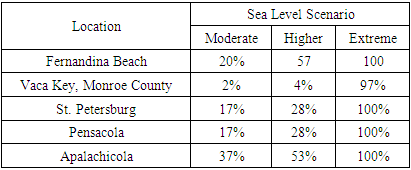
Looking at the yearly risks of flooding in 2040, over the 3 feet mark at various locations in cities in the study area. The scenario that emerges embody a trio of phases from moderate, higher to extreme possibilities. Serious concerns exist for some of the areas beginning with the moderate index for Fernandina Beach and Apalachicola with the risks of sea level hazards exposure to citizens estimated or calibrated in the high double digits of 20%-57% to 37%-53%. Elsewhere both the cities or counties of St Petersburg and Pensacola both fell under identical sea level scenario values of 17%- 28% as Vaca Key values in the moderate and higher levels in water marks, stands solely at 2-4%. Being in the Florida Keys and in Monroe County on lower area of the study area. This scenario remains of greater interest due to the vulnerability concerns. Shifting further to the extreme levels in the sea level scenarios showing 97% for Vaca Key. The 100% for the quartet of the remaining cities, most notably Fernandina Beach and Apalachicola to St Petersburg and Pensacola are worrisome. Thus, from the information gleaned from the projected scenarios, the exposures of these places to sea level by 2040, becomes quite frightening drawing from the projected values in the region (Table 2.5). Table 2.5. Annual Risk in 2040 of Flooding 3 Feet Above the High-Water Mark
 |
| |
|
3.3. GIS Mapping and Spatial Analysis
The GIS analysis involves the visual manifestation of spatial patterns pinpointing different indicators explaining climate change risks in the study area. The risk parameters encompass rainfall intensity, temperature, flood risks, pollution, the Green House Gas emission, disaster and climate and sectorial costs and sea level rise. Building on the pains of the disaster in the region across time, the information as highlighted by the geo visualization under the dimensions affirms the grim condition and the patterns and evolution in space. The capacity to trace the geographic tracks of these trends under a GIS environment as a viable assessment tool, provides ample opportunities about undertaking climate change assessment in the South Florida zone.Over the years in question in South Florida, the Miami Dade area along with adjoining counties in the lower side of the map soaked in more rains much of the time from 1980-2022. With the emergent patterns in space denoted by the color rankings in the order of the high, medium, and low levels in the legend box in blue, green, orange, and red spots. The counties in blue being the highest category in the measurement of rain volumes. This is followed at the medium phase by the numbers in dark and mild green which also saw more volumes of rain in the areas represented in low values in the colors of orange and red in all the maps. Accordingly, looking at the spatial temporal distribution of precipitation across the study area in the season 1980, 1990, through 2010, note during the decade of 1980, aside from the occurrence of low rainfall values of 36.7 -41.8 under the dark red in the north east counties of Brevard and Indian River, comes a sudden shift in rainfall distribution estimated at 35.4-36.7 inches towards the duo of counties Okeechobee and St Lucie on the yellow areas in the south east axis of the study area. Further along those lines, the previous patterns extend further onto the Southwest corner at Desoto and Lee counties where average rain fall volumes for the era stood at 40.05- 41.8 inches. In the process, by the right corner of the map in the lower south axis as highlighted in light and dark green, both Martins and Palm Beach counties accumulated downpour levels measured at 44.6-49.9 inches on the medium side compared to the higher volumes of over 50 inches (52.8-58.3 inches) each at Broward and Miami Dade in blue color. Elsewhere a quartet of counties on the left along the southwest and northwest corner as Hillsborough Manatee, Collier and Monroe posted average precipitation values of 46.1-46.4 to 46.3-49.5 inches in both the eastern and western parts of the map (Figure 3).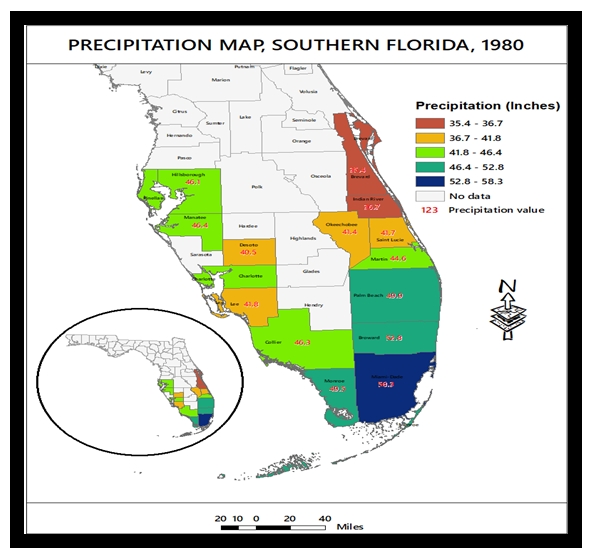 | Figure 3. South Florida’s Precipitation Values For South Florida 1980 |
Even though generally the rainfall averages for 1990 were relatively, over 43.1-50 inches plus in counties listed in the green and blue category compared to those in orange and red parts of the study area maps where the precipitation values vacillated from 37.7-43.1 inches. The dispersal patterns on the right corner of the map were quite notable from Brevard to Miami Dade county with the rainfall measurement of 43.7 inches in light green, seemed like an outlier in the right corners of the map until the precipitation ratio reached 46.9-46.3 to 47-45.3 inches among a quartet of counties like Indian River, Okeechobee, Saint Lucie, and Martins County where values in rainfall were slightly similar or different. Further deep onto the lower south corner of the map, the trio of other neighbouring counties including Palm Beach, Broward, and Miami Dade each experienced average precipitation values of 49.2, 51.5 to 45.2 inches. Aside from the similarity in precipitation ratios from Hillsborough to Monroes at 43.10-42.4 inches. Both Lee and collier maintained average rainfall levels of 43.5-41.16 inches, until it faded notably at Manatee, Desoto, and Charlotte by 39-38.1 to 37.1 inches (Figure 3.1). Considering the little surprises on the precipitation level distributions during the period 2000. There seems to be a mix of spots on the map highlighting abundant and marginal pace of rain with 5 counties in the upper parts of the study area from east and west areas under the shades of orange and red classified as lesser belts. This consists of the 2 North east counties of Brevard, and Indian River where precipitation values dropped to 36.6-37 inches together with the nearby Okeechobee County at 28.7 inches. Moving further to the southern lower tip of study area, both Martin and Palm Beach County saw rainfall levels of 42.3-45.3 inches while the pace of precipitation in deep blue locations of higher lower rainfall volumes of identical values of 52.2-52.0 held firm at Broward and Miami Dade counties. From there, onto the southwest parts, the trio of counties led by Monroe, Collier to Lee, located therein in dark green took in rainfall average values of 45.5-44 to 43.1 inches. These levels in precipitation distribution surpassed rainfall levels of 39.1-39.3-40% in the counties of Charlotte, Manatee, and Pinellas as the two remaining Northwest counties in yellow spots of the map representing Hillsborough and Desoto, experienced 37.2-37.9 inches in downpours (Figure 3.2).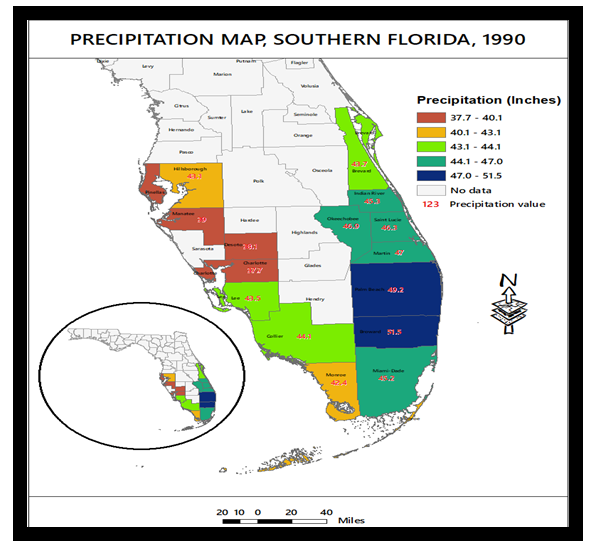 | Figure 3.1. South Florida’s Precipitation Values 1990 |
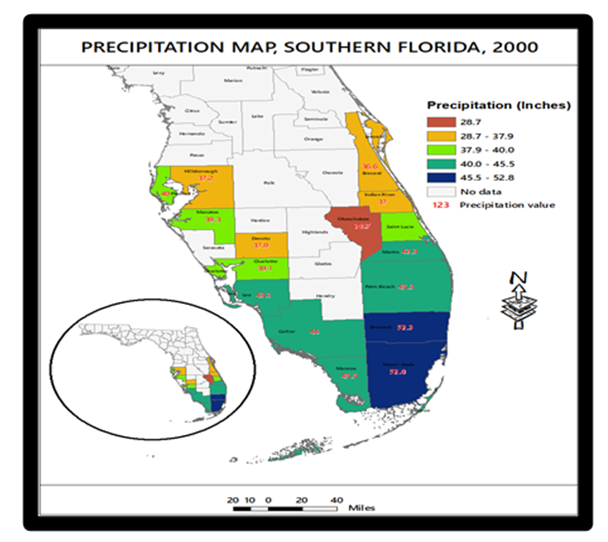 | Figure 3.2. South Florida’s Precipitation Values 2000 |
Just as in the previous period, the first three counties (Brevard, Indian River, St Lucie) in the upper Northeast under red color had identical averages in lower scale of rainfall index of 39.2-40.2 to 43.4 inches with neighbouring Okeechobee and Hillsborough each receiving 47.7-46.5 inches. In the Mid-Eastern part of the map both Martin and Palm Beach counties posted about 49.5-50.8 inches in rain fall volumes below Broward and Maimi Beach deemed at the highest levels of 55.1-56.5 inches, like Desoto at 54.1 inches. Under the medium level of precipitation at 52.5-54.1 inches in the index, for 2010, Monroe in lower southwest and the northwest county of Charlotte were really at the receiving end of the downpours. From the southwest to Northwest axis of the map, the counties of Collier, Lee and Mantee rounded out the average precipitation volume listings of 49.9-48.4 to 48.7 inches in the period 2010 (Figure 3.3).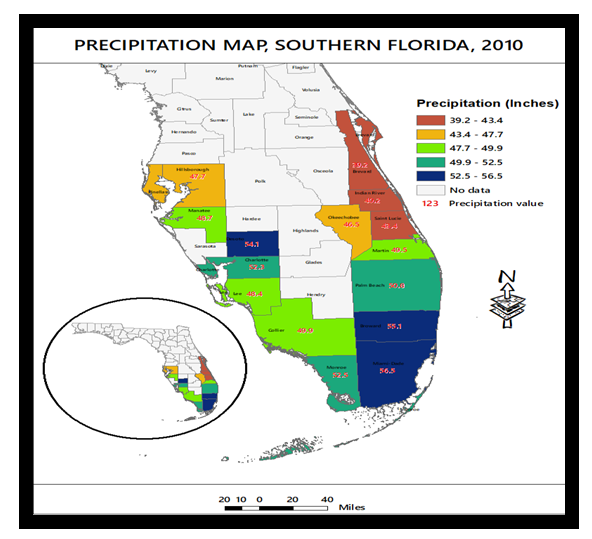 | Figure 3.3. South Florida’s Precipitation Values 2010 |
Given how the precipitation levels in the last periods of 2020-2022 stayed at all-time highs in 2020 and followed by the unexpected shifting. Therefore, it is unsurprising that some of the Southwest and Northwest counties on the left side of the map in 2022 reached the highest points in rain fall levels far above or more than those in the lower South side on right in Miami Dade county (Figure 3.4-3.5). However, in the 2020 season as the map shows. Notwithstanding the initial high opening values of 52.4 inches rainfall at Brevard County considered high by the set thresholds of the past years, it so turned out it ranks lower in the red under the classification based on Indian River and Okeechobee rainfall volumes of 64.5-61.7 inches in the medium phase. In the same order, comes the 5 counties in the lower south precipitation levels that topped over all-time highs at the 70-inch mark. These unusual points in the map seems fully dispersed at 72.7 -72.3 inches beginning from St Lucie to Martin. In the same period, the surging pace of rainfall based on the map showed a further spread of 71.6, 78.6 -70.6 inches at Palm Beach, Broward, and Miami Dade county. On the lower left side of the map in the Southwest, Monroe County not only received 62.9 inches of rainfall but about 52.3 inches of rain carpeted the Hillsborough County area in the upper North. Among the group of another quintet of counties starting with Collier, Lee and Charlette, Desoto, and Manatee in the 2020 season, the rainfall average values of over 53.4-56.9 inches in index therein ranged from 56.8-55.9 to 56.9-55.2 and 54.5 inches (Figure 3.4). The sudden reversal in the precipitation distribution patterns in 2022 shows rainfall levels opening values of 55.2-56.0 inches in both Brevard and Hillsborough on the right and left sides of the map. Surprisingly the three set of counties on the right side of the study area Okeechobee, Martin, and Palm Beach experienced rain fall volumes of 52.1-57.2 to 57.6 inches. Similar values in average rain fall volumes continued at Broward, Miami Beach, and Monroe in the lower south part of the map at 60.06-54.0 to 50.2 inches. From there, as the average rainfall in the upper southwest at Manatee reached 58.4 inches. The highest levels of rainfall (62-60.5 to 62.8 inches) held firm in 3 counties at Lee, Collier and Desoto as the pattern continued (Figure 3.5).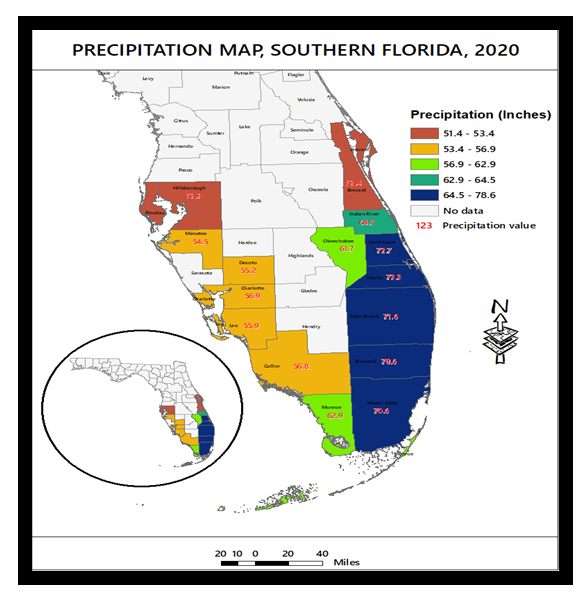 | Figure 3.4. South Florida’s Precipitation Values 2020 |
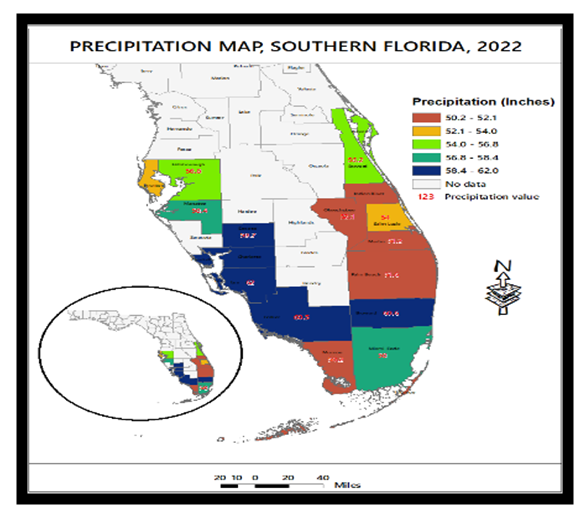 | Figure 3.5. South Florida’s Precipitation Values 2022 |
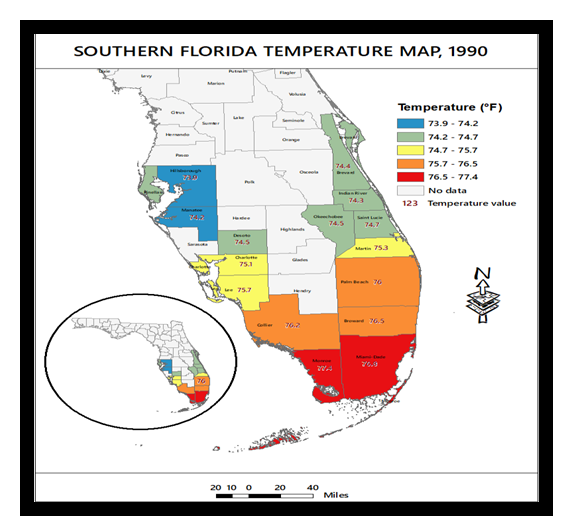
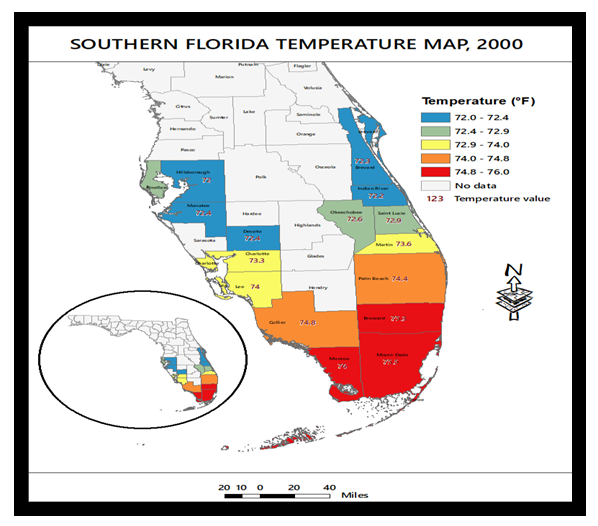
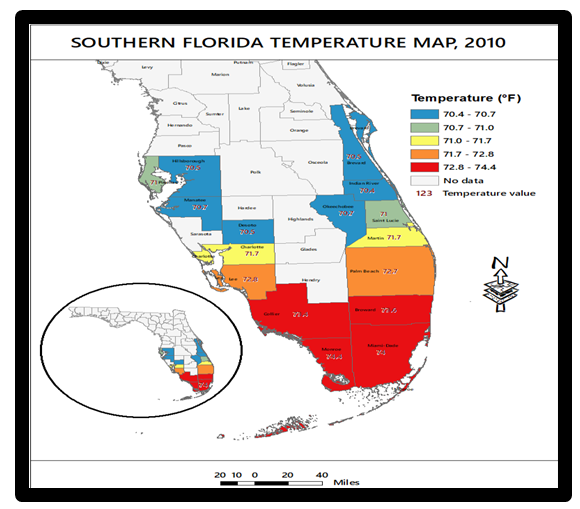
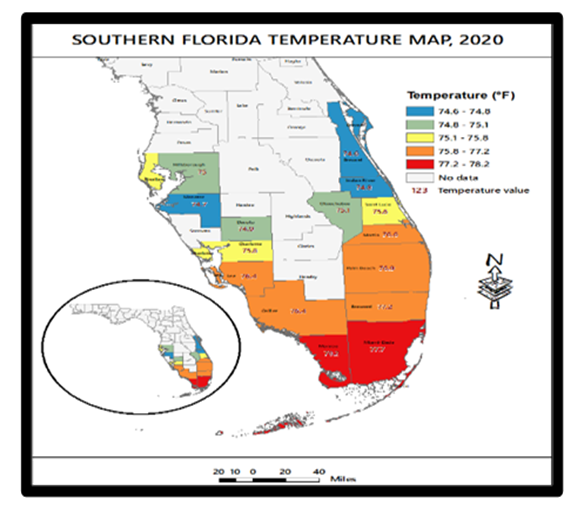
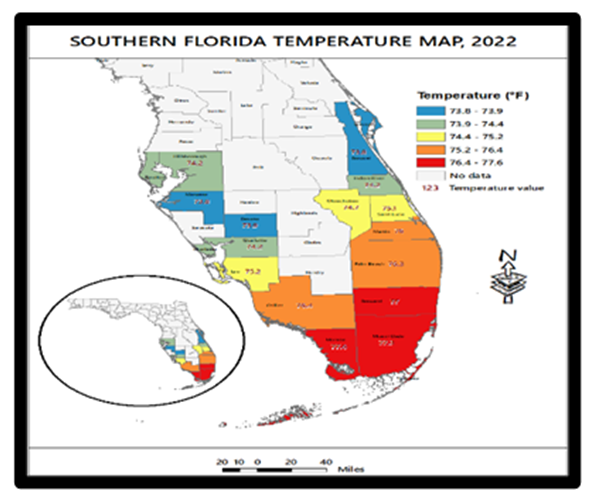
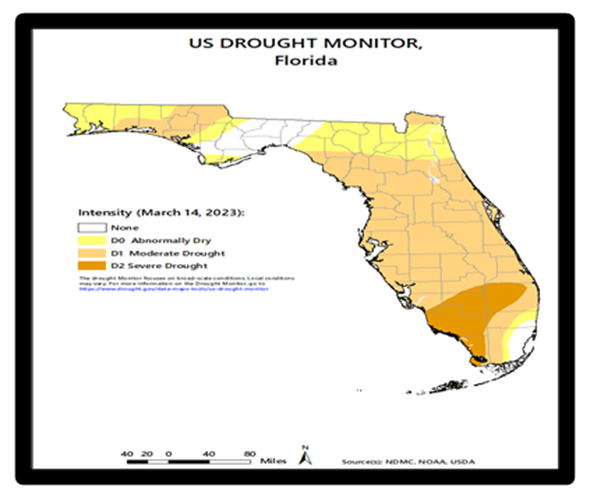
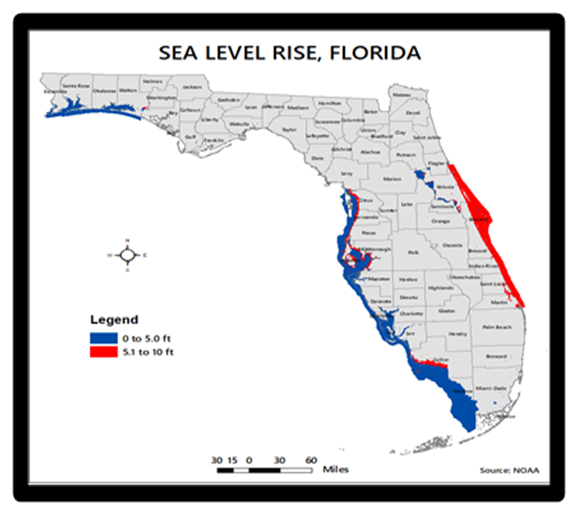
With the regional values across the study area in 1980 estimated at mostly above the 70s to mid and high 70s from 1980-2022. The one thing that stands out looking at the maps, regardless of the colors, is that there is not much difference pertaining to the degree of hotness separating areas in the map deemed low, medium, and high. Accordingly, with the temperature levels distinguished under the colors of red and orange in the high, and yellow/green in the medium and the portions on the low side based on classifications of yellow, green, and blue. For that, the low-lying areas along the Miami Dade corridor mostly in the red colors and neighbouring areas above in the central spots of the map along the right-hand corner posted average temperature values of 73.6-75.4°F to 72.7-73.6°F deemed relatively higher and warmer. With the initial trio of counties Martin, Palm Beach, and Lee averaging 73°F, Collier, Broward, Monroe, and Miami Dade counties at 74°F in 1980 (Figure 3.6). Further into the years from 1990 through 2022, the patterns evolved more (Figure 3.7-3.11). As such, the geographic spread of the effects of climate change in the study area can be seen under various parameters starting from the drought component, sea level rise dangers and the vulnerability among residential areas in the South Florida region. For those sceptics who still dismiss climate change occurrence over the years, consider the intensity of drought based on a national monitoring of the trends in the 2023 season during mid-March. From the information contained in the map legend under different colors of dark yellow or red, orange, and yellow denoting severe drought D2, moderate drought D1, and D0 abnormally. With many of the severely hit areas from the drought situated or the D2 scale in dark yellow or red clustered on the deep lower south of the study area. Behind the plume of severe drought, are pockets of counties under the moderate drought, and abnormally dry drought. Sitting above the severe drought spots on the map are multiplicity of counties at the receiving end of moderate drought in orange or pink colors diffused robustly in the northwest and southeast corner of the map (Figure-3.12). Of the three sea level rise indices of 0-5.0 Ft, 5.1-10 Ft, 1m -3m, and + 1m in place and as displayed in the maps, see that the area’s most vulnerable to sea level under the map 1.0 are with scales denoted in blue spots on the scale of 0-5.0 Ft are on the right or left and south west side and the red on the 5.1-10 Ft category typically on the right. The fact that the counties in the study area of South Florida share a high propensity towards the encroachment of sea level scenario of various dimensions. Counties on the blue corner of the blue spots from Monroe, Collier, Charlotte, Sarasota, Lee and Mantee showed some stability. Elsewhere on the areas on the map as highlighted on the right or Northeast corner in red colors under the 5.1-10 Ft risk level affirms the situation where Martin, Indian River and St Lucie face the risks of sea level of varying dimension (Figure 3.13). In terms of the geospatial analysis of sea level rises of 1-3meters size, the 1 meet side of the trend seems to encircle or surround counties adjacent to the lines with parts of Miami Dade county and Collier under the 3meter scale. The map highlighting +1m see level rise mostly in orange colors affirms the exposures of some parts of the counties of Monroe, Miami-Dade, Collier, and Lee as well figure (3.13-3.15). 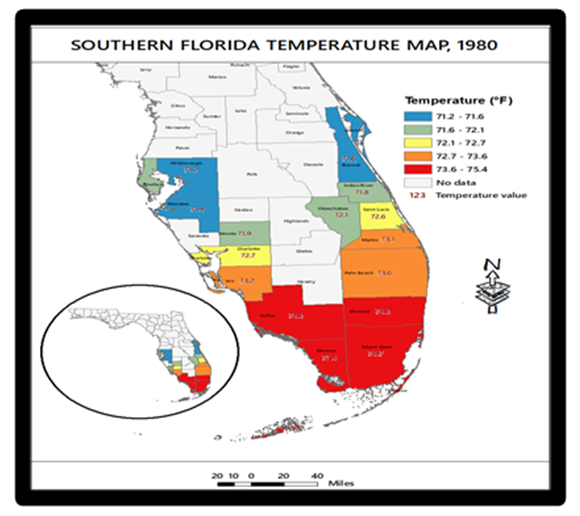 | Figure 3.6. South Florida Temperature levels 1980 |
 | Figure 3.7. South Florida Temperature levels 1990 |
 | Figure 3.8. South Florida Temperature levels 2000 |
 | Figure 3.9. South Florida Temperature levels 2010 |
 | Figure 3.10. South Florida Temperature levels 2020 |
 | Figure 3.11. South Florida Temperature levels 2022 |
 | Figure 3.12. South Drought Monitor March 2023 |
 | Figure 3.13. Spatial distribution of Sea Level Rise 0-10 feet |
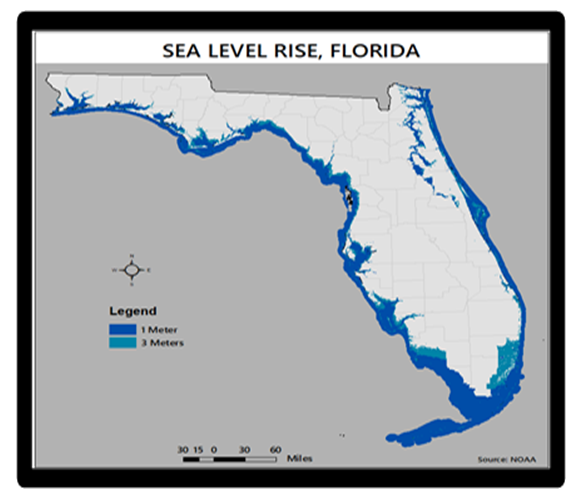 | Figure 3.14. Spatial distribution of Sea Level Rise 1-3 meters |
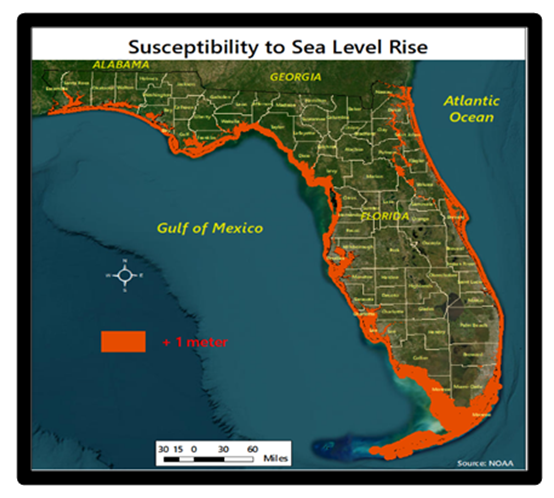 | Figure 3.15. Spatial distribution Of Sea Level Rise +1 meters |
Knowing the essence, power, and volatility of real estate market in the South Florida zone, the projected exposure of tens and hundreds of thousands of housing units by 2050 to sea level rise along the coast paints quite a gloomy picture. From the data on the number of housing units calibrated over different scales, units and colors of beige marked by zero, light blue denoted by the scale of 1-133, purple 134-265 and blue representing spots in space of about 266 or over. Based on the distribution of the exposed housing units, Miami/Dade County split in dark blue and purple in the southernmost portion of the of the map stands out with over 266 thousand and 134 -265 thousand houses likely at the risk of heavy barrage of sea level in 2050. With that comes further spread of more risks into Monroe and Broward counties represented in purple color spots in space under the 134 to 265 houses projected under the at-risk homes category. Since the vulnerability of housing assets in the study area to sea level by 2050 is not only confined to the previous areas alone, in the upper south west corner of the map represented in light blue, the two counties along the coast line Sarasota and Charlotte remains in the mix with about 1-133 housing units projected to be inundated in the process as the remaining areas from Collier, Lee, Hendry, Palm Beach and Indian River along with others ended in the zero category mainly in beige color numbers (Figure 3.16).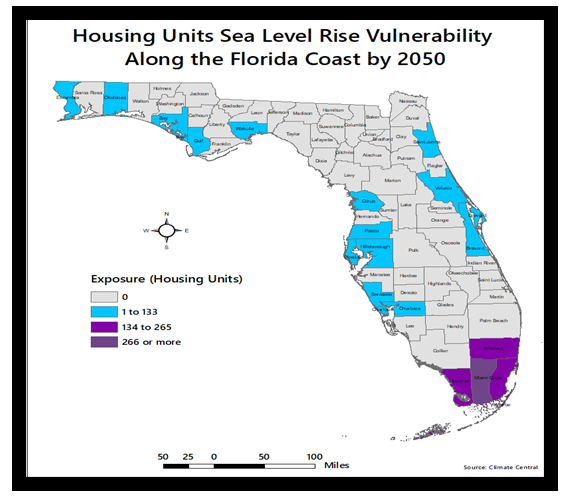 | Figure 3.16. Housing Units Susceptibility |
3.4. Factors Responsible for the Climate Change Risks and Efforts
Concerning the factors fuelling the mounting climatic hazards devastating the South Florida ecosystem over time or span of several decades. The temporal-spatial assessment of the extent and form of the impacts showed that climate change events in the zone do not operate in isolation. They are associated partially with a host of socio-economic, policy, and physical-environmental factors. These forces are assessed in detail below.
3.4.1. Socio-Economic and Politics and Demographics
Being in a country that saw 355 climatic disasters amounting to 2.2 trillion dollars from 1980-2022 with Florida dubbed ground zero of it all, one expected more serious actions. However, that does not seem to be the case considering how climate risks confronting communities have been reduced to political posturing therein. The vulnerability of the south Florida to climate change notwithstanding, the fate of the residents of the zone seems compounded by the charged political atmosphere in the state where those in denial of the risks still cannot even separate facts from friction to the detriment of public welfare all in the name of politics. The fact that Hurricane Ian triggered about $112.9 billion dollars in damages and the loss of more than 150 lives in 2022 should put climate change mitigation into arena of public policy. For that, over the last serval years, Florida has long been plagued by political leadership more attuned to the corporate welfare with the interests of big industry than the environment. In the process, during the previous state administration between the year 2011 to 2019, Rick Scott, cut $700m from Florida’s water management budget. The move undermined environmental guidelines and implementation and offered a safe haven to emitters or environmental outlaws. The shenanigans of then governor in 2018 over inactions went further and allegedly barred the use of such lexicons as “climate change” and “global warming” in any official records. All these undercuts the capacity of cities in South Florida to fully mitigate the threats of climate change. Gloomily, the detrimental shocks of changing climate in South Florida are further compounded by the pressures mounted from the ecological and carbon footprints emanating from population increases and urbanization with the state repeatedly gaining with annual growth rates in the periods 1990-1999 to 2000-2009 at 2.2%- 1.7%, and 1.4%-1.2% by 2010-2022 US Census. Among the south Florida counties, both Broward and Palm Beach posted gains of .19%-1.6%. This is manifested with widespread automobile use, new settlements, and pollution intense operations heavily dependent on fossil fuel use, that is resulting in GHGs emission. Accordingly, it is crucial to augment current knowledge.
3.4.2. Environmental / Physical Forces
The state of Florida, being particularly vulnerable to the impacts of changing change contains more than 1,200 miles of shoreline. This is in addition to nearly 4,500 square miles in creeks and coves, coupled with over 6,700 square miles of additional coastline waters, and lowland landscape. Furthermore, many of the state’s 18 million citizens reside close to 60 miles off the waters of Atlantic Ocean and the Gulf of Mexico. In as much as the state in its entirety is located inside the Atlantic Coastal Plain, based on the extreme elevation estimated at under 400 feet over sea level. The study area of South Florida on its part, does not have any natural shield from these dangers being in one of the most susceptible zones in the nation. This is compounded by its reputation as the ground zero of climate change, amidst timing population and the proximity to a fragile Everglades ecosystem located along a coastal plain lowland and permeable landscape. For that, the anticipated shifts have potential to adversely affect water access essential to life support in the built and natural environment.
3.4.3. Climatic Elements: Green House Emissions
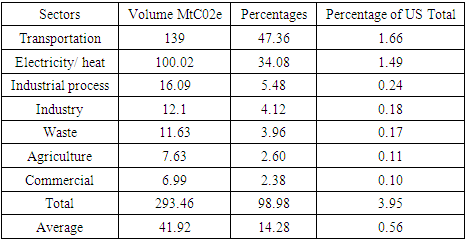
When it comes to the actual drivers or causes of climate change specifically tied to the South Florida area. Four major elements come to mind, and this includes the following: increasing greenhouse gases, increasing air temperature and water vapor; increasing ocean temperature as well as rising sea level. For the purposes of analysis and lack of space only one of these factors most notably, the increasing emissions of GHGs is presented below. To really understand the role of rising Greenhouse gas in driving up changing climate in the study area. Consider the overall trends statewide and the national level. Seeing that in 2018, the top 10 discharging states accounting for almost 50% of the nation’s overall GHG emissions includes Florida. The leading group’s estimated values is almost equivalent to the joint emission figures for OECD countries of Japan, Canada, and Germany, or same as India’s GHGs emissions. Notwithstanding the ordinal ranking nationwide and the state of Florida being among US leading emitters made up Texas, California, Florida, Illinois, Pennsylvania, Ohio, Louisiana, Indiana, New York, and Michigan. The sectoral profile highlighting the study area’s emissions can be gleaned from the breakdown for each state. Out of the total and average of 293.46 Mt C02e-41.92 Mt C02e volumes in Green House Emissions among the sectors, both electricity and heat accounted for the largest volumes GHGs at 139 Mt C02e to 100.02 MtC02e ahead of the rest of the trio of sectors (industrial process, waste, industry) whose Greenhouse emission estimates in 2018 stood at 16.09 -12.1 and 11.63 Mt C02e respectively (Table 3). Since county level info from the 2019 Community-Scale GHG emissions inventory still shows that energy usage in houses and transportation fuel consumption actions remains the two main causes of GHG. The emissions at Miami-Dade estimated at a rate of 41% -55% in every discharge of GHG, individually reinforced it. Although GHG releases linked to water supply, and waste production represents solely a limited fraction of the County’s emissions budget, the two sectors already mentioned stands as key sources of methane (CH4), a greenhouse gas seen as major global warming stressor. To that effect, the overall local GHG atmospheric discharges in the 2019 season stood at 36.5 million metric tons of carbon dioxide equivalent (MMT CO2e) in the Miami Dade county. Table 3. The Green House Emission Values In 2018
 |
| |
|
3.5. Efforts
Considering the current risks, regional climate change mitigation measures do exist in the zone among some of the adjoining counties and local organizations who share similar challenges. To that effect, part of the climate mitigation effort that is attracting attention consists of the erection of the much-needed safety barriers in the form of imposing sea walls at Miami-Dade County. Seeing the reference to Miami Beach as the “ground zero” of rising sea level, both comprehensive and expensive preventive program are currently on going. This encompasses the design of elevated highways, sea walls and mounting innovative and towering size pumps and drainage networks to contain flooding. This is occurring in a place where the water distribution and the Biscayne Aquifer are of primary significance. The vulnerability from the increase in the pressure triggered from direct stressors coupled with influx of people amidst city bright lights and the unprecedented increases in CO2 emissions among the respective sectors remains a big challenge. Accordingly, this leaves the county into taking ecosystem protection measures. This not only involves the implementation of an urban CO2 reduction plan, but this city also takes part in the Southeast Florida Regional Climate Compact. In as much as this venture operates under joint corporation amongst the counties of Broward, Miami-Dade, Monroe, and Palm Beach. The other components of regional joint efforts are the ones between Broward, Miami-Dade, Monroe, and Palm Beach Counties aimed at the containment of greenhouse gas emissions with many communities in danger of degradation and submergence. Accordingly, there is a commitment to operate jointly to minimize greenhouse gas discharges, realize adaptation plans, and develop climate resiliency with a move to ensure that Miami emerges as a carbon neutral city in 2050. In realizing the fiscal prospects, revenue generation, the inflow of tourism money and profitable estate income tax coming through beachfront residences and firms therein. Group of media houses have also teamed up in the dissemination of information pertaining to climate concerns, amidst mitigation pathways proposed by the regional institutions of higher learning.
4. Discussions
From the assessment as conducted in this enquiry using mix scale methodology anchored in the use of descriptive statistics and geospatial tools of GIS. Clearly stated, no matter what, the Southern Florida zone remains an epicenter of most natural disasters in the Southeast region of the US based on location and physical attributes. From the gravity of the changing climatic risks, the number of hurricane landings along the coastlines of the state has intensified so much that, the dangers to communities manifest regularly through damages to the environment. Since this results in the displacement of people, property destruction and ecosystem degradation. The sequence of negative impacts of climate change in those settings does not operate in a vacuum, as they stem from socio-economic and physical factors. Accordingly, it is evident that the South Florida region, and communities of the zone have important attractions built on the vast terrain and dimension, diverse ecosystem, and the economy. From the way human-nature interactions involving facets of the social environment occur in the designated counties. The pressures unleashed from sectors such as industries, agriculture, commercial activities, households and electricity power, shape climate change and the dilemma inflicted on communities. In all these, the cities and counties in the zone maintain still maintain enormous economic potentials. This is buoyed by visible presence of growing network of built-up areas, industries, households, tourism, electricity power generation and transportation infrastructures and usage. To some extent, the footprints of these indicators impede the ecology via population growth, pollution and ground water depletion and the generation of climate induced parameters in the form of the warming of the atmosphere from CO2 to the emission risks of Green House Gases. Against that background, the South Florida region at various scales experiences the risks from of Green House Gas emissions, the heavy concentration activities precipitating CO2 discharge and the attendant global warming as manifested. This is manifested in most fatal and gruelling forms through the variabilities in temperature, heavy precipitations, and rising storms in the study area. This in turn makes the South Florida zone, the epicentre at the receiving end of global warming risks that are now projected to grow in the coming years and beyond. With the impacts over the years fully felt across the zone in the form of direct hits from hurricanes, sea level rises, massive floodings, unprecedented heat and incidence of heavy precipitations exceeding 3 days since the 1950s-2000s. The vulnerability of the study area to inclement weather events continues unabated. For that, one need not lose sight of the damages inflicted therein by the frequency of heavy downpours of unprecedented proportions in the region all through 1980-2022. The changing climate events in South Florida also comes with the risks of saltwater intrusion across the roadways in the face of surge in irregular heavy rain fall patterns and the pains of inundation resulting in the sinking and submergence of homes with heavy increase in insurance premiums in affected areas.Seeing that the GIS mapping of the trends uncovered recurrent diffusion of risks from changing climatic parameters in various areas. The proficiency of GIS mapping was crucial in showing the spatial distribution of climatic forces made up of the fluctuations in temperature, drought intensity and monitoring. Just as other dimensions cover vulnerability of city settlements along the shorelines together with precipitation averages of varying levels of high, medium, and lower phases resulting in the propensity to inundation. The gravity of emergent sea level rise dangers, and the projected vulnerability of the housing stocks to rising sea level surge by 2050s because of climate change, were really eye popping. Given that the south Florida lies adjacent to low lying coastal areas with natural systems likely to be impacted by changing climate. The spatial analysis also underlined the geographic distribution of climate disaster pathways and impacts, in coastal areas as well as coastline population exposure to risks over the last years. This is essential in an area where close to 20 million folks dwell adjacent to the Atlantic Ocean and the Gulf of Mexico together with the dangerous exposure to climate risks in the last several years. The other components of the geospatial analysis highlighting the risk indices extends to the exposures felt in built-up areas to heavy precipitations. This corresponds with different incidents in space as manifested in the counties of Broward, Miami Beach, and Monroe with 60-50 inches in rainfalls in South Florida. Further along the upper southwest corner, where Manatee County posted 58.4 inches, another trio of areas (Lee, Collier, and Desoto) saw highest levels of rainfall of over 60 inches in 2022.Notable dimensions of the GIS mapping involve the visible display of hundreds of thousands of housing units concentrated on the path of sea level rise dangers given the close spatial proximity of coastline populations from Miami/Dade County, Monroe, and Broward. The extent of this analysis as indicated, revealed the exposure of these places as potential paths for floods and projected submergence in foreseeable years. Just as these hazards and other climatic stressors often leave in their wake major havocs in low elevation areas clustered in the South Florida zone. Aside from the high intensity of heat at Miami/Dade corridor as indicated by the temperature values over of 72-75°F, the other counties most notably Martin, Palm Beach and Lee averaged 73°F in 1980. Taking a cue from the analysis, results show the prevalence of climate change risks and impacts in the form of flooding hazards, greenhouse gas emission, rising temperature, sea level rise, pollution, environmental degradation, and the displacement of citizens. The GIS mapping of the trends pinpointed clusters of heavy presence of stressors plus threats to the everglades and the Biscayne aquifer dispersed across space die to socio-economic, physical, and ecological elements. To remedy the situation, the paper proffered numerous solutions ranging from the adoption of effective policy, growth management, monitoring to the design of a regional climate information systems and the education of the public and others.
5. Conclusions
This research assessed the risks from changing climate impacts in counties along the South Florida region with numerous important findings listed as follows. a) Risks indicators on the rise; b) South Florida the epicenter of climate disaster; c) climatic shift triggered by multiple factors; d) mix scale approach quite effective.1) Climate Risks Indicators On the Rise From the rising pace of heat indicators, the heat index of the climate shows that since the 1970s, cities in South Florida like Miami ranked high among the hottest areas in the United States, posted annual average temperature of 70.1-degree Fahrenheit to 73.3 beginning from 1970 to 2017. Accordingly, with a heat index of 105 degrees, more dangerous daily temperature lay ahead going by records and projections for the year 2000, 2030 and 2050. With that also has come more days of heavy precipitations under a sequence of 3 or more days with much of that in the 1990s, and 2010-2014 periods. At the same time, Miami-Dade County besieged by multiplicity of floods, have seen some of that linked to human induced incidents. Given that the area’s low-lying elevation localities are at risk of facing 10 feet sea water surge, about 2,194,000 or 98% of the population remain in harm’s way. Aside from the vulnerability of Miami, Broward County from 1983-2014 was not spared of the barrages in terms of both the number of storm events and the landing of significant storms. Of these, the county was not only pummelled by 2 big storms in 1991, but over time, the area averaged at least about 1 major storm all through 1994-2013. This is overly significant enough to do lots of damage. Further along these lines, note also that the yearly rainfall levels from 1999-2013 in a trio of South Florida counties from Palm Beach, Miami Dade to Broward County appeared to be in dangerous territories. Surely, the anticipated costs estimated in the 10 to 100s of billions of dollars could result in huge losses for real estate, electricity, and the tourism sector in the zone. This in turn amounts to more stress on the economy and environment through the degradation of fragile habitats [3]. Stressing these dangers and the links to production is a major contribution crucial to policy and likely to see adjustments from the industry.2) Study Area Epicenter of Climatic DisasterThe study area’s perception as one of the most susceptible zones in the nation and the ground zero of climate change, remains unsurprising given recurrent extreme weather uncertainty leading to disasters therein. From its location in the South zone of Florida, the condition is synonymous with possible inducement of conditions of hotter temperatures and changes in precipitation intensity. These shifts over time prompts upticks in the incidence of drought and heavy downpour occurrences. The fact that South Florida always faces the combined effects of aridity and torrential precipitations in such circumstances, due to the hot surroundings, and increases in temperature, coincides with intense downpour that can overstretch the loads limits of drainage networks resulting in inundation. Taking a cue from the results, as an epicenter, South Florida has been at the receiving end of climate change induced hazards over the years. This is evidenced by incessant hurricanes, rising frequencies of state of emergencies, evacuation orders, severe flooding, and unending nature of heavy downpours in built up areas just to mention a few. With the impacts manifested through the displacement of people, periodic closures of common activities, and environmental decline. When Tropical Storm Isaac besieged South Florida with ruthless rain in 2012, it wreaked havoc in Palm Beach County. While South Florida's coastal waters could rise 10 to 17 inches by 2040, and 21 to 54 inches in 2070, over the 2000 mean. Sea-level rise is projected at 40 to 136 inches in 2120. In that way, the zone remains ground zero in the Southeast region of the US based on location and climate change. Being a place where it took 31 years for the waters within Miami to rise to six inches, whereas the next six inches will occur by solely 15 more. Under such scenario, many of the attractions in Miami Beach such as the globally acclaimed legendary South Beach, together with the colorful art deco hotels at Ocean Drive, will vanish by the next 30 years based on current projections. This puts the overall dollar values of damage costings inflicted on various sectors from real estate, electricity, to tourism at a whopping expense of about $2 trillion from 2025-2100. The graphic display of climate risk info in this enquiry stressing the path and frequency of the hazards gives the zone and others in comparable ecozones opportunity to learn from the timings and exposures and then design resilient action plans as they move towards mitigation.3) The Climatic Risks Fuelled By Many FactorsFrom what transpired all these years in the study area, the issues are compounded by a range of factors made up of ineffective policy, fragile ecosystem, climatic uncertainty, and socio-economic forces. Based on the vulnerability of the state in general and the geology of the south Florida zone, one expected some level of proactive stance but that is not always the case given the politicization of the policy process regarding environmental protection. Being a place at the mercy of inclement weather dangers almost all year, amidst the risk exposures, the issues get always downplayed by those solely focused on denying the gravity of climate change for the purposes of reaping political capital that comes with the perks of elected office at expense of public safety and ecosystem protection. This inability to detach political opportunism from the factual realities of climate change in the zone, breeds inaction in terms of mitigation and policy implementation. This in in turn further exposes citizens in the communities as siting docks before unending and looming dangers in the study area. Considering that much of the state’s population are along the Atlantic Coastal Plain at an elevation of less than 400 feet over sea level. Located in such a vulnerable area, South Florida lacks the natural shield from the dangers of climate uncertainty. In an area known for the seemingly bright lights and major attractions of sunny beach fronts, and recreational amenities on the south beach corridor. Such kinds of exotic attractions trigger the huge influx of people for tourism adventure, the design of new settlements and more pressures from households, transportation infrastructure and energy usage to meet demands. As all these are resulting in the high concentrations of greenhouse gases, as well as CO2, and CH4 emissions associated with global warming. It comes as no surprise that in Miami-Dade County, energy usage in houses and transportation fuel consumption ranked as the two main causes of GHG emissions, reached estimated rates of 41% -55% in every discharge of GHG in 2019. Even though the GHG discharges from water supply, and waste production accounts for just a minuscule proportion of the County’s emission levels, both sectors are major emitters of methane (CH4). Against that background, during 2019 period, in Miami Dade county, the total GHG atmospheric discharges reached 36.5 million metric tons of carbon dioxide equivalent (MMT CO2e). By showcasing this, the study not only reiterated the essence of socio-economic and geo-physical elements in the region’s climatic variability index. But it did indicate how the eco-system could be impacted by these factors. Emphasizing these links considering the exclusion in past studies, keeps a major regional policy concern at the center of debate shaping climate change and coastal zone planning.4) Mix scale Approach quite effectiveBased on the outcome of the enquiry, the applications of mix scale methods stood out very extremely well in showing the paths of shifting climate research in the South Florida region. Applying descriptive statistics and GIS mapping as working devices under the model injected new framework to undertake a regional level analysis underlining the rising effects of climate change on coastal environments. Considering the environmental and socio-economic relevance of the region’s coastal zone. Certainly, the monetary and ecological potential of the zone in the hosts of sectors therein from tourism to households, industrial, commercial, energy, and electricity use are key indices of changing climatic parameters germane to the assessment. Just as this covers multiplicity of structures stretched over coastal counties and cities shaping the drivers of daily activities. They leave in their wake negative climate change footprints usually manifested in and around the study area. The choice of mix scale model in calibrating the regional climate index pinpointing colossal risk exposures from the threats of sea level rise, the dangers posed to built-up areas and the natural environment by hurricanes to the distribution of saltwater flow length, GHG emission budget, heat index and the proceeds from tourism, reiterates efficacy of the system. This approach was quite effective in describing the study area and in classifying the trends and in the assemblage of information on climate change under various indices. Stressing the visualization of climatic hazards from various parameters in that form, is vital in the development of new ways to protect fragile ecosystems. The applied use of a mix-scale method containing mappings and the assemblage of climate change index, as analytical tools, therefore increases our understanding of the vulnerability of the region. Consequently, managers in the zone will be fully required to seek prompt responses to many pressing inquiries relevant to climate change. The questions are as follows: How will shifting climate change indices impact water sources? In what ways will climate uncertainty affect transportation infrastructure and public amenities in the lower elevation coastal plain? What patterns will the spatial spreading of climate risks assume in the region? What other socio-economic and environmental elements will be shaping global warming? In drawing from the questions, full opportunities exist for those in practice and research to move the focus on regional climate change measures with benchmarks emphasizing prevention, adaptation, protection, restoration, and recovery. This will help the key players in the sector, the region and state and counties boost their devotion to climate change containment with improved results.
References
| [1] | Fiedler, J. (2001). Feeling The Heat In Florida Global Warming on the Local Level. Washington: D.C, Natural Resources Defense Council. |
| [2] | Bagley, K. (2014 March). Climate Change Showdown in Florida Governor's Race. Inside Climate News. |
| [3] | Grunwald, M. (2014 April). Spending Earth Day at Ground Zero For Climate Change In America. Time. |
| [4] | Editorials. (2015 August). Ground Zero for Climate Change. Miami Herald. |
| [5] | Urdaneta, D. (2014 April). Florida is Ground Zero For Sea Level Rise. Retrieved 2023 March 28th From Phys.org. |
| [6] | Morse, H. (2020). Florida is Climate Change Ground Zero. But It Lacks Buzz Ahead of Presidential Debate. The Palm Beach Post. Retrieved 2023 March 28th. |
| [7] | Climate Central. (2021). Summer Getting Murkier. Washington: D.C., National Oceanic Atmospheric Administration (NOAA). |
| [8] | Climate Central. (2021). Summer Heat. Washington: D.C, National Oceanic Atmospheric Administration (NOAA). |
| [9] | Climate Central. (2021). Mayport Florida A Decade of Coastal Flood Days 45 Total Floods From 2005-2014 98% Human Caused. Washington: D.C, National Oceanic Atmospheric Administration (NOAA). |
| [10] | Intergovernmental Panel on Climate Change (2007). The 2007 Report Summary. Intergovernmental Panel on Climate Change. NY: New York, United Nations. |
| [11] | Juste, C. (2021). But Neighborhoods 20 Miles Inland Are Starting To Feel the Impact, As The Atlantic Ocean’s Higher Elevation Makes It Harder For Drainage Canals To Keep Them Dry. Miami Hearld. |
| [12] | Mims, KM. (2021 May). South Florida is The Canary In The Coal Mine’ of Climate Change. Opinion Special To The Sun Sentinel. Sun Sentinel. |
| [13] | Luscombe, R. (2020 April a). 7 Threats and 7 Solutions In Southern Florida’s Fight Against Climate Change. Next City Few. |
| [14] | Raimi, D. (2020 January). Here’s How Climate Change Will Affect Florida In The Next 20 years. Resources For The Future. |
| [15] | Interdepartmental Climate Change Group (2009 November). Climate Change. Retrieved 2023 March 28th From https://www.sfwmd.gov/sites/default/files/documents/climate_change. |
| [16] | The Southeast Florida Regional Climate Change Compact’s Indicators Working Group (2015). The Sea Level Rise Report. Southwest Florida. The Southeast Florida Regional Climate Change Compact. |
| [17] | Rajendra, P. (2022). Climate Change Effects in South Florida and The Everglades. Palmetto Bay: Florida, The Everglades Foundation. |
| [18] | Cabrera, P. (2018). The Vulnerability of Potable Water with Climate Change In Miami-Dade. Boston: Massachuseetts. Harvard Graduate School of Design. |
| [19] | Flavelle, C. (2018 August). Miami Will Be Underwater Soon. Drinking Water Could Go First. The City Has Another Serious Water Problem. Bloomberg LP. |
| [20] | Florida Energy and Climate Commission (2009). The Effects of Climate Change On Florida’s Ocean and Coastal Resources. Tallahassee: Florida, Florida Energy and Climate Commission. |
| [21] | Luscombe, R. (2020 April). Will Florida Be Lost Forever To The Climate Crisis? The Guardian. |
| [22] | Fleshler, D. (Sept 2021). Sea-Level Rise Becoming A Hazard For Suburban South Florida Neighborhoods Far From Ocean. South Florida Miami, Herald. |
| [23] | Knox, P. (2021 September). Sea-Level Rise Becoming a Hazard For Suburban South Florida Neighborhoods Far From Ocean. Athens: Georgia, University of Georgia, Extension Services. |
| [24] | Miller, K. (2021 September). Climate Change: Florida's Largest Water Manager Wants $140 Million For First Fix. Palm Beach Post. |
| [25] | Borisova, T. (2008 November). Economic Impacts of Climate Change On Florida: Estimates From Two Studies FE787. The Food and Resource Economics Department. Gainesville: Florida UF/IFAS Extension. |
| [26] | Florida Governor's Action Team on Energy and Climate Change. (2008). Retrieved 2023 March 28th From http://www.flclimatechange.us/. |
| [27] | Harrington J. (2007). Climate Change In Coastal Areas in Florida: Sea level Rise Estimation and Economic Analysis to Year 2080. Florida State University, Tallahassee: FL. Retrieved 2023 March 28th From http://www.cefa.fsu.edu/content/download/47234/327898. |
| [28] | Field, C.B. (2007). Climate Change Impacts, Adaptation and Vulnerability. Contribution of Working Group II to the Fourth Assessment Report of the Intergovernmental Panel on Climate Change. 617–652. Cambridge, UK: University. |
| [29] | Intergovernmental Panel on Climate change (IPCC). (2007). Climate Change 2007: The Physical Science Basis: Summary for Policymakers. Retrieved 2023 March 28th From http://www.ipcc.ch/publications_and_data/ar4/wg1/en/spm.html. |
| [30] | Intergovernmental Panel on Climate Change (IPCC). (2004). 16 Years of Scientific Assessment in Support of the Climate Convention, Geneva, Switzerland. |
| [31] | Merem, E.C. (2022 March). Analysis of Climate Change Issues In Florida’s Southern Region. Paper Presented at the 96th Annual Louisiana Academy of Science Conference. LSU Alexandria, LA. March 12th, 2022. |
| [32] | Merem, E. C. (2021). Assessing Hydraulic Fracking Issues in the US Southeast and Western Region, Energy and Power, 11: 1 1-19. |
| [33] | Merem, E. C. (2021). Assessing the Risks from Changing Climate in South Texas Region, Resources and Environment, 11: 1: 18-34. |
| [34] | Merem, E. C. (2021). The Assessment of China’s Scramble for Natural Resources Extraction in Africa, World Environment, 11: 1: 9-25. |
| [35] | Merem, E. C. (2021). Analyzing the Environmental Risks From Electronic Waste Dumping In The West African Region, Journal of Health Science, 11:1: 1-16. |
| [36] | Merem, E.C. (2021). Analyzing the Use of Genetic Modified Organisms (GMOs) in Agriculture in the US Midwest Region, Food and Public Health, 11:1: 1-17. |
| [37] | Merem, E. C. (2021). The Regional Assessment of Groundnut Farmland Use in Northern Nigeria, International Journal of Food Science and Nutrition Engineering, 11: 1: 1-19. |
| [38] | Merem, E. C. (2020). Evaluating Geothermal Energy Potentials In The US Western Region With GIS. International Journal of Engineering. 10:2: 23-40. |
| [39] | Merem, E. C. (2020). Use of GIS and Remote Sensing Technology as Decision Support Tool in Flood Disaster Management: The Case of Southeast Louisiana, U.S.A. Journal of Geographic Information System. |
| [40] | Merem, E. C. (2019). Assessing Water Resource Issues in the US Pacific Northwest Region. International Journal of Mining Engineering and Mineral Processing, 8:1: 1-19. |
| [41] | Merem, E.C. (2019). Regional Assessment of Climate Change Hazards in Southern Nigeria with GIS. Journal of Safety Engineering, 8:1: 9-27. |
| [42] | USGS (2014). South Florida Ecosystem Studies. Tallahassee, Florida: The US Department of Interior. |
| [43] | Everglades Mangroves' Carbon Storage Capacity Worth Billions. Retrieved 2023 March 28th From www.nsf.gov. |
| [44] | Everglades Mangroves Carbon Storage Capacity Worth Billions. ECO Magazine. Retrieved 2023 March 28th From ECO Magazine. |
| [45] | Milman, Oliver (2018 May). Everglades Under Threat As Florida's Mangroves Face Death By Rising Sea Level. The Guardian. |
| [46] | Merem, E. C. and Twumasi, Y. A. (2020, March). Assessing The Risks from Changing Climate In South Texas Region. Paper Presented at 94th Annual Meeting of The Louisiana Academy of Science (LASC). Louisiana State University -Alexandria, Louisiana, March 14, 2020. |
| [47] | Merem, E. (2018). Analyzing Tragedy of Illegal Fishing On The West African Coast. Paper Presented at 18th NAAAS Conference, Dallas. TX. |
| [48] | Merem, E. C. (2016). Assessing the Vulnerability of The US Pacific Northwest Region to Tsunami Hazards. American Journal of Environmental Engineering, 6:1: 1-19. |
| [49] | Merem, E. C. (2012). Using GIS to Assess The Contributions of farming activities to climate change in the state of Mississippi. British Journal of Environment and Climate Change. 2:2: 1-15. |
| [50] | Merem, E. C. (2018). Appraising Variations In Climate Change Parameters Along The Lower West African Region. Journal of Safety Engineering, 7:1: 1-19. |
| [51] | Merem, E. C. (2023 March). Assessing Climate Change Impacts In The US Pacific North West Region. Paper Presented at the 97th Annual Louisiana Academy of Science Conference. LSU Alexandria, LA. March 4th, 2023. |
| [52] | Merem, E. C. (2023 March). The Assessment of Climate Change Risks In Maryland’s Southern Region. Paper Presented at the 87th Annual Mississippi Academy of Science Conference. Biloxi, MS. March 23, 2023. |
| [53] | Merem, E.C. (2022 March). Analysis of Climate Change Issues In Florida’s Southern Region. Abstract Submitted For the 96th Annual Louisiana Academy of Science Conference. LSU Alexandria, LA. March 12th, 2022. |

 Abstract
 Reference
 Full-Text PDF
 Full-text HTML