Vincent Ogembo O.1, 2, Bancy Mati1, 2
1Jomo Kenyatta University of Agriculture and Technology, Kenya
2Department of Soil, Water and Environmental Engineering
Correspondence to: Vincent Ogembo O., Jomo Kenyatta University of Agriculture and Technology, Kenya.
| Email: |  |
Copyright © 2023 The Author(s). Published by Scientific & Academic Publishing.
This work is licensed under the Creative Commons Attribution International License (CC BY).
http://creativecommons.org/licenses/by/4.0/

Abstract
The drip systems available in Kenya are currently very expensive and not locally manufactured. Consequently, there has been a need to design micro-irrigation systems that could act as commensurate drip technology. The study therefore seeks to compare the performance of the perforated threaded pipe system with a conventional drip system. The system was designed and fabricated after which it was laid in a farm. The system was tested under 5 different pressures between 357Pa and 1784Pa for which discharge and wetted diameter data were collected. Various calculations were made regarding frictional losses, standard deviation and distribution uniformity. The same procedure was repeated for the conventional system which acted as a control. Discharge uniformity was measured to find out how evenly the water is distributed within the installation drip irrigation system. The range of distribution uniformity (DU) for the threaded system was from about 80% to 98%, which can be classified as “good” to “excellent”. That for the conventional system ranged between 86% and 99% hence not very far from the threaded drip. The variation in discharge at the head, mid, and tail of each lateral was due to various factors include clogging of the emitters, slope, size of the emitters, length of lateral lines, leakage of joints and end plugs. It was found that distribution uniformity increased with increase in pressure up to a certain maximum level after which it begins to fall. The maximum level in this case was 90% which is actually considered excellent in terms of efficiency and this was at a pressure of 1200Pa. Emitter discharge and wetted diameter were found to decrease with increase in distance from the source which was attributed to pressure losses experienced due to friction. The system was then evaluated using beans as a test crop. Using the pressure-discharge graph obtained in the second stage, the system was set up in such a way that it was able to attain the irrigation water requirements of the crop. The optimal pressure required to attain discharge that would fulfil the crop water requirements at each stage was found to be 360Pa for the initial stage, 420Pa for the crop development stage, 460Pa for the mid-season stage and 358Pa for the late season stage. The similarities in performance are quite similar for both systems hence the threaded drip system will add to the new developments and technologies for cheap smallholder irrigation farming practices in Kenya which will contribute to additional alternatives considered in choosing irrigation methods.
Keywords:
Drip Irrigation, Threaded strings, Crop Water Requirement, Conventional drip system, Discharge, Pressure, Emitter
Cite this paper: Vincent Ogembo O., Bancy Mati, Evaluation of the Performance of Perforated Pipe with Threaded String for Smallholder Drip Irrigation, Kenya, Resources and Environment, Vol. 13 No. 1, 2023, pp. 6-15. doi: 10.5923/j.re.20231301.02.
1. Introduction
World population currently growing at a rate of about 1.5% is intensifying pressure on our natural resources especially water. Predictions inform that by the year 2025 about 35% of the world population may face water shortages (Hinrichsen et al., 2002). This worrisome forecast has attracted concerted efforts to speedily institute potent water management policies that may prevent water scarcity in the future. Most recommended strategies to avert an impending water crisis emphasis increased efficiency from the irrigation sub-sector, and one way of achieving this is for farmers to switch over from the traditional flooding method of irrigation to the highly efficient drip system. Regrettably, the cost of conventional drip systems deters their adoption by peasant farmers who command the agricultural sector of developing countries. Consequently, only about 1% of the total irrigated land worldwide is currently under drip irrigation (Raphael, 2000). Recently, the concept of Affordable Micro-irrigation systems has been identified as a commensurate drip technology for low-income farmers. These systems equally possess momentous potential for efficient agricultural water use (Keller, 2000).Drip Irrigation, also commonly referred to as micro-irrigation, trickle irrigation or low volume irrigation is a method of irrigation which efficiently delivers water to the soil surface or the root zone; this is done by having water drip slowly from emission devices, most commonly called “drip emitters” or “drippers” (Mason et al., 2019). Early forms of drip irrigation can be traced back to ancient times where clay pots were filled with water and then buried in the ground, this allowed the water to gradually leak out and into the root zone of nearby vegetation. The first formal development of drip irrigation supplies began around 1866 in Afghanistan, where they tested drip irrigation and drainage systems by using various types of clay pipe. A researcher at Colorado State University, Mr. E.B. House, began applying subsurface water directly to the root zone in 1913 (Ngigi, 2008). Perforated Pipe was first used for irrigation in Germany around 1920.After World War II, the ability to mold plastics became widespread and more cost effective. This helped pave the way for innovations in the manufacturing of drip irrigation system components. At this time, Polyethylene (PE) tubing, also referred to as “micro tubing” or “spaghetti tubing”, and early versions of emitters (drippers), became more common and began to be installed throughout the US and Europe. In Israel, Simcha Blass & Yeshayahu Blass were innovating in the area of emitter design. They created a method that allowed water to flow through longer and wider passageways inside of the emitter. These “labyrinths” as they were called, resulted in less clogging. The velocity of water moving through the labyrinth, and resulting turbulence, helps to slow it down, creating a “drip”. In 1959 Kibbutz Harzerim partnered with Blass to form a company called Netafim, to further develop and test this concept. Netafim was then able to patent the first drip irrigation emitter. This development helped the technology of drip irrigation rapidly expand to Australia, North America, & South America in the late 60’s (Doria, 2006).The existing drip kits in the market are currently too expensive for most small-holder farmers in Kenya. Moreover, they are always imported from various parts of the world hence their exorbitant prices. For this reason, small-holder farmers are unable to apply advanced and efficient irrigation practices leading to low yields (Adhikari, 2000). Furthermore, drip irrigation is not well exploited in Kenya. the most practiced irrigation system is sprinkler irrigation which has been proven already to be uneconomical when it comes to saving water. There is a need to make these systems locally available to be able to cater for the farmer’s needs (Narayanamoorthy, 2008). The threaded drip system has not been tested yet in Kenya hence the need to evaluate its performance compared to the conventional drip.
2. Methodology
The methodology was divided into 3 stages; Design and Fabrication; Performance assessment of the system in comparison with the conventional system; and Evaluation of the system using Beans as a test crop.
2.1. Design and Fabrication
The design for the research is as shown in Figure 1 below. The materials used included; ½’’ PVC Pipes, ½’’ Gate valve, ½’’ Elbows, ½’’ Connectors, 18mm manila thread, Pressure gauge, 210 litre tank, Beans, and Beakers. The PVC pipe was cut into 3, 3m long pipes and perforated with a 12mm nail at intervals of 30cm. the manila thread was cut into 12cm long pieces. The thread was then inserted between the perforations in the pipes. The purpose of the thread is to unblock the openings by pulling it from side to side. The fittings were used to join the system together as it was laid on the ground.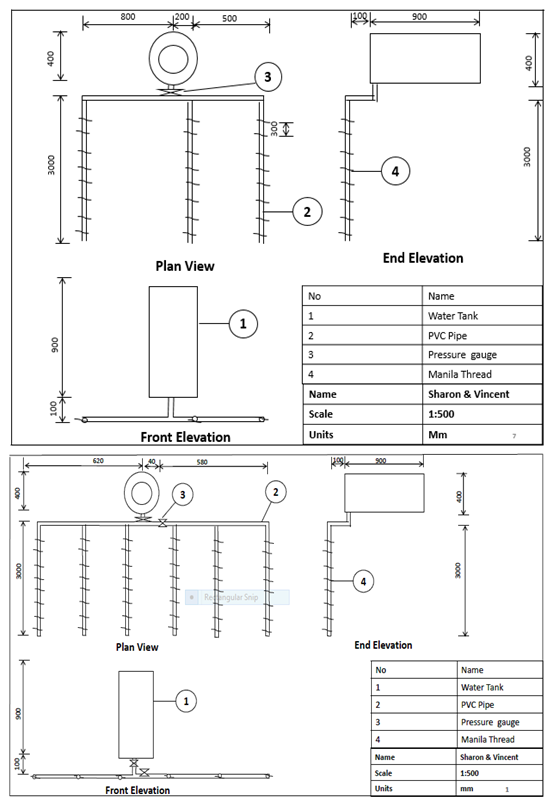 | Figure 1. Layouts of the drip system |
2.2. Performance Assessment of the System in Comparison with the Conventional System
The system was laid on a 6m by 6m square piece of piece of land at the BEED farm. Water was sourced from a nearby tap and delivered into the tank. The pressure-discharge relationship of the threaded drip system was assessed under five different pressures. i.e. 357 Pa, 713 Pa, 1070 Pa, 1425 Pa and 1784 Pa. Discharge from each emitter was collected on the beakers. The same procedure was repeated for the conventional system which acted as the control in this case. Data collected was: Discharge per emitter using beakers; and Wetted diameter (measured after 1 hour).The distribution uniformity of water is one of the main criteria for designing an efficient drip irrigation system. The formula used to calculate emitter uniformity is as below: In this study Hazen-Williams will be used to calculate the frictional losses in the pipes throughout the subunit with the equation below:
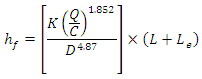 Where hf is the head loss due to friction; K = 1.21 x 10¹⁰; Q is the pipeline discharge (lps); C is the friction coefficient for pipe sections; D is the inside diameter (mm); L is the pipeline length (m); Le is the equivalent length of pipe and accessories.
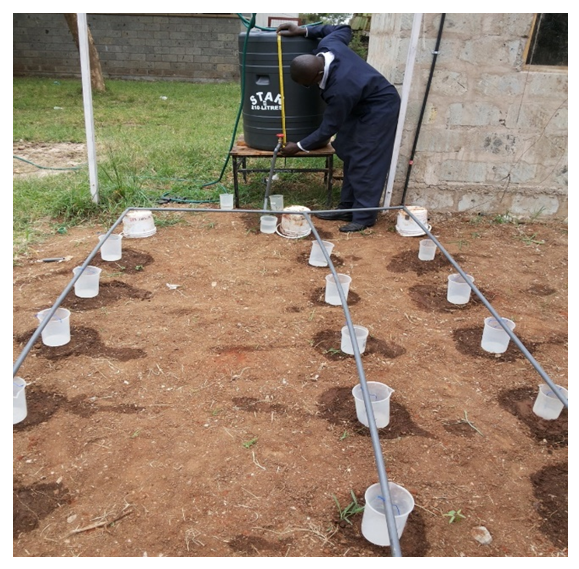 | Figure 2. Layout of the system for discharge collection |
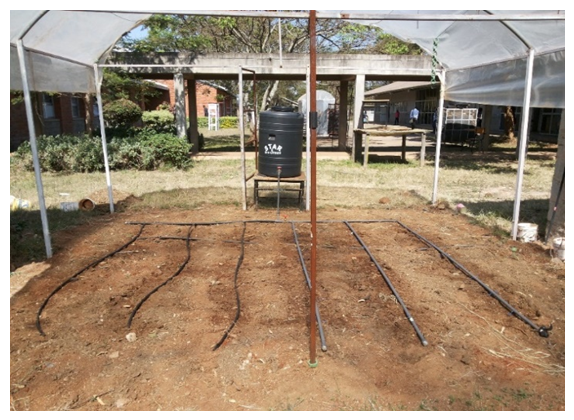 | Figure 3. Layout of the system for testing with crop` |
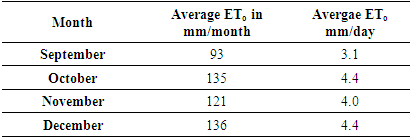
Pressure was varied by regulating the tap from the tank and the pressure head calculated for each run. The amount of water emitted was dependent on the pressure operating head and the duration of water application. Pressure of water was left constant for a period of time and the amount of water released collected in measuring beakers at the same time with some emitters releasing water to the crop roots. Another pressure from the tap was set and the volume of water released determined concurrently as the crops take in water. The behavior of the crop was checked upon the variations of pressure. This variation was dependent on the plant water requirements of the crops from its initial stage to late season stage.The basic formula used for the calculation of the crop water requirement was as follows:ETcrop = kc x EtoWhere: ETcrop = the water requirement of a given crop in mm per unit of time e.g. mm/day, mm/month or mm/season; kc = the "crop factor"; ETo = the "reference crop evapotranspiration" in mm per unit of time e.g. mm/day, mm/month or mm/season.Values of ETo were obtained from Thika Horticultural Station for the months of September, October, November and December. These values were then multiplied by the crop factor of the pinto beans for the different crop growth stages to obtain the crop water requirements per day in order to come up with an irrigation schedule. These values are shown in the table below:Table 1. Average ETo values
 |
| |
|
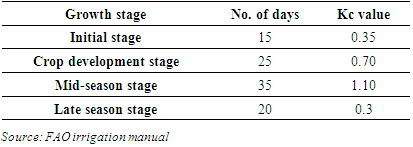
Table 2. Values for the crop factor (Kc) for dry beans and the growth stages
 |
| |
|
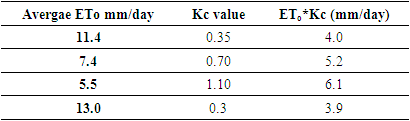
Table 3. Crop water requirements for each stage
 |
| |
|
2.3. Irrigation Water Requirement
Since most drip systems have an overall efficiency of 90% (FAO Irrigation manual), the gross irrigation requirement needs to be calculated. Locally, beans take 3 months to grow i.e. about 95 days. The drippers are constructed by perforating the PVC pipe with a heated nail. To vary the diameter, different nail sizes will be used. A piece of string is threaded through these perforations by means of a bag-needle. The threading should be gentle to avoid enlarging the emitter’s diameter. Knots on both ends of the string prevent it from slipping out of the pipe. Data on the amount of volume collected from each emitter will be recorded including the time for collection. A graph of volume against time will be plotted to determine the discharge. The discharge will then be plotted against the emitter diameter. These measurements will be checked against the crop water requirement for beans and hence determine the optimal size. Furthermore, the results will be compared with those for the conventional drip irrigation system.
3. Results
3.1. Data for Wetted Diameter
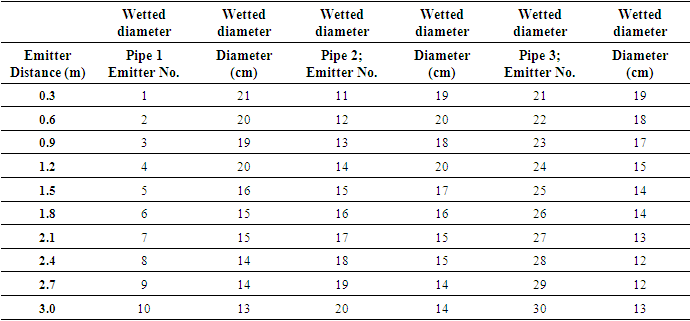
The wetted diameters by each emitter were found as follows; Table 4. Data for wetted diameter
 |
| |
|
3.2. Threaded Drip System
Data from the setup of threaded system using beakers to measure volume of discharge per emitter showed that at pressure 357Pa, the emitter intervals of 0.3m produced an average dicharge of litres per hour of 0.0206lhh. At the pressure of 713Pa, the average emitter discharge was found to be 0.0711lph while at the pressure of 1070Pa, the average emitter discharge was 0.1752lph. The pressure at 1425Pa produced an average discharge of 0.3871lph and finally the pressure at 1784Pa resulted in to an average emitter discharge of 0.7994lph.
3.3. Conventional System
The average emitters discharge for the conventional system was measured and results presented. At the pressure of 357Pa, the conventional emitter intervals of 0.3m produced an average dicharge of litres per hour of 0.0189lhh. At the pressure of 713Pa, the average emitter discharge was found to be 0.0492lph while at the pressure of 1070Pa, the average emitter discharge was 0.07322lph. The pressure at 1425Pa produced an average discharge of 0.08912lph and finally the pressure at 1784Pa resulted in to an average emitter discharge of 0.4234lph.
3.4. Soil Analysis
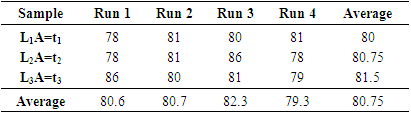
Diameter of glass tube (d) = 0.8 cm; Diameter of soil sample (D) = 5.0 cm; Length of flow (L) = 10.0 cm; Initial water level (h1) = 30.6 cm; Final water level (h2) = 20.6 cm.Table 5. Time interval
 |
| |
|
ComputationThe average Hydraulic conductivity (K) was calculated with the equation 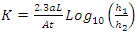 and found to be 7.864*10-3. Where
 and
and  .Sieve particle analysis
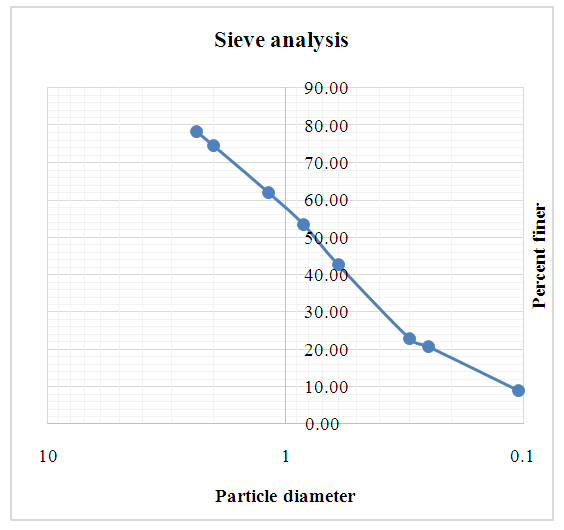 | Figure 4. Graph of sieve particle distribution |
According to USDA Classification for diameter limits, the graph above showed that 20% was made up of fine sand i.e. 0.10-0.25mm; 18% was made up of medium sand i.e 0.25-0.5mm; 20% was made up of coarse sand 0.5-1mm.
3.5. Irrigation Scheduling
3.5.1. Initial Stage (15 Days)
Crop = Pinto beans; Area = 9m2; Root zone depth = 30cm; Maximum allowable deficit (MAD) = 40%; ETo (mm/day) = 11.4 mm/day; Kc = 0.35; Soil texture = Loamy clay; Bulk density = 1.4 gm/cm3; Field capacity = 32%; Wilting point = 15%; Available moisture = 17%; Daily peak season water demand = ET0 * Kc =4mm/day; Gross daily demand (mm/day), assuming 90% efficiency = 4.4 mm/day; Available moisture by volume =  Total available moisture:
  cm; Water content at 40% MAD:
  = 2.88 cm; No. of day after irrigation is due =
  = 7 days.
3.5.2. Crop Development Stage (25 Days)
Root zone depth = 46 cm; Maximum allowable deficit (MAD) = 40%; ETo (mm/day) = 7.4 mm/day; Kc = 0.70; Soil texture = Loamy clay; Bulk density = 1.4 gm/cm3; Field capacity = 32%; Wilting point = 15%; Available moisture = 17%; Daily peak season water demand = ET0 * Kc =5.2mm/day; Gross daily demand (mm/day), assuming 90% efficiency = 5.72 mm/day.Available moisture by volume:  Total available moisture:
  Water content at 40% MAD:
  = 4.42 cm; No. of day after irrigation is due:
 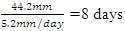 .
.
3.5.3. Mid-Season Stage (35 Days)
Root zone depth = 61cm; Maximum allowable deficit (MAD) = 35%; ETo (mm/day) = 5.5 mm/day; Kc = 1.1; Soil texture = Loamy clay; Bulk density = 1.4 gm/cm3; Field capacity = 32%; Wilting point = 15%; Available moisture = 17%; Daily peak season water demand = ET0 * Kc =6.1mm/day; Gross daily demand (mm/day), assuming 90% efficiency = 6.7 mm/day.Available moisture by volume: Total available moisture =
  cm; Water content at 35% MAD =
  = 5.12 cm; No. of day after irrigation is due:
  .
.
3.5.4. Late Season Stage (20 Days)
Root zone depth = 65cm; Maximum allowable deficit (MAD) = 50%; ETo (mm/day) = 13 mm/day; Kc = 0.3; Soil texture = Loamy clay; Bulk density = 1.4 gm/cm3; Field capacity = 32%; Wilting point = 15%; Available moisture = 17%; Daily peak season water demand = ET0 * Kc =3.9mm/day; Gross daily demand (mm/day), assuming 90% efficiency: 4.3 mm/day.Available moisture by volume:  Total available moisture =
  Water content at 40% MAD =
  cm; No. of day after irrigation is due:
  .
.
3.6. Calculation of Emitter Discharge Requirements
The rule of thumb on converting an irrigation depth and interval into a continuous water flow is given as: 8.64 mm/day = 1.0 litre/sec.hectare. In other words, an irrigation application of 8.64 mm per day corresponds to a continuous water flow of 1.0 litre per second per hectare.
3.6.1. Initial Stage
Given 8.64 mm/day = 1.0 litre/sec.hectare; for 4mm/day =  Litres/sec.haBut 1ha=0.463 litres/sec.ha, therefore, 0.0009ha (9m2) =
  Converting to litres per hour =
  Discharge per emitter:
3.6.2. Crop Development Stage
Given 8.64 mm/day = 1.0 litre/sec.hectare; for 5.2mm/day =  Litres/sec.haBut 1ha=0.602 litres/sec.ha, therefore, 0.0009ha (9m2) =
  Converting too litres per hour =
  Discharge per emitter:
3.6.3. Mid-Season Stage
Given 8.64 mm/day = 1.0 litre/sec.hectare; for 6.1mm/day =  Litres/sec.haBut 1ha=0.706 litres/sec.ha, therefore, 0.0009ha (9m2) =
  Converting too litres per hour =
  Discharge per emitter:
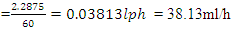
3.6.4. Late Season Stage
Given 8.64 mm/day = 1.0 litre/sec.hectare; for 3.9mm/day =  litres/sec.haBut 1ha=0.451 litres/sec.ha, therefore, 0.0009ha (9m2) =
  Converting too litres per hour =
  Discharge per emitter:
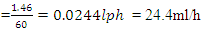
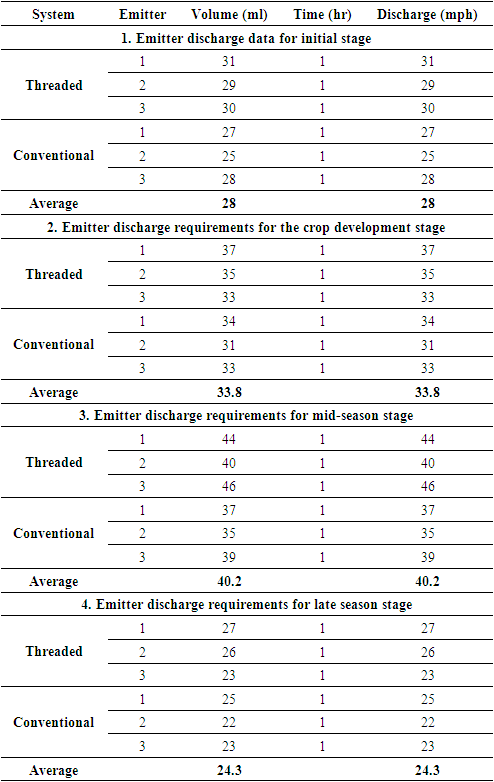
3.7. Emitter Discharge Requirements
Table 6. Emitter discharge results for different stages of the crop growth
 |
| |
|
4. Discussion
4.1. Relationship between Emitter Flow Rate and Pressure
The flow rate versus pressure head relationship plays a vital role in the characterization of emitters. It is one of the key factors in selecting an emitter and system design. In this study, a relationship between flow rate and pressure was developed using a linear equation in Microsoft excel. The increase in pressure from 357Pa to 1784Pa gave a steady increase in the emitter discharge. Large volumes of water were collected in the beakers at the 1425Pa and 1784Pa pressures within a short period of time. The discharge-pressure equation in Figure 5 exhibited an R2 value of 0.9946 for the threaded drip and 0.9648 for the conventional drip. Thus, it can be said, this equation accurately described the flow-pressure relationship.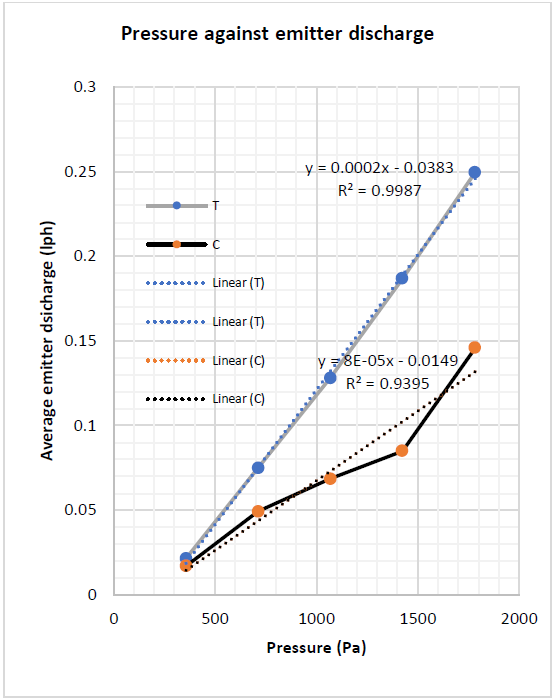 | Figure 5. Graph of pressure against discharge for the threaded drip and conventional drip |
As the pipe length increases, the discharge from emitters at the end of the pipe reduces. This is due to frictional losses along the pipe walls and the connection joints. In a normal farm layout, the thread can be place to towards the root zone to supply water at the root points. Water conservation and application uniformity must be increased as water supplies for agriculture is diminishing day by day, which increases the relative importance of low pressure drip irrigation systems. In low pressure drip irrigation system, losses of water from deep percolation, evaporation and runoff are minimal, water application is uniform.From the graph below (figure 6) it can be seen that both the conventional system and the threaded system behave in a similar manner such that emitter discharge increases with an increase in pressure. However, values for the threaded system are higher than those for the control. This could be due to the fact that the size for the emitters in the threaded drip were slightly larger than those for the control because an allowance had to be made for the thread to pass through given that it was 18mm in size.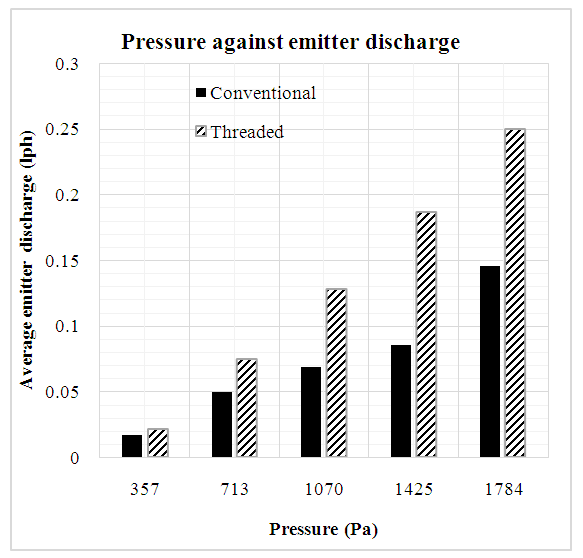 | Figure 6. Representation of the pressure-discharge relationship for the conventional and threaded system on on a bar graph |
4.2. Wetted Diameter and Distance
Diameters of wetted area were measured for both the threaded string and conventional drip systems. The first two pipes for the threaded drip which had the same emitter diameters produced nearly the same curves when plotted in the graph. The diameters reduce from the first emitter to the furthest ones causing the graph to have a decreasing slope. This could be due to frictional losses in the pipe which is directly proportional to pipe length. Comparing the two graphs (threaded and conventional drip) gives an almost similar scenario as shown in Figure 7 and 8 below.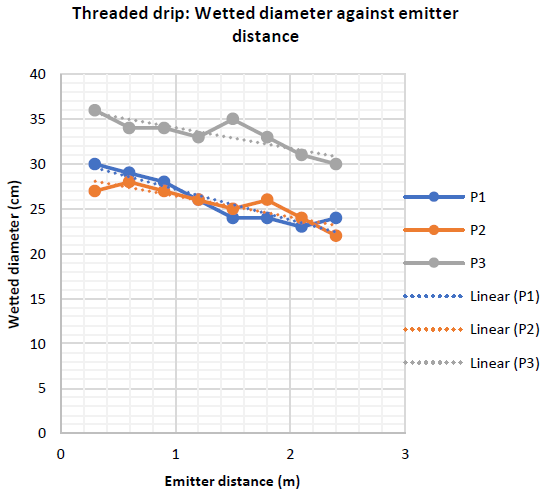 | Figure 7. Graph showing relationship between the wetted diameter and distance for the threaded drip |
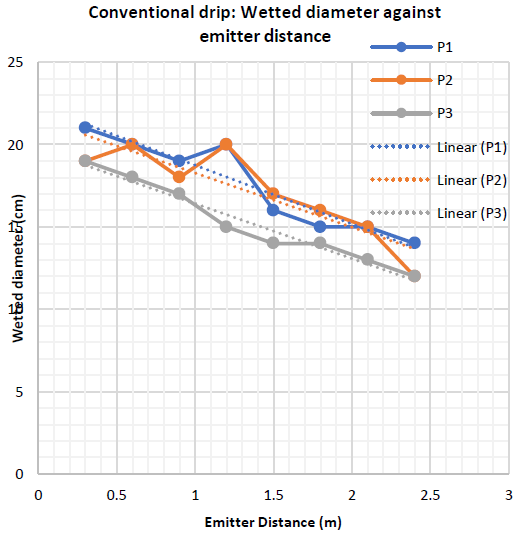 | Figure 8. Graph showing relationship between the wetted diameter and distance for the conventional system |
For the conventional drip above (Figure 8), all the three pipes had the same emitter diameter hence their wetted diameters in the graph had similar characteristics.
4.3. Distribution Uniformity
High EU is achieved by maintaining a limited variation in discharge rate among system emitters. Proper maintenance of filters is also vital for preserving system EU. Emitter clogging and uneven pressure distribution are the major factors contributing to disparity in discharge rate and poor uniformity. Upgrading EU to 90% could save on water, power and fertilizer bills, improve irrigation efficiency and crop yield, preserve the environ- ment, and enhance grower's net profit. Annual evaluation of EU is recommended for monitoring system performance and pinpointing problems.The graph below the shows the relationship between pressure and the distribution uniformity of both the conventional system and threaded drip system.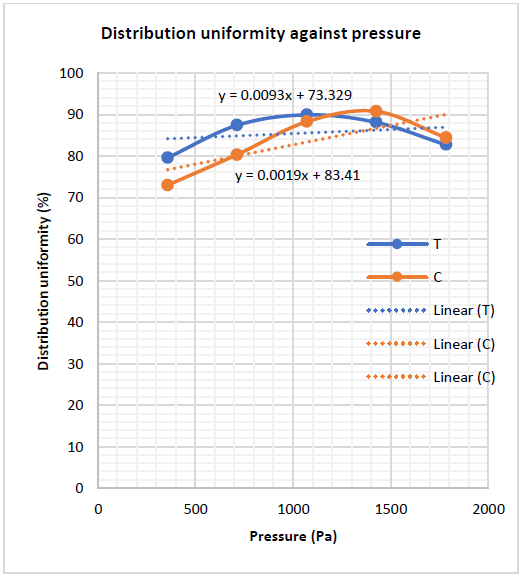 | Figure 9. Graph of Distribution uniformity and Pressure |
For low pressures below 1000Pa, the distribution uniformity for both the threaded drip and conventional system increased with an increase in pressure as observed in the graph above (Figure 9). Both systems had an equal distribution uniformity of 89.5% at 1200Pa which is considered very good in terms of efficiency. This could be due to equal pressure distribution throughout the pipe making uniform emission. For pressures above 1200Pa, the graph of the threaded drip system gradually begins to fall. This also occurs for the conventional system, however, it takes place from a slightly higher pressure of 1425Pa.
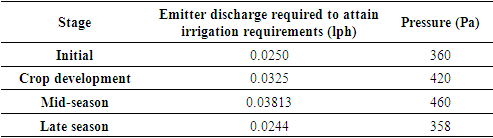
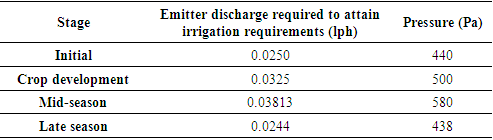
4.4. Evaluation of the System Using the Crop
Both systems were set up in such a manner as to attain the water requirements for the pinto beans. The optimal pressure for the different crop stages was obtained from the pressure-discharge graph and recorded in the table below:Table 7. Optimal pressure required to attain crop water requirements (Threaded drip system)
 |
| |
|
Table 8. Optimal pressure required to attain crop water requirements (Conventional system)
 |
| |
|
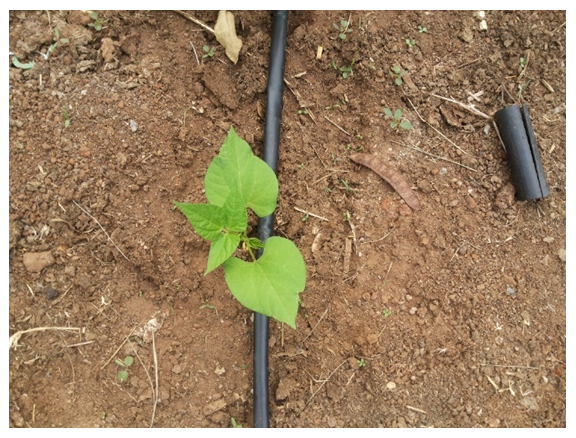 | Figure 10. Crop growth at Initial stage (Conventional system) |
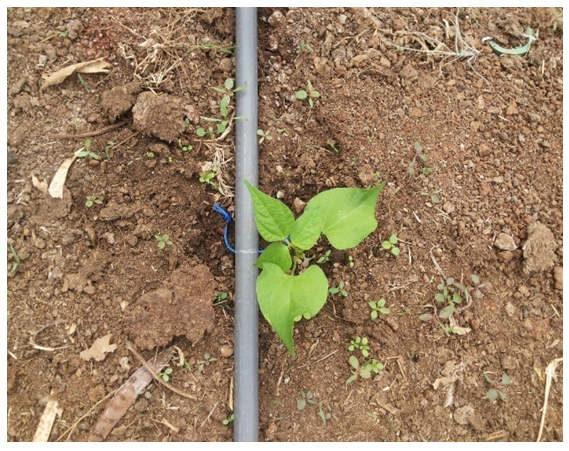 | Figure 11. Crop growth at Initial stage (Threaded system) |
The threaded drip system required less pressure to emit the same amount of discharge as the conventional system. This may have been due to the slightly larger size of emitter diameter as compared to the conventional system because of the need to cater for the size of the thread.
5. Conclusions
This study revealed some new information regarding the relationship between pressure and distribution uniformity for both the threaded drip system and conventional system. It was found that distribution uniformity increased with increase in pressure up to a certain maximum level after which it begins to fall. The maximum level in this case was 90% which is actually considered excellent in terms of efficiency and this was at a pressure of 1200Pa. Thus, optimal pressure that would give the highest distribution uniformity was 1200Pa. Emitter discharge and wetted diameter were found to decrease with increase in distance from the source which was attributed to pressure losses experienced in the pipes due to friction.The optimal pressure required to attain discharge that would fulfil the crop water requirements at each stage was found to be 360Pa for the initial stage, 420Pa for the crop development stage, 460Pa for the mid-season stage and 358Pa for the late season stage. These values were slightly lower than those for the conventional system given that the threaded system had slightly larger emitter diameters to be able to accommodate the thread whose use was for unclogging. The threaded drip system was found to have almost similar characteristics with regards to the conventional system given that their graphs had more or less the same trend. The only difference could have been the emitter diameter sizes as a result of the size of the manila thread used.The threaded string costs nearly half the conventional drip irrigation kits. It is also simple to make and to maintain since clogging is maanageable. It also saves on water required for crop irrigation due to its simplicity in operation. With all these, local farmers can easily adopt it with greatest crop production (Savva, (2002). These outcome of the study will enable its efficient application to the small holder farmers. The perforated drip irrigation may add to the new developments and technologies for irrigation farming practices in Kenya which will contribute to additional alternatives considered in choosing irrigation methods. Kenyan farmers will be made aware of the new system and educated on its expected benefits to encourage implementation. This system can be replicated anywhere in Kenya.
References
| [1] | Adhikari, D. (2000). Simplified and low cost drip irrigation manual. International Development Enterprises, Kathmandu, Nepal. |
| [2] | Raphael, O. D., Amodu, M. F., Okunade, D. A., Elemile, O. O., & Gbadamosi, A. A. (2018). Field Evaluation of Gravity-Fed Surface Drip Irrigation Systems in a Sloped Greenhouse. International Journal of Civil Engineering and Technology (IJCIET), 9(10), 536-548. |
| [3] | Savva, A. P., & Frenken, K. (2002). Crop water requirements and irrigation scheduling (p. 132). Harare: FAO Sub-Regional Office for East and Southern Africa. |
| [4] | Mason, B., Rufí-Salís, M., Parada, F., Gabarrell, X., & Gruden, C. (2019). Intelligent urban irrigation systems: Saving water and maintaining crop yields. Agricultural Water Management, 226, 105812. |
| [5] | Doria, R., Madramootoo, C. A., & Mehdi, B. B. (2006, May). Estimation of future crop water requirements for 2020 and 2050, using CROPWAT. In 2006 IEEE EIC Climate Change Conference (pp. 1-6). IEEE. |
| [6] | Narayanamoorthy, A. (2008). Water saving technologies as a demand management option: potentials, problems and prospects. Strategic Analyses of the National River Linking Project (NRLP) of India: Promoting Irrigation Demand Management in India: Potentials, Problems, and Prospects, 3, 93. |
| [7] | Keller, Jack and Ron Bliesner. 2000. Sprinkler and Trickle Irrigation. ISBN: 1-930665-19-9. Blackburn Press, Caldwell, New Jersey. |
| [8] | Khosa T, Averbeke W V, Böhringer R, Maswikaneng J and Albertse E. 2003. The ‘Drum and Drip’ Micro-irrigation System, Tested in South Africa. |
| [9] | Marriam, J.L. and L. Keller. 1978. Farm irrigation system evaluation: A guide for management. Utah State University, Logan, Utah. Dept. of Agricultural & Irrigation Engineering. |
| [10] | Maswikaneng, M. J. & Albertse, E. 2002. Extension domains among urban farmers in Atteridgeville (Pretoria, South Africa). Journal of International Agricultural and Extension Education, 9(2): 15-22. |
| [11] | Ngigi, S.N., 2008. Technical evaluation and development of low-head drip irrigation systems in Kenya. Irrigation and Drainage, 2008. Published online in Wiley Inter-science, DOI: 10.1002/ird.360Proceedings of Micro Irrigation Congress 1995, Orlando, FL, USA. |
| [12] | Sijali, I. V. 2001. Drip Irrigation-Options for smallholder farmers in eastern and southern Africa. Technical Handbook No. 24. |
| [13] | Suryawanshi, Sudarshan. 2000. Affordable Micro Irrigation Technology, International Development Enterprises, Delhi, India. |
| [14] | Hinrichsen, D., & Tacio, H. (2002). The coming freshwater crisis is already here. The linkages between population and water. Washington, DC: Woodrow Wilson International Center for Scholars, 1-26. |

 Abstract
 Reference
 Full-Text PDF
 Full-text HTML