-
Paper Information
- Paper Submission
-
Journal Information
- About This Journal
- Editorial Board
- Current Issue
- Archive
- Author Guidelines
- Contact Us
Resources and Environment
p-ISSN: 2163-2618 e-ISSN: 2163-2634
2022; 12(3): 88-97
doi:10.5923/j.re.20221203.03
Received: Nov. 8, 2022; Accepted: Nov. 15, 2022; Published: Dec. 6, 2022

Aerosols Characteristics in Two Cities Characterized by Different Levels of Air Pollution: Cairo and Qena/ Egypt
 Abstract
 Reference
 Full-Text PDF
 Full-text HTML
Khalafallah Omar Kassem1, 2, Eman Fouad El-Nobi2
1Physics Department, College of Science, Jouf University, Sakaka, Saudi Arabia
2Physics Department, Faculty of Science, South Valley University, Qena, Egypt
Correspondence to: Khalafallah Omar Kassem, Physics Department, College of Science, Jouf University, Sakaka, Saudi Arabia.
| Email: |  |
Copyright © 2022 The Author(s). Published by Scientific & Academic Publishing.
This work is licensed under the Creative Commons Attribution International License (CC BY).
http://creativecommons.org/licenses/by/4.0/

This paper introduces the aerosol characteristics in two cities, Cairo and Qena, Egypt. The two cities are characterized by different levels of air pollution. Aerosol characteristics are studied by comparing the aerosol optical depth (AOD) and angstrom exponent,  as well as its second derivative,
  The used data are collected from the AERONET network constructed in the two cities. The results indicated that the two cities, Cairo and Qena, are characterized by different levels of air pollution and aerosol characteristics. Comparison of the AOD values at three wavelengths (340,500 and 870 nm) in Cairo and Qena, and comparison of the monthly mean distribution of Ångström wavelength exponent (α) at three wavelength bands (440–870, 440–675, and 675–870 nm), indicated the presence of a bimodal AOD distribution with primary and secondary maxima in April in both Cairo and Qena and in Nov in Cairo and in Oct in Qena. Results of the correlation between Angstrom wavelength exponent α computed at shorter (380-440 nm) and longer (675-870 nm) wavelengths in Cairo and Qena have shown that the curvature in Cairo is negative in 33% of total cases indicating the presence of fine mode aerosols, while in Qena, the curvature is rarely negative; 5% of total cases, indicating the presence of coarse-mode aerosols. Finally, values of the second derivative
  at Cairo and Qena are discussed as a function of
  nm. In Cairo, Positive
  values indicate predominately fine mode bimodal size distributions with the value of
  increases as the fine mode increasingly dominates over the coarse and as the fine mode particles increase in size. While in Qena, the coarse mode dominated desert dust cases typically show
  values near zero or slightly negative.
Keywords: Aerosol Optical Depth, Ångström exponent, Qena, Cairo
Cite this paper: Khalafallah Omar Kassem, Eman Fouad El-Nobi, Aerosols Characteristics in Two Cities Characterized by Different Levels of Air Pollution: Cairo and Qena/ Egypt, Resources and Environment, Vol. 12 No. 3, 2022, pp. 88-97. doi: 10.5923/j.re.20221203.03.
Article Outline
1. Introduction
- Numerous industrial and urbanization activities have been introduced in Egypt during the past few decades leading to increasing environmental problems, such as air pollution, particulate matter, gasses, and aerosols to high levels exceeding the world health organization (WHO) levels, especially in Cairo [1,2]. Atmospheric aerosols play an important role in climate, their radiative forcing, on a global average, is likely to be comparable in magnitude to the radiative forcing of about 2.4 W m−2 by anthropogenic greenhouse gases [3]. Nevertheless, their effect is difficult to estimate, mainly because there is incomplete knowledge of their optical properties [4,5], resulting thus in a large uncertainty regarding the aerosol overall radiative forcing [6-8]. This may be due to the difference in the degree of mixing and variability between the gasses and the aerosols in the atmosphere, gasses are well-mixed, while aerosols are inhomogeneous and have highly special and temporal variability. There are a rather limited number of general categories of aerosol types with distinct optical properties. In general, aerosols can be classified into the following four aerosol types, which are associated with different sources and emission processes, and they exhibit significantly different optical properties: 1) biomass-burning aerosols, produced by forest and grassland fires, 2) urban/industrial aerosols from fossil fuel combustion in populated urban/industrial regions, 3) desert dust blown into the atmosphere by wind, and 4) aerosols of maritime origin. [9]Aerosol optical depth AOD
 represents the extinction of radiation at wavelength
  resulting from the atmospheric aerosols [10]. The wavelength dependence of AOD varies between different aerosol types because of their different physical and chemical characteristics. AOD wavelength dependence is expressed by the Angstrom exponent α which is the slope of the wavelength dependence of the AOD in logarithmic coordinates [11].
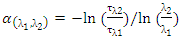 | (1) |
 ) concentrations and its affect by the meteorological parameters. Results indicated that the average mass concentration of total suspended particulate matter was 158.3 ± 40.1 μg/m3, the winter average value was 182.5 μg/ m3, while the summer average value was 132.5 μg/m3. In the entire study period, TPM particles have irregular, spherical and aggregated shapes. Also, they analyzed the chemical constituents of the TPM. Elemental analysis indicates that C, Si, and Ca were the abundant elements in the particles followed by Al, Na, and Fe. In addition, the study utilized the AOD level measured from satellite data. In [32] the effect of long-range transport on the particulate matter concentration in Qena is studied. The study revealed that most air mass trajectories are found in the northern clusters during the whole period as well as during spring, summer, and autumn. North Africa and the southwest of Turkey are found to be the most probable sources of
  during spring and all the study period.
2. Study Area, Data, and Methodology
- Egypt, as shown in figure (1), is located northeast of Africa and consists mainly of two desert plateaus separated by the narrow Nile valley. The western desert is larger than the eastern desert. The Nile valley becomes large in the north and forms the Delta; the main agricultural area in Egypt. Cairo is located at the beginning of the branching of the Nile into the Rashid and Damietta branches. Due to the huge desert areas and the large population as well as increased industrialization, the common sources of the aerosols in Egypt can be classified as (1) sand and dust particles blown from desert areas, especially during the windy season (spring ) [33], (2) Sea salt from the Mediterranean Sea transported by northern and north-west air masses (31Kassem, Kh. O. 2008), (3) biomass burning in the Nile valley and the delta, (4) local activities from industrial and urbanized areas. Cairo is the capital of Egypt and the largest and most important city in Egypt. It is the largest Arab city in terms of population and area, and occupies the second place in Africa and seventeenth in the world in terms of population, with a population of 21,322,750 million people according to statistics in 2021. They represent 20% of the total population of Egypt. Qena is located in Upper Egypt 600 km south of Cairo, east of the Nile River. It is the capital of Qena Governorate and its largest city, its population is 350 thousand people.
 | Figure 1. Map of Egypt |
3. Results and Discussion
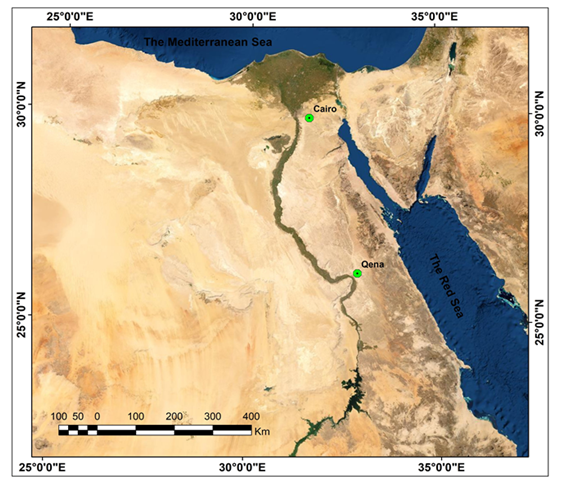
- Figure (2) shows the monthly mean variation of AOD values at three wavelengths (340,500 and 870 nm) in Cairo and Qena using Box and Whisker plots. In Cairo, the values increased from low values (0.21 -0.38) in Jan to record relatively high values (0.33—0.55) and (0.26 – 0.74) in April and Nov., respectively. While in Qena, the values increase gradually from (0.07-0.13) in Dec. to a maximum value (0.27 – 0.31) in April, then decrease from April to (0.12 – 0.20) in Aug, after that increases again to (0.17 – 0.28) in Oct. These behaviors illustrate a bimodal AOD distribution with primary and secondary maxima in April in both Cairo and Qena and in Nov in Cairo and in Oct in Qena (There is no available data in Nov. in Qena). The results thus obtained are compatible with the maximum values of AOD found by [27] in April and Oct. and with the results found by [28] in Cairo. The large range of Box for AOD340 in Feb and Nov in Cairo gives a sign of large variability in the fine mode aerosols, while the large range of Box for AOD870 in April and Nov gives a sign of large variability in the coarse mode aerosols. This result also is following that found by [28], who found that in May and Oct, there was a pronounced presence of AOD, using daily data of MODIS over Egypt. They stated that the source of the coarse mode aerosols is the dust storms that frequently occur in spring due to the prevalent Khamasin wind in this season. In Qena, there is a pronounced range of the Box for AOD340 and AOD870 in April and May, indicating a large variability in the fine and coarse mode aerosols. The monthly mean values of AOD340 are greater than that of AOD500 and AOD870 in all the months in Cairo and Qena. The significant monthly variation in the range of AOD at particular wavelengths indicates more or less homogeneity in the aerosol burden. The large intra-monthly variability in aerosol burden exhibits in April and May in Qena and in Nov in Cairo. In Qena this is the time of Khamasin winds and sugar cane agricultural wastes burning, while in Cairo, it is the time of black cloud formation due to the rice agricultural wastes burning [28]. The large range of Box for AOD340, AOD 500, and AOD 870 in Qena during April and May gives a sign of large variability in the fine and coarse mode aerosols during those two months, while this case is more pronounced in Nov in Cairo, although all the months in Cairo are characterized by pronounced ranges of Box in comparison with that in Qena. In addition, throughout the year, there is a large range of AOD340 boxes compared to AOD500 and AOD870 in Cairo, indicating the presence of fine mode aerosol burden in the atmospheric column and expressing the influence of anthropogenic aerosol. this case is found to a less extent in Qena.
 | Figure 2. Monthly mean distribution of spectral aerosol optical depth at 340 nm, 500 nm, and 870 nm in Cairo (a) and Qena (b). Upper and lower whiskers represent the maximum and minimum values, respectively, Upper and lower ends of the box represent the third and first quartiles, respectively, and the interior horizontal line represents the mean values |
 compared to
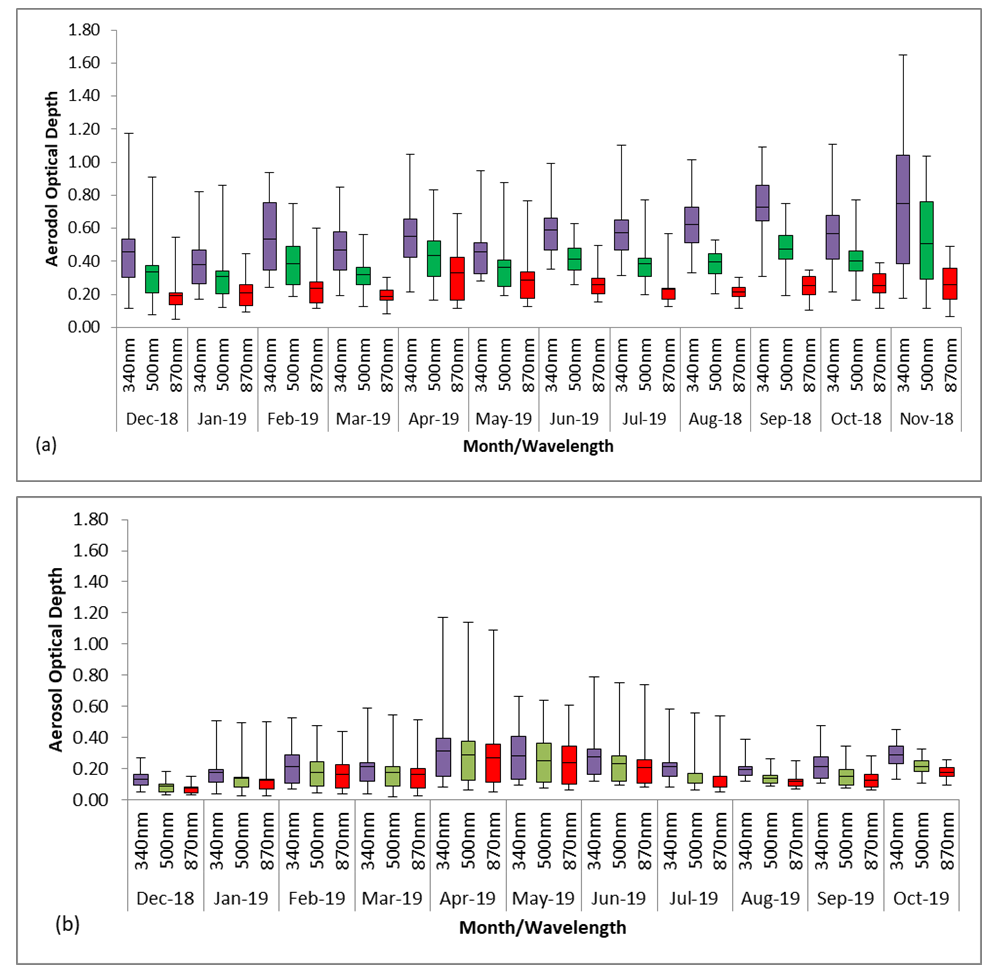
  with the difference between the two values is larger in Qena compared to that in Cairo. This Indicates clear positive curvature and clear dominance of coarse particles in Qena. The phenomenon is less pronounced in Cairo due to a large amount of local anthropogenic particles. In Both Cairo and Qena, we can notice that mean values of α at long wavelength interval (675-870) nm are less than the mean α at short wavelength interval (440-675) nm in the whole period of study. This is due to the presence of mineral dust in the two cities, especially in Qena, where the differences are more significant [15].
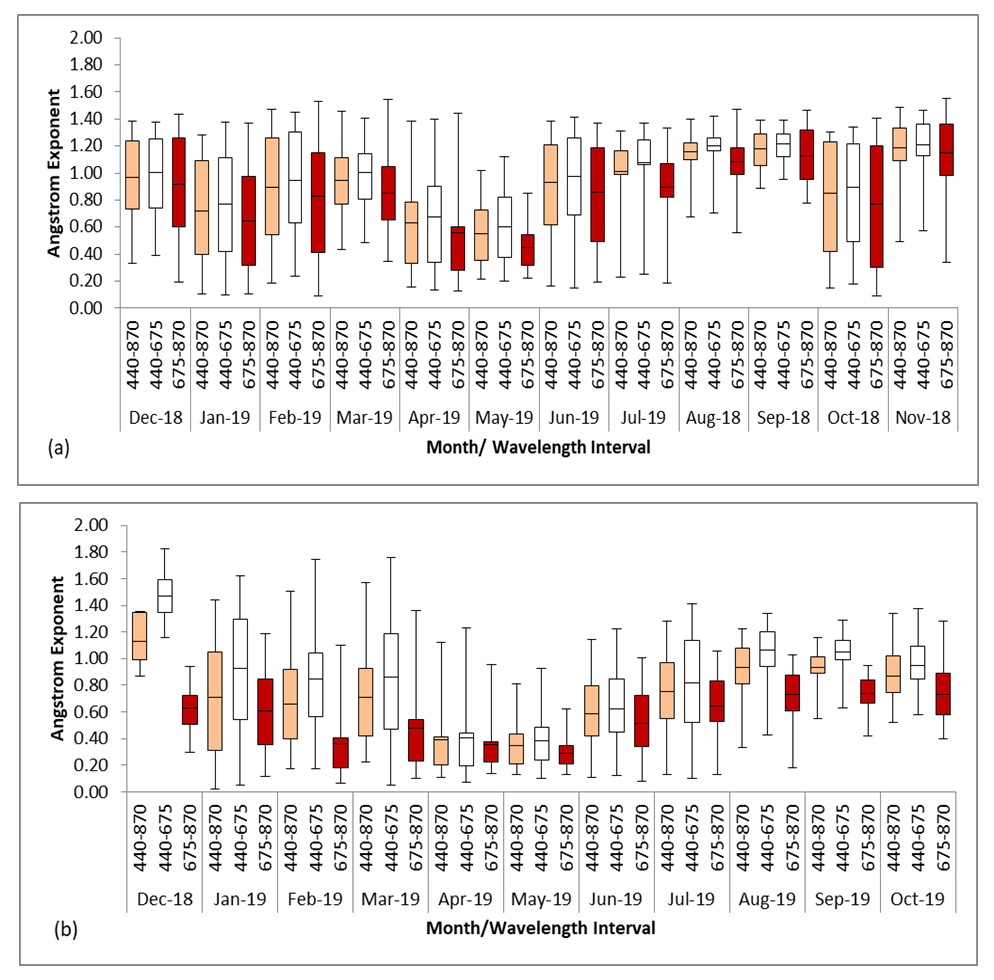 | Figure 3. Monthly mean distribution of Ångström wavelength exponent (α) at three wavelength bands (440–870, 440–675, and 675–870 nm) in Cairo (a) and Qena (b). Upper and lower whiskers represent the maximum and minimum values, respectively, Upper and lower ends of the box represent the third and first quartiles, respectively, and the interior horizontal line represents the average values |
 and indicate the presence of fine mode aerosols, while, points located in the lower part of the figure
  represent positive curvature and indicate the presence of coarse-mode aerosols. So, it is found that the curvature in Cairo is negative
  in 33% of total cases, while in Qena, the curvature is rarely negative; 5% of total cases. This result reflects the difference between the nature of the aerosol load in a big –urban city such as Cairo and a relatively small city characterized by a relatively clean atmosphere in comparison with that of Cairo. In addition, the difference in the AERONET stations located in the two cities; in Cairo, it is located in the middle of the city, while in Qena, it is located in a suburb desert region far away from the pollution sources. From the figure we can see that both Cairo and Qena are affected by the coarse mode aerosols generated from the desert surrounding them; Cairo is affected in 67% of the total cases while Qena is affected in 95% of the total cases. These results are following that found in Altafloresta (Urban city) and Solar village (dessert), respectively, [37].
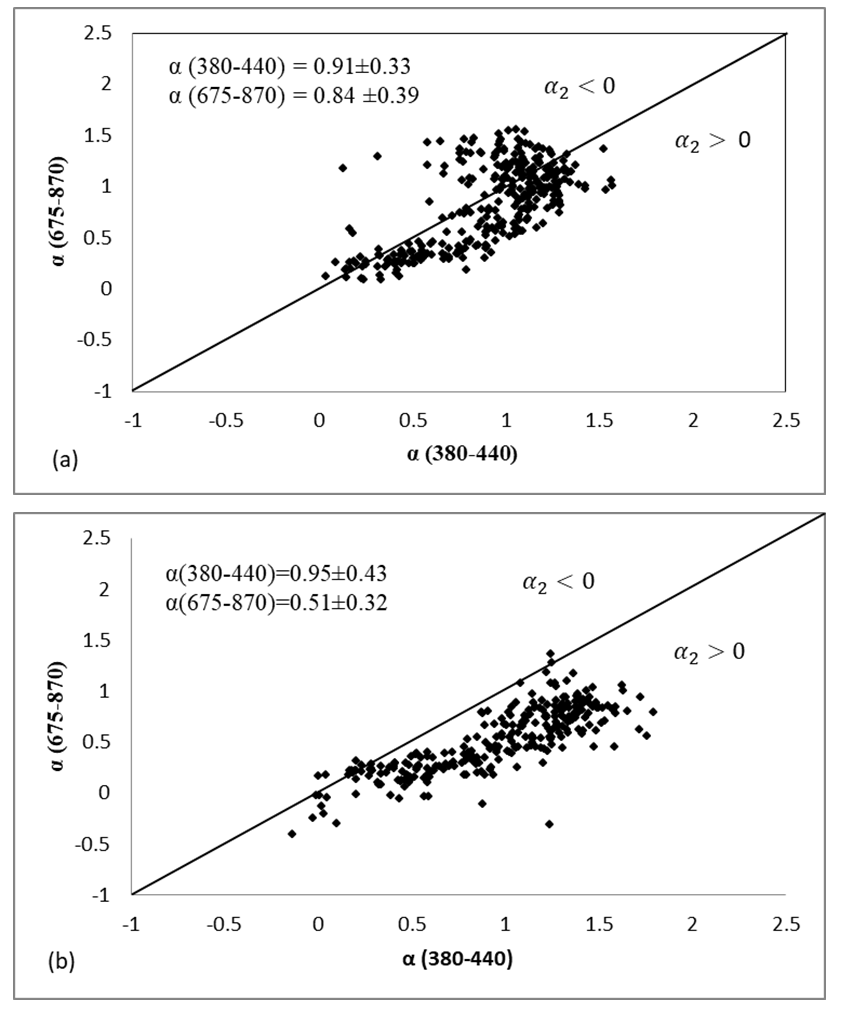 | Figure 4. Regression between the values of Angstrom wavelength exponent α computed at shorter (380-440 nm) and longer (675-870 nm) wavelengths for the two sites (a) Cairo and (b) Qena. The one-to-one line is also shown together with  values implying positive (concave type) and negative (convex type) curve related to equation 5 values implying positive (concave type) and negative (convex type) curve related to equation 5 |
 | (2) |
 | (3) |
 and
and  as a function of atmospheric turbidity represented as means of
  is shown in figure (5) for the two cities. In this figure, positive and negative differences are indicative of positive and negative curvatures, respectively. While differences near zero indicate the absence of the spectral variability in the Angstrom exponent. In this figure, we can notice that in Cairo, there is an increase in the range of differences with increasing turbidity. The differences become negative as the atmospheric turbidity increases as a result of increasing the fine mode particles ratio. This result is following that found in Alta Floresta [37]. We can notice that in Cairo, the differences are purely negative for small turbidity: AOD ranges from 0.1 to 0.2. Negative differences increase for AOD range from 0.2 to 0.7. Then, most of the differences become negative for AOD greater than 0.7. In Qena, the differences are positive for most cases, as shown in figure 4 (b), while the differences tend to be zero for high turbid dust conditions, with AOD larger than 0.5. This result is following that found by [15,37].
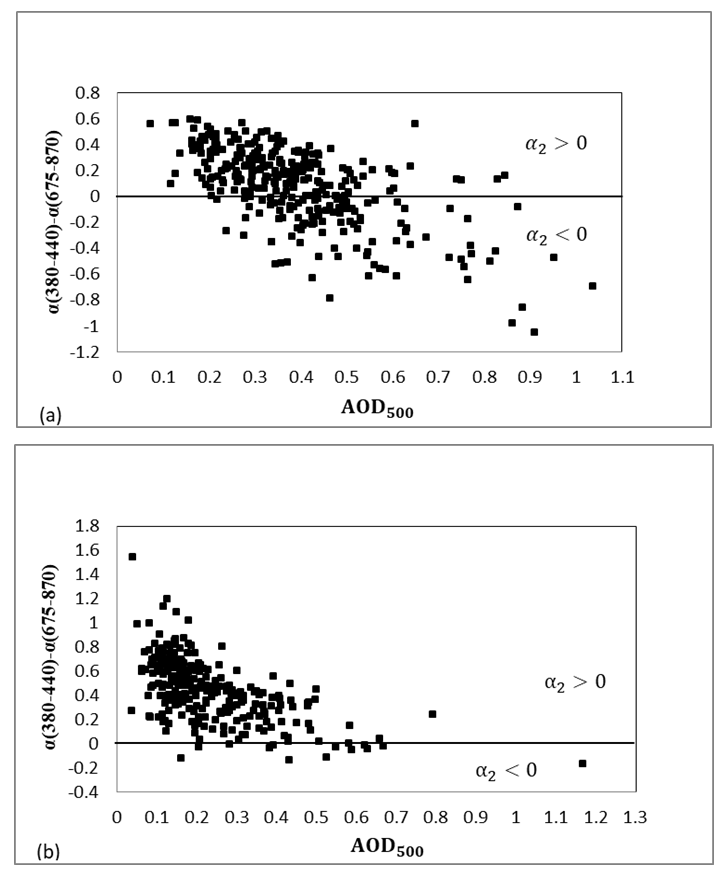 | Figure 5. Correlation between the differences of Angstrom exponent,  and AOD for the two sites (a) Cairo and (b) Qena and AOD for the two sites (a) Cairo and (b) Qena |
 versus ln λ relationship (Angstrom exponent) in the two cities, we utilize the parameter
  (the second derivative of α) defined by [15] as the derivative of α concerning ln λ. The parameter
  is computed from the relation:
  | (4) |
 is a measure of the rate of change of the Angstrom exponent with the logarithm of the wavelength. Figure (6) represents the relationship between the instantaneous values of
  and the AOD 500 during the same period of the study. When
  is equal to zero there is no curvature in the ln
  versus ln λ relationship and therefore the Angstrom expression fits the data best.
 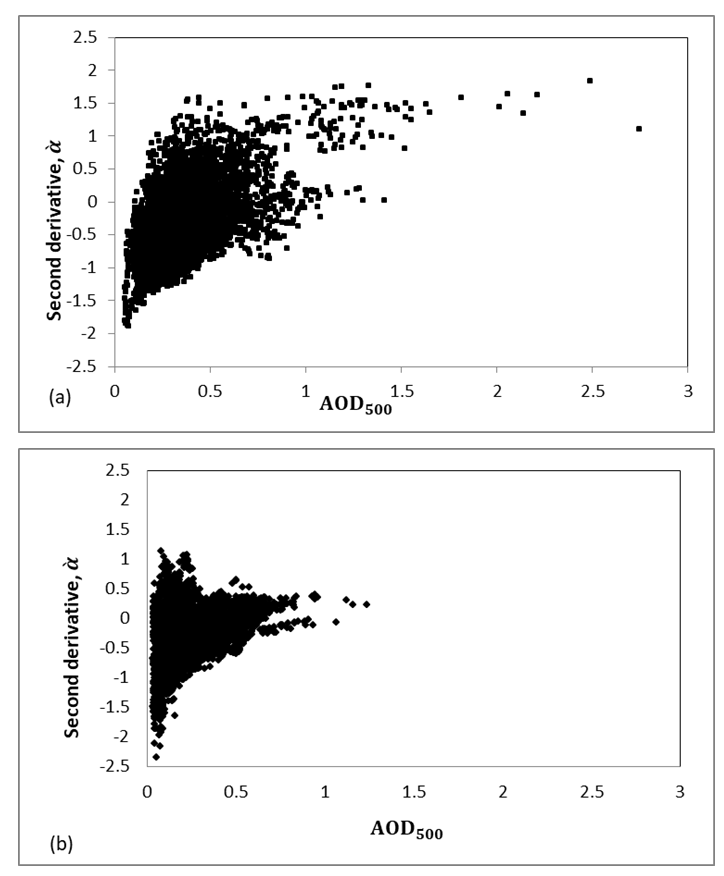 | Figure 6. Values of the second derivative  computed from instantaneous values of computed from instantaneous values of  at 380, 500, and 870 nm at Cairo (a) and Qena (b) as a function of at 380, 500, and 870 nm at Cairo (a) and Qena (b) as a function of  nm nm |
 , especially as AOD500 increases, due to the strong optical influence of fine-mode particles at the higher optical depth [37]. Positive
  values typically occur in predominately fine mode bimodal size distributions with the value of
  increasing as the fine mode increasingly dominates over the coarse mode and as the fine mode particles increase in size [15,38-40]. In Qena we can see that the values of the differences are more close to zero, as shown in Figure (6, b), indicating the presence of coarse particles, since this site is strongly influenced by desert dust. It is found that the coarse mode dominated desert dust cases show
  values near zero or slightly negative [15,16]. Negative
  occurs when α (380 - 500 nm) is larger than α (500-870). This occurs as a result of bimodal size distributions at relatively low optical depths, with fine mode particles dominating the wavelength dependence of AOD at short wavelengths and coarse mode particles dominating the wavelength dependence at longer wavelengths [16]. From figure (6 a,b) we can conclude that both Cairo and Qena are affected by the desert dust coarse particles that make
  negative.
4. Conclusions
- Summing up the results, it can be concluded that from the comparison of the monthly mean values of AOD at three wavelengths (340,500 and 870 nm) in Cairo and Qena, and the monthly mean distribution of Ångström wavelength exponent (α) at three wavelength bands (440–870, 440–675 and 675–870 nm), there is a bimodal AOD distribution with primary and secondary maxima in April in both Cairo and Qena and in Nov in Cairo and Oct in Qena. In addition, the correlation between Angstrom wavelength exponent α computed at shorter (380-440 nm) and longer (675-870 nm) wavelengths in Cairo and Qena indicated that the curvature in Cairo is negative in 33% of total cases indicating the presence of fine mode aerosols, while in Qena, the curvature is negative only in 5% of total cases, indicating the presence of coarse-mode aerosols. The correlation between the differences of Angstrom exponent,
 and AOD at 500 nm is studied in the two cities. In Cairo, there is an increase in the range of differences with increasing the turbidity and the differences become negative as atmospheric turbidity increases as a result of increasing fine mode particles ratio. In Qena, the differences are positive for almost all cases, indicating the presence of coarse mode particles. Finally, values of the second derivative
  at Cairo and Qena as a function of
  nm are discussed. In Cairo, Positive
  values occur in predominately fine mode bimodal size distributions with the value of
  increasing as the fine mode increasingly dominates over the coarse and as the fine mode particles increase in size. While in Qena, coarse mode dominated desert dust cases typically show
  values near zero or slightly negative. Although Cairo and Qena differ in Aerosol properties due to the difference in air pollution levels and sources in each city, the two cities are affected by the desert aerosols during spring months and biomass burning during autumn months.
ACKNOWLEDGEMENTS
- The authors would like to thank and acknowledge the two PIs, Emilio Cuevas-Agullo, and Ashraf Zakey, for their effort in establishing and maintaining the Cairo_EMA_2 AERONET site, and the two PIs Ashraf_Zakey, _and_Mohamed_Hussein_Korany for their effort in establishing and maintaining the Qena_SVU AERONET site.