-
Paper Information
- Paper Submission
-
Journal Information
- About This Journal
- Editorial Board
- Current Issue
- Archive
- Author Guidelines
- Contact Us
Resources and Environment
p-ISSN: 2163-2618 e-ISSN: 2163-2634
2022; 12(2): 59-65
doi:10.5923/j.re.20221202.03
Received: Jun. 24, 2022; Accepted: Jul. 4, 2022; Published: Jul. 15, 2022

Assessment of Seasonal Variations in Water Quality of River Tordzie, Ghana
 Abstract
 Reference
 Full-Text PDF
 Full-text HTML
Victus Bobonkey Samlafo 1, Kwasi Gameli Tordzro 2, Bright Ankudze 1, Alhassan Mahama 1
1Deparment of Chemistry Education, University of Education, Winneba, Ghana
2St Augustine’s College, Cape Coast
Correspondence to: Victus Bobonkey Samlafo , Deparment of Chemistry Education, University of Education, Winneba, Ghana.
| Email: |  |
Copyright © 2022 The Author(s). Published by Scientific & Academic Publishing.
This work is licensed under the Creative Commons Attribution International License (CC BY).
http://creativecommons.org/licenses/by/4.0/

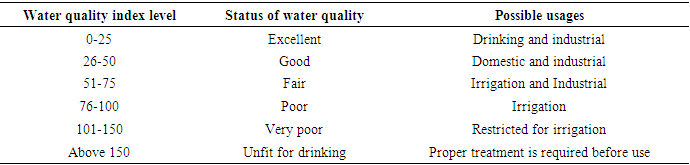
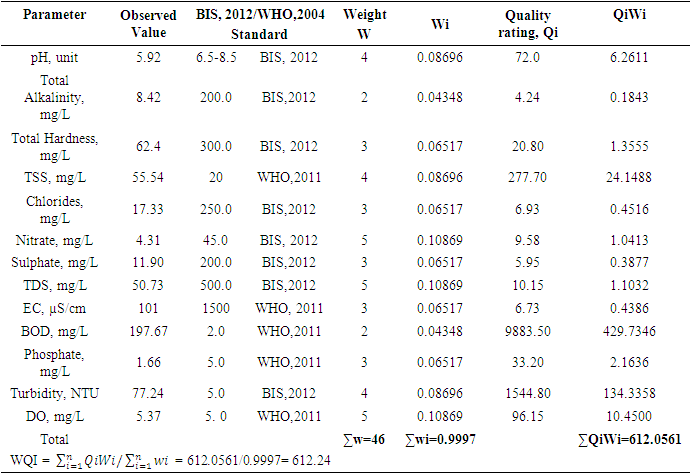
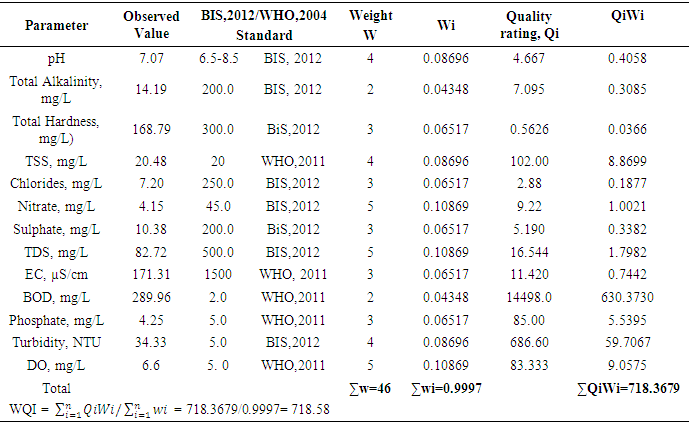
River Tordzie is one of the least studied rivers for its water quality and, hence was analysed for seasonal variations in water quality using nineteen physicochemical and metal ion parameters. Water samples were collected from seven stations in triplicates along the banks of the river during the wet and the dry seasons. The water quality index (WQI) was used to estimate water quality, while the student's t-test (two-tailed) assuming equal variance was used to establish any statistically significant difference between the water quality for the dry and wet seasons. Among the physicochemical and metal ions parameters analysed, except for three parameters (SO42-, NO3- and COD) representing 15.79% which did not show statistically significant differences between the wet and dry seasons, statistically significant differences were observed among the rest of the 16 parameters representing 84.21%. Eight parameters (Alkalinity, Total hardness (TH), pH, PO43-, TDS, EC, BOD, and DO) showed the highest peak during the dry season representing 42%, while, the other parameters (colour, turbidity, SO42-, nitrate, COD, TSS, Cl-, and NH4-H) and all the metal ions showed the highest peak during the wet season representing 68%. The evaluated water quality indices for the two seasons were 718.37 and 612.06 for the dry and wet seasons respectively, putting the water quality in the two seasons into the unfit for drinking water category. As such, proper chemical treatment should be given to the water from River Tordzie before those living along the banks of the river use it for their domestic activities.
Keywords: River Tordzie, Wet season, Dry season, Water quality index, Variation, Physicochemical parameters
Cite this paper: Victus Bobonkey Samlafo , Kwasi Gameli Tordzro , Bright Ankudze , Alhassan Mahama , Assessment of Seasonal Variations in Water Quality of River Tordzie, Ghana, Resources and Environment, Vol. 12 No. 2, 2022, pp. 59-65. doi: 10.5923/j.re.20221202.03.
Article Outline
1. Introduction
- Ghana is well endowed with water resources, but the amount of water available changes markedly from season to season as well as from year to year. The distribution within the country is far from uniform with the south-western part and coastal areas better watered than the northern regions. However, the availability of water is decreasing owing to rainfall variability (climate change), rapid population growth, increased environmental degradation, pollution of rivers, and draining of wetlands [1].Surface water quality considerations are becoming increasingly important due to mining activities, urban and industrial pollution problems, and agricultural development. Reliable data on water quality is of importance for proper management, protection, and development of surface water resources for the future. A further important ongoing concern requiring appropriate hydrological data is the current and future development of urban drainage in some of Ghana’s major cities, for which flood and storm runoff data is needed for proper planning and design [1].Water resource development in Ghana is intensifying with an increasing focus on the need to supply water to the urban and rural population, enhance food production, ensure environmental protection and increase hydropower production. However, the water resource base is under threat. Increased population associated with urban and industrial development and increased exploitation of land resources are putting pressure on the nation's water resources. This resulted in conflicting water demands, water pollution, and environmental degradation across the country [2].Degraded lands in the deforestation-prone zone of northern Ghana cause downstream flooding, reduced water quality, sedimentation in rivers, lakes, and siltation of reservoirs [3]. Another study indicated that part of the sediment removed from hillsides, embankments, and cuttings finds its way into rivers but part is deposited at the bottom of slopes and in flood plains where it remains in temporary storage, sometimes until the next storm [4]. There is a rapidly increasing demand for water for industrial use, especially in agriculture production, hydropower generation, mining activities, recreation, domestic and environmental enhancement. If these water demands continue to increase then water supplies will be overstretched. These problems would be more pronounced if population and urbanization continue to increase as well as the diversification of human activities. Irrigation of crops in the country is traditionally on a low scale due to the country's dependence on rainfed agriculture, therefore the sustenance of maximum river and stream flows would allow for the proper harnessing of the surface water resources. In southern Ghana, farmers are being encouraged to adopt the use of rivers and streams for dry season farming. This involves the clearing and use of river banks and other land areas close to these water systems and this normally employs the use of water lifting machines for crop irrigation [4].There are several ways to determine the quality of water considered fit for drinking, irrigation, and industrial uses. The water quality index (WQI), indicating the water quality in terms of an index value, offers a useful representation of the overall quality of water for the public or any intended use such as pollution abatement programmes and water management. In general, water quality indices incorporate data from multiple water quality parameters into a mathematical equation that rate the health of the waterbody with a number. It provides a comprehensive picture of the quality of surface/groundwater for most domestic uses [5].River Tordzie in the Volta Region of Ghana is one the poorly studied rivers in terms of its water quality, with little or no data on it, probably because of the lack of mining activities in the area. It covers a total distance of 85 Km and drains four districts. It is used for both domestic and agricultural activities (irrigation) by the inhabitants along the bank of the river. Although there are no obvious or reported health issues among the inhabitants, routine monitoring of rivers is an essential requirement for public health. This study, therefore, examined the seasonal variations in water quality of river Tordzie as it serves as a source of drinking water supply for residents along its banks.
2. Materials and Methods
2.1. Study Area
- River Tordzie has a transboundary basin. It covers an area of 1865 km2 in Ghana which constitutes 83.7% and the remaining area in Togo is 363 km2 which is 16.3%. It enters Ghana at Ziope and covers a total area of 2,228 km2. It drains four districts such as Agotime-Ziope, North and Central Tongu Districts, and enters the Avu lagoon at Xavi in the Akatsi South District of Ghana, a distance of 85 km [6].
2.2. Sampling
- Samples were taken in triplicates at seven sampling points from both downstream and upstream during the dry (January-March, 2021) and wet (May-June, 2021) seasons, four times during the period of the study. A total of 28 samples were taken during one sampling period into previously acid-washed polyethene two-litre containers without any pre-treatment except for dissolved oxygen and metal ions. At each sampling site, the water to be sampled was used to rinse the sample containers twice to avoid sample contamination [5] Samples for heavy metal ions analyses were collected in one litre-polyethene container and pre-treated with 1.0 mL of concentrated nitric acid per litre of sample to keep metal ions in solution and prevent precipitation.All samples were transported to the laboratory and stored at 4°C in the refrigerator and were analysed within a week.
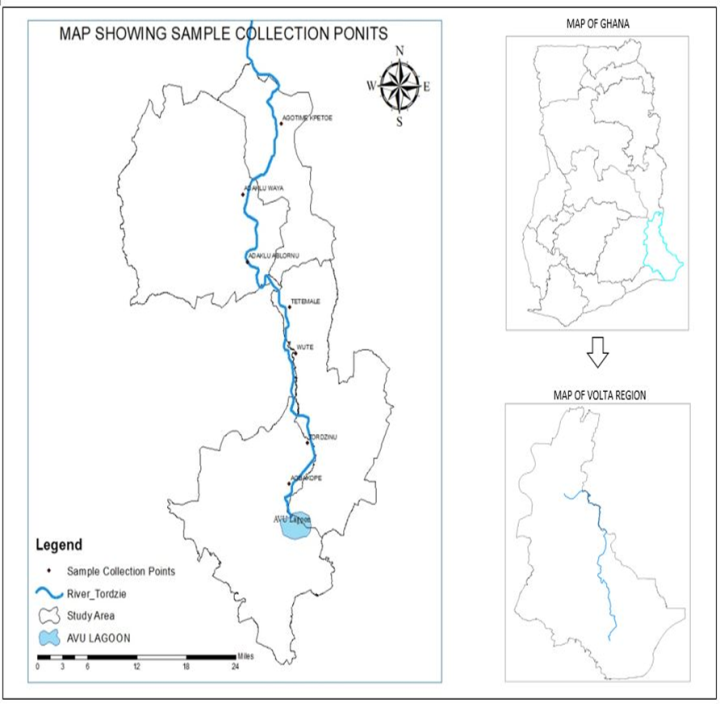 | Figure 1. Map showing the drainage basin of River Tordzie and the sampling points |
2.3. Physicochemical Analyses
- The pH, colour, electrical conductivity, dissolved oxygen, and turbidity of the water samples were determined in situ with their respective metres. The rest of the analyses were based on techniques drawn from APHA [7]. Total alkalinity was evaluated by the titrimetric method, while total hardness was computed by EDTA titration. Nitrate, sulphate, and phosphate were assessed by spectrophotometric techniques using HACH Spectrophotometer (DR 3900). Chlorides (Cl-) were determined by the argentometric method, while total suspended solids and total dissolved solids were measured by filtration and gravimetric method and dried at 105°C, while TDS was determined after evaporation. Dissolved oxygen was evaluated by Winkler's method (incubation for 5 days at 20°C) in BOD CUM Humidity Chamber. Chemical Oxygen demand was established by the potassium permanganate method using (HANNA HI83099), and ammonia was measured using the Nessler method under alkaline conditions [7].Samples for heavy metals (Fe, Cd, and Pb) were digested with 2.5.0 mL of concentrated HNO3, 5.0 mL of concentrated H2SO4 on a hot plate in triplicates of 100.0 mL aliquots of each water sample. As the volume of the digestion mixture reduced to about half, during the digestion process, additional 2.0 mL of concentrated HNO3 was added and digestion was allowed to continue until the mixture was light-coloured to depict the end of the digestion. The solution was then filtered using whatman No 1 filter paper into a 100.0 mL volumetric flask and made up to the mark with redistilled water. Respective standard solutions were prepared to determine the concentration of the metals in the digested samples alongside their prepared reagent blanks using Varian Fast Sequential Atomic Absorption Spectrophotometer (AAS) at the respective wavelengths of the metals [5,7]. Acetylene gas was used as the carrier gas in the determination, while argon was passed through the system to remove interfering gases between each reaction time [7].The water quality index (WQI) was estimated by the weighted arithmetic water quality index which was developed by Brown [9]. In evaluating the water quality, twelve parameters that were critical in water quality were used based on WHO, 2011 and BIS, 2012 standards (Indian standard for drinking water) as the standard to be met for drinking water.All parameters were assigned a definite weight (w) between 2-5, established on their relative perceived effects, importance, significance, and acceptability in water quality. The relative weights were estimated using equation (1)
 | (1) |
 | (2) |
 | (3) |
 | (4) |
2.4. Quality Control / Assurance
- The precision and reproducibility of the analytical methods used were checked by carrying out triplicate analyses, using analytical grade reagents obtained from Sigma-Aldrich. The triplicate results did not differ by more than 4% of the mean values. Recoveries achieved from the prepared standards used in the calibration curves were between 90% to 95%.
3. Results and Discussion
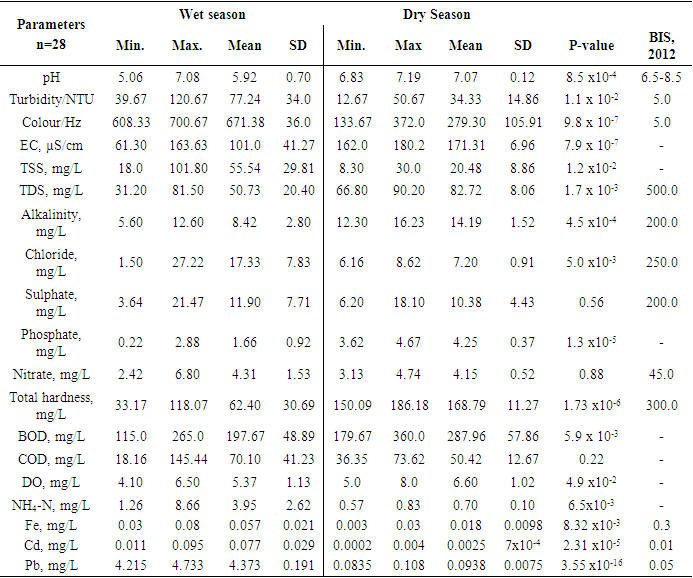
- Descriptive statistics were used to analysed the data obtained. Two-tailed Students t-test, assuming equal variance was used to determine statistically significant difference between the parameters of dry and wet seasons. The water quality index was used to summarise the whole water data for the two seasons. The results of the physicochemical parameters are shown in Table 1. The mean pH of the water during the dry season was 7.07 units and ranged from 6.83 units to7.19 units, with a standard deviation of 0.12, while the wet season had a mean pH level of 5.92 units and stretched from 5.06 units to 7.08 with a standard deviation of 0.7. There was a statistically significant difference (p = 8.5 x 10⁻⁴ < 0.05) in terms of pH between the wet and dry seasons, hence the rains might have contributed to the decrease in pH by dissolving acidic substances during the runoff into the river. A similar study reported a mean pH value of 7.5 units during the wet season and attributed the high pH to dilution of alkaline substances and dissolution of atmospheric CO2 [9]. The present study contradicted the earlier study and recorded a rather low pH during the wet season. A related study reported a minimum pH of 5.96 units and 5.08 units during the wet and dry seasons in Aby lagoon in the Western region of Ghana [10]. Turbidity varied from 12.67 NTU to 50.67 NTU with a mean of 34.33 NTU and a standard deviation of 14.86 during the dry season (Table 1), while the wet season had a range of turbidity from 39.67 NTU to 120.67 NTU with a mean of 77.24 NTU and a standard deviation of 34 (Table 1). All the mean values were above the BIS, 2012 standard value of 5.0 NTU [11], (Indian standard). There was a statistically significant difference (p = 0.011 < 0.05) in turbidity values between the dry and the wet seasons. The high turbidity levels could be due to the runoff from the catchment areas of the river creating much turbulence and suspended particles in the river during the wet season. An analogous study reported 3.65 NTU and 30.66 NTU respectively during both dry and wet seasons in Iraq [12] which is consistent with the current study during the wet season. Another study correlated with the present study and reported 6.21 NTU and 5.89 NTU turbidity during the wet and dry seasons in Volta Lake with higher peaks during the wet season [12].The present study recorded higher levels of colour in the wet season compared to the previous study [12]. Colour varied from 133.67 Hz to 372 Hz with a mean of 279.30 Hz and a standard deviation of 105.91 in the dry season, while the wet season flatulated in terms of colour from 608.33 Hz to 700.67 Hz with a mean of 671.38 Hz and a standard deviation of 36.0. All the levels for both dry and wet seasons were above the BIS, 2012 standard of 5.0 Hz. There was a statistically significant difference (p = 9.8 x 10⁻⁷< 0.05, Table 1) between the dry and wet seasons. The higher level of colour in the wet season could be due to soil runoffs and dissolved organic matter during runoff into the river during the wet season. Electrical conductivity (EC) fluctuated between 162.0 µS/cm to 180.2 µS/cm with a mean of 171.31 µS/cm and a standard deviation of 6.96 in the dry season, however, the wet season recorded 61.30 µS/cm to 163.63 µS/cm with a mean of 101.0 µS/cm and a standard deviation of 41.27. There was a statistically significant difference (p = 7.9 x10⁻⁷ < 0.05, Table 1) between the dry and wet seasons. The dry season recorded higher levels of electrical conductivity due to the concentration of the dissolved substances and the small volume of water during the dry season. A related study obtained a mean of 98.43 µS/cm and 96.08 µS/cm respectively during wet and dry seasons in Volta Lake [13]. The present study correlated with the earlier study by recording a higher EC during the wet season.Total suspended solids in the dry season ranged from 8.30 mg/L to 30.0 mg/L with a mean of 20.48 mg/L and a standard deviation of 8.86. In contrast, the total suspended solids in the wet season varied from 18.0 mg/L to 101.80 mg/L with a mean of 55.54 mg/L and a standard deviation of 29.81 (Table 1). There was a statistically significant difference (p = 0.012 < 0.05) between the dry and wet seasons. The higher levels of total suspended solids in the wet season could be due to suspended solids associated with the runoffs into the river during the wet season.Total dissolved solids in the dry season varied from 66.80 mg/L to 90.20 mg/L with a mean of 82.72 mg/L and a standard deviation of 8.06, whereas the total dissolved solids in the wet season extended from 31.20 mg/L to 81.50 mg/L with a mean of 50.73 mg/L and a standard deviation of 20.4 (Table 1). All these values fell within the acceptable level of 500.0 mg/L per BIS, 2012 standards. However, there was a statistically significant difference (p = 0.0017 < 0.05) between the two seasons with the dry season taking the lead in total dissolved solids.The higher level of total dissolved solids in the dry season could be due to the high evaporation rate leading to a small volume of water and a high concentration of the dissolved substances during the dry season compared to the wet season. A related study recorded 53.0 ±9.0 mg/L and 90.0 ±11.0 mg/L correspondingly in the dry and wet seasons with a p = 0.027 < 0.05 in the Tano river basin [15]. This study is consistent with the current study, recording a higher value in the wet season.Total alkalinity in the dry season fluctuated from 12.30 mg/L to 16.23 mg/L with a mean of 14.19 mg/L and a standard deviation of 1.52, but the wet season had a range from 5.60 mg/L to 12.60 mg/L with a mean of 8.42 mg/L and a standard deviation of 2.80 (Table 1). Mean levels of total alkalinity of both seasons fell within the permissible level of 200.0 mg/L as specified by BIS, 2012 standards. However, there was a statistically significant difference (p = 4.5 x 10⁻⁴ < 0.05) in total alkalinity between the two seasons. The higher levels of total alkalinity in the dry season could be due to an increased concentration of dissolved carbonates and bicarbonates due to the small volume of water.Chloride in the dry season ranged from 6.16 mg/L to 8.62 mg/L with a mean of 7.20 mg/L and a standard deviation of 0.91, while the wet season varied in chloride levels from 1.50 mg/L to 27.22 mg/L with a mean of 17.33 and a standard deviation of 7.83. Chlorides (p = 5.0 x 10⁻³ < 0.05, Table 1) showed a statistically significant difference between the two seasons with higher levels occurring in the wet season. The higher levels of chlorides in the wet season could be due to runoff from agricultural lands and domestic effluents into the river. Sulphate (p = 0.56 > 0.05), nitrate (p = 0.88 > 0.05) and COD (p = 0.22 > 0.05) showed no statistically significant difference between the dry and wet seasons. Sulphate levels ranged from 6.20 mg/L to 18.10 mg/L with a mean of 10.38 mg/L and a standard deviation of 4.43 in the dry season. In contrast, the sulphate levels in the wet season varied from 3.64 mg/L to 21.47 mg/L with a mean of 11.90 mg/L and a standard deviation of 7.71. Nitrate levels ranged from 3.13 mg/L to 4.74 mg/L with a mean of 4.15 mg/L and a standard deviation of 0.52 in the dry season, whereas the wet season ranged from 2.42 mg/L to 6.80 mg/L with a mean of 4.31mg/L and a standard deviation of 1.53. COD in the dry season fluctuated between 36.35 mg/L to 73.62 mg/L with a mean of 50.42 mg/L and a standard deviation of 12.67. The wet season recorded 18.16 mg/L to 145.44 mg/L with a mean of 70.10 mg/L and a standard deviation of 41.23. The rainy season did not influence these parameters.Phosphate levels in the dry season varied from 3.62 mg/L to 4.67 mg/L with a mean of 4.25 mg/L and a standard deviation of 0.37. Phosphates showed the same trend with total alkalinity with higher levels during the dry season. However, Phosphate in the wet season ranged from 0.22 mg/L to 2.88 mg/L with a mean of 1.66 mg/L and a standard deviation of 0.92. There was a statistically significant difference (p = 1.3 x 10⁻⁵ < 0.05, Table 1) between the two seasons. High phosphate levels could be due to the concentration of these substances during the dry season due to excessive evaporation leading to a small volume of water. Total hardness in the dry season ranged from 150.09 mg/L to 186.18 mg/L with a mean of 168.79 mg/L and a standard deviation of 11.27, whereas the wet season recorded 33.17 mg/L to 118.07 mg/L with a mean of 62.40 mg/L and a standard deviation of 30.69. There was a statistically significant difference (1.73 x 10⁻⁶ < 0.05, Table 1) between the dry and wet seasons. However, total hardness levels in the two seasons fell within the BIS, 2012 acceptable level of 300.0 mg/L. The higher levels of total hardness in the dry season could be due to increased evaporation leading to the concentration of substances and small volume of water during the dry season.There was a statistically significant difference (5.9 x 10⁻³ < 0.05, Table 1) in BOD levels between the two seasons with the higher levels occurring in the dry season due to a higher concentration of organic matter during the dry season. Biological oxygen demand (BOD) in the dry season ranged from 179.67 mg/L to 360.0 mg/L with a mean of 287.96 mg/L and a standard deviation of 57.86, while the wet season varied from 115.0 mg/L to 265.0 mg /L with a mean of 197.67 mg/L and a standard deviation of 48.89. An alternative study reported 26.7 ± 3.2 mg/L and 47.9 ±5.4 mg/L separately in dry and wet seasons with p=0.003<0.005 in the Tano river basin [15]. This study correlated well with the current study.Dissolved oxygen (DO) in the dry season varied from 5.0 mg/L to 8.0 mg/L, with a mean of 6.60 mg/L and a standard deviation of 1.02. The wet season recorded DO levels of 4.10 mg/L to 6.50 mg/L with a mean of 5.37 mg/L and a standard deviation of 1.13. There was a statistically significant difference (p = 4.9 x 10⁻² < 0.05, Table 1) in DO levels between the two seasons. Another study reported 6.35 ± 0.7 mg/L and 6.37 ±1.1 mg/L respectively in the dry and wet seasons with p = 0.956 > 0.05 in the Tano river basin [15]. There was no statistically significant difference between the two seasons in the Tano river basin. However, statistically, significant differences were observed in this study, due to the wet season.
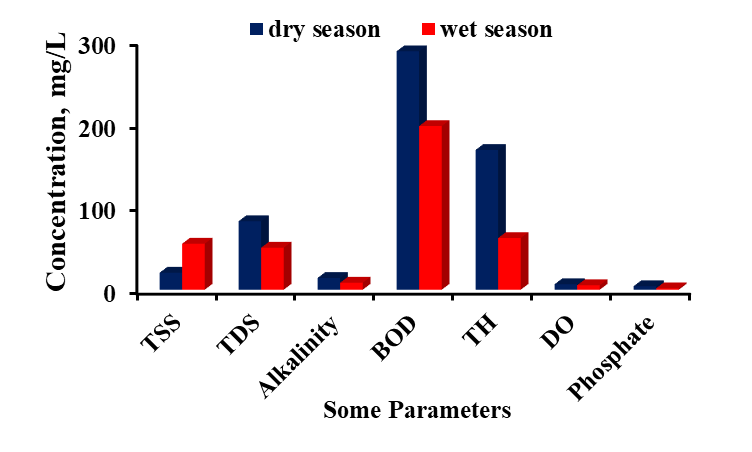 | Figure 2. Seasonal discrepancies in TSS, TSD, alkalinity, BOD, TH, DO, and phosphate levels for both dry and wet seasons of River Tordzie |
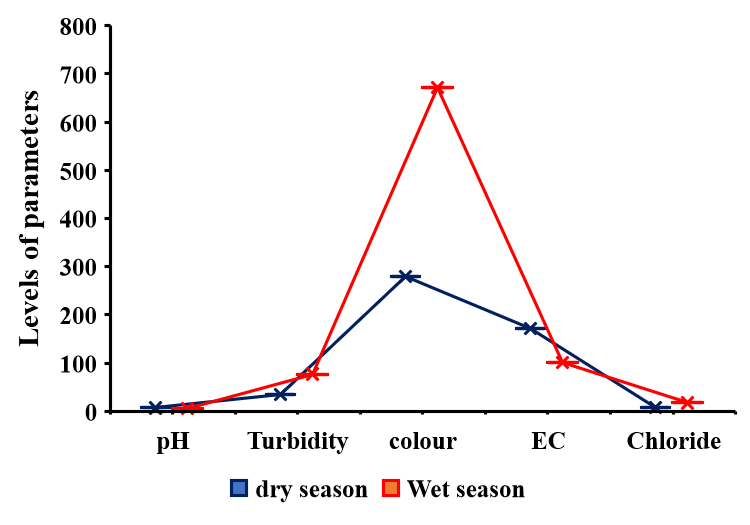 | Figure 3. Seasonal disparities in pH, turbidity, colour, EC, and chloride levels for both seasons of River Tordzie |
|
|
|
|
4. Conclusions
- In general, water quality in both seasons in most cases did not meet the acceptable standards. Using WQI as the basis for determining water quality, both seasons failed to meet the acceptable standard and fell within the unfit for drinking water category. Higher levels of pH, EC, TDS, total alkalinity, PO43-, BOD, total hardness, and dissolved oxygen were observed during the dry season for eight parameters, representing 42% while higher levels of Turbidity, colour, TSS, Chloride, nitrate, SO42-, COD and NH4-N, and metal ions were detected during the wet season representing 68%. Seasonal changes did not affect the levels SO42-, nitrate, and COD representing 15.79% of the parameters as there were no statistically significant differences observed for these parameters. It is suggested that the water should be given a chemical treatment to meet the acceptable standards before it is used for domestic purposes.
ACKNOWLEDGEMENTS
- The authors are grateful to Lord Bobobee, a Senior lecturer at the Chemistry Education Department for proofreading the manuscript and making critical suggestions.
Conflict of Interest
- The authors have no conflict of interest to declare.