E. C. Merem1, Y. Twumasi2, J. Wesley1, D. Olagbegi1, M. Crisler1, C. Romorno1, M. Alsarari1, P. Isokpehi1, A. Hines3, G. Hirse3, G. S. Ochai4, E. Nwagboso5, S. Fageir6, S. Leggett7, J. Offiah1, S. Emeakpor8
1Department of Urban and Regional Planning, Jackson State University, 101 Capitol Center, Jackson, MS, USA
2Department of Urban Forestry and Natural Resources, Southern University, Baton Rouge, LA, USA
3Department of Public Policy and Administration, Jackson State University, 101 Capitol Center, Jackson, MS, USA
4African Development Bank, AfDB, 101 BP 1387 Avenue Joseph Anoma, Abidjan, AB, Ivory Coast
5Department of Political Science, Jackson State University, 1400 John R. Lynch Street, Jackson, MS, USA
6Department of Criminal Justice and Sociology, Jackson State University, 1400 John R. Lynch Street, Jackson, MS, USA
7Department of Behavioral and Environmental Health, Jackson State University, 350 Woodrow Wilson, Jackson, MS, USA
8Department of Environmental Science, Jackson State University, 1400 John R. Lynch Street, Jackson, MS, USA
Correspondence to: E. C. Merem, Department of Urban and Regional Planning, Jackson State University, 101 Capitol Center, Jackson, MS, USA.
| Email: |  |
Copyright © 2022 The Author(s). Published by Scientific & Academic Publishing.
This work is licensed under the Creative Commons Attribution International License (CC BY).
http://creativecommons.org/licenses/by/4.0/

Abstract
The US Midwest region known for its vast network of arable farmland ranks high as the food basket of the nation and a global agricultural hub. The area stretches through a multiplicity of states and sub regions. With the intense level of farming and good soil therein, water access and security are overly crucial considering the region’s water dependent sectors from agriculture, industry, residential, energy, commercial establishments, and others with notable benefits to the communities. Notwithstanding all that, there exists a wide range of challenges to hydrological security deeply rooted in water management in the US Midwest region. The emergent worries center around declining water quality triggered by decaying infrastructure, pollution, the risks of flooding emanating from changing climate and access deprivation with spillovers to minority communities. Despite its vast network of lakes and reservoirs together with global and regional capacity as key water source, the zone faces vast concentration of usage in a few sectors. This comes in the wake of policies centered on continual access to key water assets germane to the communities and states in the region, mostly to agriculture, as well as industrial and manufacturing sectors. At the same time, very little in the literature exists on the analysis of water resource use issues in the zone via a mix scale approach anchored in Geographic Information System (GIS) and descriptive statistics. Accordingly, this enquiry will fill that void in research using mix scale methods to assess the trends. With emphasis on the issues, trends, factors, impacts, and the efforts of institutions. The results point to abundance of water assets in the zone and visible changes in usage over time in the form of gains and declines. In terms of the impacts, the region saw degradation, declines, and stress from climate change. In the process, a GIS mapping of the trends pinpointed a gradual dispersion of water use patterns of varying dimensions clustered in the region. Given that the forces of change reflect socio-economic, ecological, physical, and political factors located within the larger hydrological structure. The paper proffered solutions ranging from education, monitoring, sustainability, the design of a regional water information system and the enactment of sound policy.
Keywords:
Water resources, Midwest region, GIS, Change and Factors
Cite this paper: E. C. Merem, Y. Twumasi, J. Wesley, D. Olagbegi, M. Crisler, C. Romorno, M. Alsarari, P. Isokpehi, A. Hines, G. Hirse, G. S. Ochai, E. Nwagboso, S. Fageir, S. Leggett, J. Offiah, S. Emeakpor, Analyzing Water Resources Management Issues Along the US Midwest Region, Resources and Environment, Vol. 12 No. 2, 2022, pp. 25-46. doi: 10.5923/j.re.20221202.01.
1. Introduction
The United States (US) Midwest region known for its vast network of water sources and farmland, ranks high as the food basket of the nation and a global agricultural hub [1]. With the intense level of farming and good soil therein [2,3], water access and security are overly crucial considering the heavily dependent sectors from agriculture, industry, residential, energy to the others with benefits to society [4]. Being in the Great Lakes and the largest freshwater source in the globe [5], does not necessarily confer to the study area any form of immunity from much of the common water issues. Aside all that, the challenges to hydrological security rooted in water management in the US Midwest region exists. There are numerous worries pertaining to the growing water quality issues therein rooted in decaying infrastructure and sectorial pollution. All these concerns are being felt across different states in the zone coupled with the repeated exposures to a deprivation of the resource in underserved groups [6-9]. Accordingly, in the last several years, limited access to regular water uses and lack of affordability has significantly affected many African Americans and minority enclaves in big cities of the Mid-west region from Chicago to Detroit [10].At the same time, sectorial imbalance as manifested in the distribution patterns, remains obvious given the huge concentration of water usage in both the energy subsector of thermoelectric power and irrigation under agriculture at the expense of others [11]. This is occurring as the rising dangers from climate change induced floods accentuates recurrent liabilities through water contamination prompted by runoffs, other environmental externalities, and the widespread threat to water quality [12]. Given the flood risks posed to thousands of properties [13-15], and the fact that irrigation water usage in Illinois equals the same volume intended for 2 million people [16]. The Mid west region’s big scare in 2014 from a huge toxic algae bloom disaster in the state of Ohio was so damaging that it overstretched Toledo’s water sanitation system for over 48 hours [17]. To that effect, this not only necessitated the closure of fresh water supply access to about 500,000 citizens for safety purposes, but the authorities also initiated an emergency call up of the National Guard to ship in bottled water supply to meet the needs of the community trapped in the middle of the ensuing fallout from the disaster [18-20].Just as the other risks convulsing most places in the region [21], the gravity of the lead debacle and the inherent contamination of Flint, Michigan’s public water supply shows clearly that unimpeded accessibility to potable fresh water supply is no longer guaranteed across the country. This could erode community confidence regarding the suitability and safety of water consumption and extraction [22-25]. In comparison to the arid zones of the US, water management in the Great Lakes ecozone would not be deemed as persistent worry, given that the Great Lakes holds almost 30% of the globe’s surface freshwater deposits with a deep network of streams [26-30]. In these places, dark-green mists of toxic algae as a frequent issue, has completely devastated the ecology of Lake Erie over time. This is triggered partly by phosphorus contamination from the presence of numerous livestock feedlots located in the vicinities. Aside from the threats of hydrogen sulphide and the accompanying nasty odour irritations in most of the Upper Midwest states in the Great Lakes. Similar stenchy water appears quite common in the uppermost areas of Indiana, Ohio, and Lower Michigan. Along the big farm country with heavy fertilizer use, there was a time in Nebraska when over 100 different towns and villages experienced elevated contaminant levels of nitrates like in Wisconsin. Additionally, intense farming activities in the Midwestern Corn Belt region can inhibit both water quality and the natural habitats of little creeks [31-36]. Aside all that, of the states in the Mid-West region. Illinois alone stands high as the biggest water user in most measurable hydrological categories from energy to mining, relevant to the necessities of life in the zone [37-40]. At the same time, no studies have been conducted to assess the exposure of all the 10 Midwestern states to water issues using a mix scale approach. Seeing the policy and planning significance, regional analysis of water resources remains essential, given the role in the attainment of water security. Notwithstanding the ongoing initiatives to mitigate the challenges through a whole range of efforts in place among various groups in the Midwest region. There are concerns about the lousy posture and ineffectiveness of the private sector, even though it is a major beneficiary of current system of allocations [41-43]. Surely, very little in the literature exists on the analysis of water resources use status and changes in the zone via mix scale orientation anchored in Geographic Information System (GIS) and descriptive statistics [44-47]. From these lapses, this enquiry assesses the status of water resources in the US Midwest region within a mix-scale model. Accordingly, this study will fill the voids in research using mix scale methods of GIS and descriptive statistics to measure the trends [48-51]. With emphasis on the issues, trends, factors, impacts, and the efforts of institutions. Clearly, there is an abundance of water assets in the zone and visible changes in usage over time in the form of gains and declines. The paper has five objectives and sections. Out of the five sections in the paper, parts one to three cover the introduction, methods, and the results along with the factors, impacts, and initiatives. Sections four and five cover the discussions and conclusions. The primary two objectives consist of exploration of the issues in water resources management, and the analysis of the state and status of sectorial usage. The third and fourth aims, sets to assess changes in water indicators within the states and the factors fuelling variations in water transactions. The last and fifth objective is to design a decision support tool for managers.
2. Methods and Materials
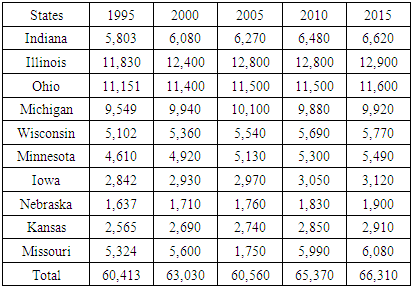
The study area contains the 11 states made up of Illinois, Indiana, Iowa, Kansas, Michigan, Minnesota, Missouri, Nebraska, Ohio, and Wisconsin in the farm belt zone of the US (Fig 1). While the area has a population of over 67 million and it is located along the Mid America side in the Great Lakes region. The zone stretches through 945,800.81 square miles area from Northern Missouri to Southern Ohio (Table 1) [52-55]. Being in the Great Lakes zone that holds one third (1/3) of the Globe’s surface freshwater assets essential to the provision of drinking water to over 42 million citizens. The water assets remain critical to wildlife ecosystem and the sustenance of regional economy of distribution, exchange, and consumption under different spheres of human activity. The region’s 4,530 miles of U.S. shoreline on the Great Lakes, as America’s inland coast and its longest, provides major life support for local tourism, recreation, and industry in a manner that continues to make them attractive destinations for many, given the liveable appeal [28,56-57]. Table 1. The Population of the Study Area 1995-2015
 |
| |
|
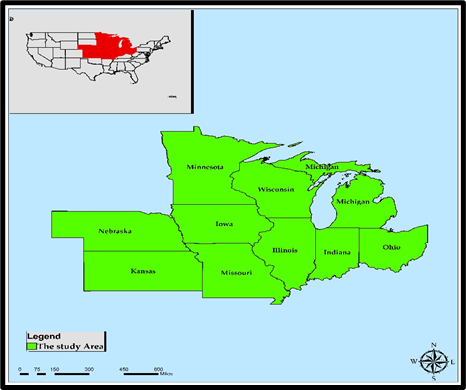 | Figure 1. The Study Area Midwest Region |
With the expansion of the Mid-western metro areas in the face of mounting urbanization and recurrent surge in farmland use. The use of water in the buoyant farm sector and the others in the economy, in the food basket of the nation merits attention. Unsurprisingly, the effects of recurrent stressors from development activities and the risks on freshwater resources and climate change has now accelerated the call for comprehensive water conservation to a much higher tone in a zone full of water. In as much as the study area gulped over a total of 400,000 Mlgd daily between 1995-2015. The volume of extracted water during the first three periods stood at over 80,000 Mlgd more than the other years [52]. Considering the pressures from population surge in the area, the demands from hydro power and irrigation at the average rates of over 65% to 16%. These shifts are resulting in record setting sectoral water transfers among the actors alongside the changing climatic parameters [58] and rising usage from 1995-2015 (Fig 2-Table 1). Despite its water abundance, the study area now has far greater exposures to the issue of water crisis than one could have imagined over the years [59]. Since the tragedy in Flint, Michigan uncovered the incapacity and gravity of institutionalized negligence towards maintenance and modernization of aging water and wastewater infrastructure. Thus, it is no longer a secret that in the Globe’s major water hub, where drought is also a concern. Many Wisconsin households face lead contamination problems as fertilizer use in the area has increased the speed of nutrient runoffs resulting in elevated levels of nitrates in drinking water. Regardless of the mixed profile, regional stakeholders have remained attuned to sustainable use of water through clean-up efforts, pollution prevention and objection to interregional piping of the resource to the water thirsty western region of the United States. Being an ecozone besieged by the rising demand, the declines in water tables and visible fluctuations along the Colorado River, Lake Meade, and climatic uncertainty therein, could eventually force people into water transfer ventures from the Midwest to the western region [60]. Seeing all that, surely, regional analysis of the trends in water use among the states in the study area, has major upsides that are very vital in the search for mitigation using the mix scale model [61-63].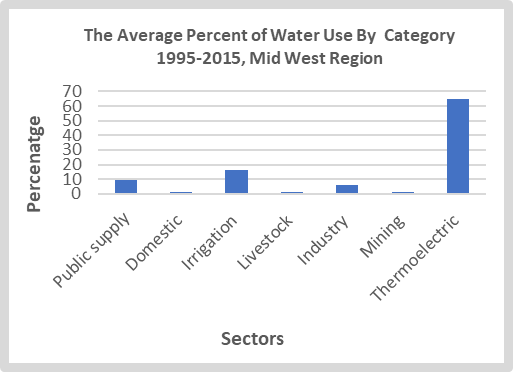 | Figure 2. The Percent of Water Use By Sector In the Midwest, 1995-2015 |
2.1. Methods Used
The paper uses a mix scale approach involving descriptive statistics and secondary data connected to GIS to analyse the rising incidence of water resources problems, the accessibility and hydrological security components of usage. The focus is on some selected states of the US Mid-Western region. They range from the Corn Belt zone of Nebraska -Kansas to the Michigan and Ohio axis in the industrial Midwest along the heartland. The spatial information for the study was obtained through numerous organizations consisting of the United States Geological Survey (USGS), the United States Department of Agriculture (USDA), The US Food and Drugs Administration (FDA), the United States Department of Interior, United States General Accounting Office (GAO), and the National Hydropower Association. Additional geospatial data came through the National Oceanic Atmospheric Administration (NOAA), Archives of the states in the Midwest and the Great Lakes. In addition to that, the US Census Bureau, the Midwest Online Interactive maps, and Acc Weather Inc, The World Health Organization, Nature Conservancy, Water rights group, Midwest Environmental Advocates, US Environmental Protection Agency, (EPA), the Hoosier Environmental Council, the Board of Commissioners of Lucas County, and the Ohio River Valley Water Sanitation Commission (ORSANCO), did also offer other information as required in the enquiry. Largely, much of the water use variables made up of domestic, public supplies, agricultural, thermoelectric and industry withdrawals pertinent to the zone collectively and the individual states emerged from the repositories of the Midwest authorities, the USGS Water sciences centers, and Earth Justice.On the one hand, the Delta Institute, the other entities at the USGS, Encyclopedia Britannica Inc, NASSA, the FDA, the Upper Midwest Environmental Sciences Center, The Great Lakes Climate Adaptation Network, and the Wisconsin Initiative on Climate Impacts, provided additional secondary data on the numbers, hydrological profile, quantities, trends, deficits in water budget and the categories as well as watershed sustainability matters. On the other, the Iowa Department of Natural Resources (DNR), the Federal Emergency Management Agency (FEMA), NAACP Legal Defense and Educational Fund Inc, and the Government Accountability Office (GAO) offered vital data to complement the time series data and other valuable information on hydrological assets on such indicators as surface and ground water budgets highlighting the region. For additional data needs, given that regional and state, county and federal geographic identifier codes of the states were used to geo-code the info contained in the data sets. This information was processed and analyzed with basic descriptive statistics, and GIS with attention paid to the temporal-spatial trends at the state and regional levels in the US Midwestern region and the Great Lakes eco zone. The relevant procedures consist of the two stages listed below.
2.2. Stage 1: Identification of Variables, Data Gathering and Study Design
The initial step in this research involved the identification of variables required to analyse the extent of consumption or extraction and variations at the state and regional levels from 1995 to 2015. The elements encompass socio-economic and environmental information including groundwater, surface water, total withdrawals, ground water percentage of total, surface water percentage of total, variations in water depletion level, drought index and changes in ground water level decline. The others consist of total ground water depletion, water withdrawals by category, public supply, domestic water, irrigation, livestock, industrial, mining, thermoelectric power, and the percentage of population dependent on ground water variations. Added to that are the daily use of ground water, population and percentage changes in state population, total water uses by category, and sources, percentage of change, ground water total, ground water average, total withdrawal of water by source and state, water withdrawal by category, self-supplied industrials, water declines volume and water volume increments. There were also water pollution patterns, pb in water, corrosive ground water, ground water depth, corrosivity index, drought, or water shortage index. These variables as mentioned earlier were derived from secondary sources made up of government documents, newsletters, and other documents from NGOs. This process was followed by the design of data matrices for socioeconomic and land use (environmental) variables covering the census periods from 1995, 2005 to 2010 to 2015. The design of spatial data for the GIS analysis required the delineation of county boundary lines within the study area as well. Since the authorized boundary lines amongst the ten states stayed unchanged, a common geographic identifier code was assigned to each of the area units for analytical coherency.
2.3. Stage 2: Step 2: Data Analysis and GIS Mapping
In the second stage, descriptive statistics and spatial analysis were employed to transform the original socioeconomic and ecological data into relative measures (percentages, ratios, and rates). This process generated the parameters for establishing, the extent of water consumption, withdrawals, depletion, the populations served, the categories served, the sources of water extracted, and the depletion of water types distributed precipitated by overuse and the trends across the Mid-western region for each of the ten states through measurements and comparisons overtime. While the spatial units of analysis consist of states, regions, shorelines, and counties and the boundary and locations where the over extraction of ground water thrived. This framework ensures the identification of change. As the graphics underscore the actual frequency and impacts, water depletion and the intensity of consumption and the trends coupled with the environmental and fiscal costs. The remaining steps involve spatial analysis and output (maps-tables-text) covering the study period, using Arc GIS 10.4 and SPSS 20.0. With spatial units of analysis covered in the ten states (Figure 1), the study area map indicates boundary limits of the units and their geographic locations. The outputs for each state were not only mapped and compared across time, but the geographic data for the units which covered boundaries, also includes ecological data of land cover files and paper and digital maps from 1995-2015.This process helped show the spatial evolution of location of various levels of usage, and the trends, the ensuing socio-economic and environmental impacts, ecological degradation as well as changes in other variables and factors driving the depletion of water and impacts in the study area.
3. The Results
This section of the paper focuses on temporal and spatial profile of water resource trends in the study area among various sectors and categories. There is an initial focus on the evaluation of water use between the states based on descriptive statistics, assessment of depletion and the regional changes in water usage. The other parts stress the impacts of usage in the various states and the zone. This is followed by GIS mappings and the factors linked to the water stress.
3.1. Water Resources Use in the Ten States 1995-2015
For a better alignment of the logic driving the order of temporal presentation of water resources use in the past two decades in the study area. This section follows a temporal portrait with some snapshots of potentials, abundance, and changes. Accordingly, the analysis of the hydrology of the zone falls under multiple time frames upon which water usage in different sectors and category occurred. Thus, the time series as manifested in the core indices involved 3 major points over time in the region. The era coincides with the distribution volumes and the underlying activities among the states through 1995-2000, 2005, and 2010 to 1995.
3.1.1. Water Use Activities 1995-2000 Cycle
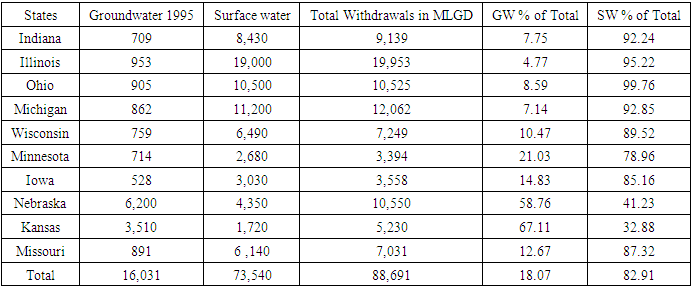
The assessment total water extraction by source shows a mix of ground and surface water levels with the former (GW) at 16,031 Mlgd far below the latter total of 73,540 MLGD at the regional level in 1995. In putting it into further perspective, what seems to emerge all through, in terms ground water distribution stems from the large presence of the resource and larger withdrawal proportions or quantities (6,200-3,510 MLGD). There is also the combined total of 9,710 MLGD for Nebraska and Kansas representing 60.57% of the regional supply for 1995. Even though the rest of the states used subterranean water measured mostly in the upper and mid hundreds of MLGD, still Illinois, Ohio, Missouri, and Michigan led the way by 953-905 MLGD to 891-862 while Wisconsin, Minnesota, Indiana all mined up ground water to the tune of 700 MLGD plus. Down in the supply chart, Iowa held firm with merely 528 MLGD below all her neighbors. The open or surface water type distribution provides a deep contrast with Illinois, Michigan, and Ohio amassing vast volumes (19,000, 10,500, 11,200 MLGD), at levels far ahead of the nearest states of Indiana, Wisconsin, and Missouri, with the extraction amounts at 8,430 MLG to 6,000 plus MLGD in 1995. In a slightly identical order, Nebraska, Iowa, Minnesota, and Kansas took out 4,350-3,030 to 2,680-1,720 MLGD from open water sources in the Midwest. One thing of great importance in the hydrological audit involves the ground water-surface water ratio of 18.07% to 82.91%. This truly affirms the region’s geographic roots in the great lakes zone as a surface water hub that is quite heavily dependent on the resource. The group of places in the first order or category where surface use percentage exceeds 92%, consists of four major industrial Midwest states of Indiana, Illinois, Ohio, and Michigan together with Wisconsin, Missouri, Iowa, and Minnesota in the 85 plus-78% plus category, as both Nebraska and Kansas stood below the rest as expected (Table 2).Table 2. Total Withdrawals by Source and State 1995, in MLGD
 |
| |
|
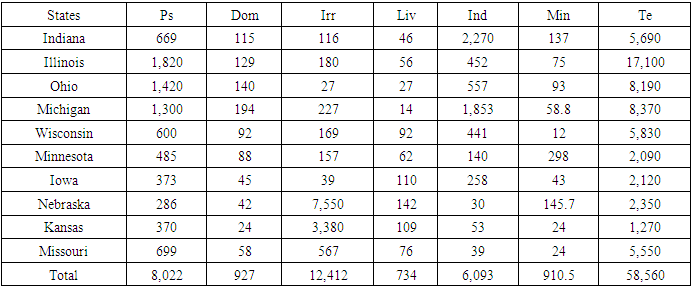
The total water withdrawals in the zone characterized by seven different categories in 1995 fall under public supply, domestic Irrigation, livestock industrial, mining, and thermo electric. For the purposes of analysis and better understanding of what transpired in the activities during the fiscal year. The 7 use categories can be further classified into community, and agriculture denoting the first four (Ps, Dom, irr, liv) and the last three (ind,min,te) tagged industrial. From the data, water destined towards built up community in the form of public supply, and domestic or residential areas were between 8,022–927 MLGD as irrigation and livestock activities in the agricultural sector used up about 12,412 to 734 MLG. The large industrial sectors represented by industry, mining and thermoelectric or hydro power, heavily dominant in the Midwest water use, accounted for 6,093, 910.5, to 58,560 MLGD. Taking a cue from a total of 87,659 MLG D in 1995, when aggregated further along the 3 categories already outlined, community use and agriculture represents only 10.02% -14.98% whereas industrial held about 74.78%. In that group, the thermoelectric sector at 66.80 alone showed its dominance at the expense of the others. All in all, water use in the Midwest region remains heavily concentrated in hydroelectricity power generation and agriculture with both irrigation and public supply as key users as well. At the state level, Illinois, Ohio, Michigan, and Indiana to some degree loom relatively larger ahead of the other states in the community indicators of public supply and residential use by 1,820, 1,420, 1,300 MLGD to 115, 129 to 140 -194 MLGD. In the farm sector, (irrigation and livestock) water withdrawal levels for Nebraska and Kansas at 7,550, 3,380 MLGD to 142-109 MLGD surpassed the others while Indiana and Michigan took the center stage in industry and mining water use at a ratio of 2,270-1,853 MLGD to 137-58.8 MLGD. With the state of Illinois ranked as the biggest thermoelectric water user in 1995 at 17,100 MLGD, the duo of other states, Ohio, and Michigan used over 8,000 MLGD in the same category, but closely followed by Indiana, Wisconsin, and Missouri fully in the mix with more than 5,000 MLGD. Of the remaining states, Minnesota, Iowa, Nebraska, and Kansas all combined for a total of 7,830 MLGD at an average of 1958 MLGD in hydro power water extraction in the fiscal year 1995 (Table 2.1).Table 2.1. Total Withdrawals by Water Use Category 1995 in MLGD
 |
| |
|
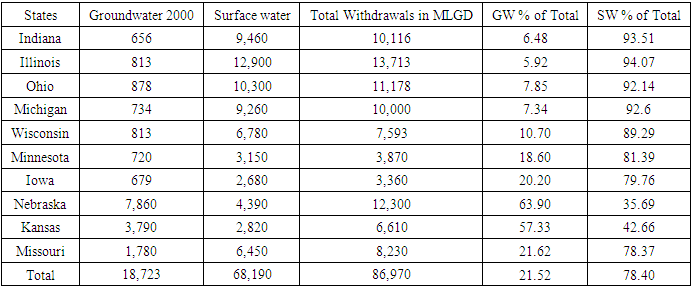
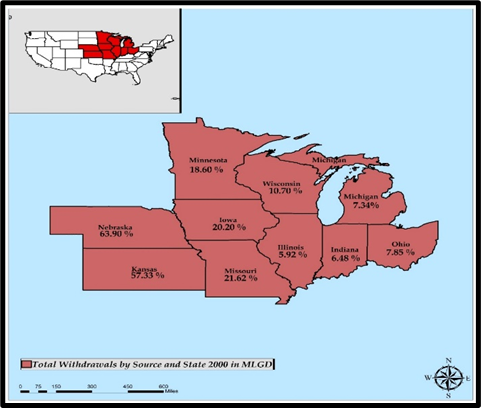
Just as in the previous period, the quantity of total water withdrawal involving dual natural sources from ground to surface in which (GW) volumes estimate of 18,723 Mlgd seemed lower than the surface water composition of 68,190 MLGD for the study area in 2000. In the individual states, where the patterns of ground water delivery stayed unchanged with Nebraska, Kansas, and Missouri at 7,860, 3,790 and 1,780. They all combined for 13,430 MLGD and 71.72% in the fiscal year 2000. Considering that the second cadre of states; Illinois, Wisconsin, Ohio, and Michigan and each withdrew 813, 878-734 MLGD, the other three (Indiana, Minnesota, and Iowa) in the zone who took out valuable portions (656- 720, 679 MLGD) mostly in the hundreds of MLGD were also actively involved in ground water transference. With surface water distribution rankings slightly changed, both Illinois and Ohio at 12,900-10,300 MLGD still retained their top spots despite the emergence of Indiana at number three of the regional ranking. From such a leap in the hydrological rankings for the Hoosier state amounting to 9,460 MLGD, Michigan dropped to the number 4th spot below Indiana with the share at about 9,260 MLGD.In the last group of states both Wisconsin and Missouri used over 6,000 MLGD in surface water, whereas Nebraska, Minnesota, Kansas, and Iowa posted appreciable levels (4,390, 3,150, 2,820, 2,680 MLGD) relative to the underlying activities and needs in their respective places in the study area. Interestingly so, again the ground water-surface water proportions in the zone stood at 21.52% to 78.40% making the study area a key surface water region despite Nebraska and Kansas heavy dependence on ground water at the rates of 63.90%-57.33% of water. The cluster of areas where surface water types were over 93%, 80% to 78% extends far deeper into eight areas in the heartland states from Indiana to Missouri while Nebraska and Kansas lags most of their neighbors. (Table 3). Table 3. Total Withdrawals by Source and State, 2000, in MLGD
 |
| |
|
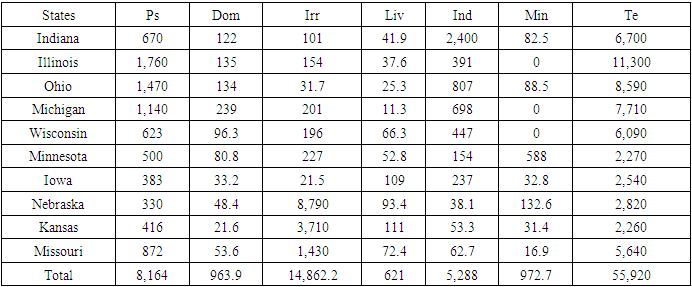
The total water withdrawals in the region as exemplified in 2000 reflects multiplicity of categories based on public supply, domestic, Irrigation, livestock industrial, mining, and thermo electric. Thus, the actual overall water uses by categories with delivery to human environment through community destinations such as municipal or public supply and residential localities stood at 8,164-963.9 MLGD. The farm sector represented by irrigation and animal husbandry operations set aside 14,862.2-621 MLGD while on the heavy machinery side, water usage intended for industrial segments of the economy through industry or manufacturing, mining and thermoelectric guzzled around 621, 5,288 and 972.7 MLGD of water. Of the region’s total of 86,792 MLGD in water consumption under the various categories. The distribution breakdown reveals, both public and domestic supply represents just only 9.40-1.11%, whereas irrigation and livestock held the other 17.12- 0.71% of the water use stock. Of these, the industrial group (industrial, mining, thermo electric) combined for percentage total of 71.3% with the thermoelectric sector level measured at 64.42%. In as much as this is slightly down from the previous 5 years, hydroelectric power remained the largest water consumer in the study area in 2000 with farming and community water use on the 2nd and 3rd pole of the ranking. Among the states, Illinois, Ohio, and Michigan averaged 1457-169.3 MLGD higher than their neighbors in public supply and residential water use as Nebraska, Kansas, and Missouri with 8,790, 3,710, to 1,430 MLGD and 92.3 MLGD average, correspondingly dominated the farm sub sectors of irrigation and livestock. Under industry water use, Indiana not only showed a commanding usage towering above its neighbors by 2,400 MLGD in the fiscal year 2000, the states of Minnesota and Nebraska still held the top spots in mining water use with 588-132.6 MLGD ahead of the others. Aside from Illinois’s rank as the number one thermo electric water user at 11,300 MLGD in the zone, both Ohio, and Michigan held on to 8,590-7,710 MLGD for hydro. However, Indiana, Wisconsin and Missouri averaged 6,143 MLGD of water for the purposes of hydro power generation activities. In a similar vein, a group of four other states (Minnesota, Iowa, Nebraska, Kansas) posted a combined average of 2,473 MLGD for the same purpose in the thermo electric sector in the areas in 2000 (Table 3.1).Table 3.1. Total Withdrawals by Water Use Category, 2000 in MLGD
 |
| |
|
3.1.2. Water Use Activities 2005 Cycle
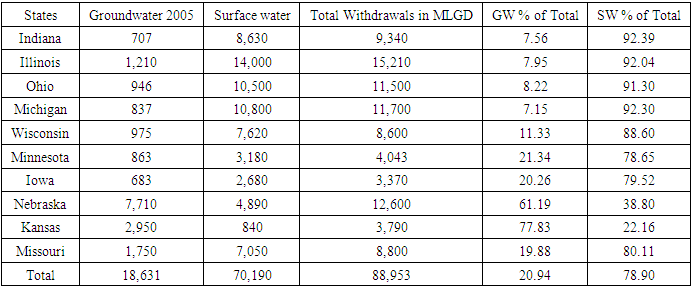
Looking at the temporal display of total water withdrawal by sources, the study area’s hydrological transactions show ground and surface volumes of 18,631-70,190 MLGD in the 2005 fiscal year. With the new entrant in the upper strata of ground water delivery at the state level, in 2005, Nebraska, Kansas and Missouri and Illinois stood out by extracting about 7,710, - 2,950, 1,750, to 1,210 MLGD. In the 2nd tier of states on the listing, Ohio, Michigan, Wisconsin, and Minnesota extracted 946-837 MLGD to 975–863 MLGD of subterrain water at levels above the allocations (707- 683 MLGD) for Indiana and Iowa during the same period. Under the surface water usage deposits, the trio of perennial leading states Illinois, Ohio, and Michigan consumed tens of thousands of MLGD worth 14,000 to 10,800. The second clique of areas notably Indiana, Wisconsin and Missouri busily raked in the much-needed supplies to the tune of 8,630, 7,620-7,050 MLGD at an average of 7,767 MLGD. The 4 lower end states on the ranking order (Minnesota, Iowa, Nebraska, and Kansas) still held their own with surface water shares of 3,180, 2,680, 4,890-840 MLGD.Under that setting, the study area accumulated a ground water and surface water ratio of 20.94 to 78.90 with Nebraska and Kansas reliance on ground water at the scale of 61.19-77.83% much higher than the rest of their neighbors. Even at that, note that surface percentage distribution among the leading states remained mostly at plus 91, and 80 -78% range which in turn buttresses the region’s abundance in surface water sources in lakes and rivers (Table 4).Table 4. Total Withdrawals by Source and State, 2005 in MLGD
 |
| |
|
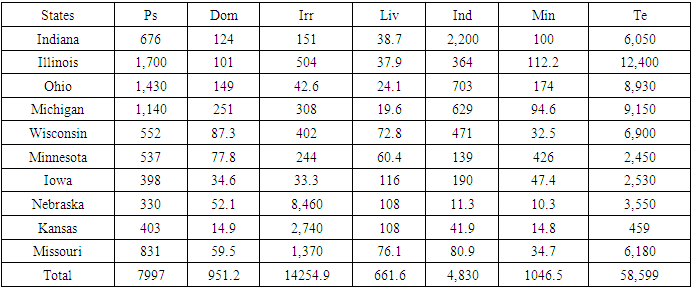
The profile of complete water withdrawals across the Midwest zone in 2005 census period shows municipal or public supply and residential users and the agricultural operators via irrigation and livestock gulped at least 7997-951.2 MLGD to 14254.9 -661.6 MLGD. This is followed by heavy concentration of vast stock of water in the order of 4,830, 1,046.5 to 58,599 MLGD tailored to meet the growing needs of the largely mechanized sector of tech and energy segments of the regional economy under the aegis of industry, mining, and thermoelectric power. Based on an aggregate water value of 88340.2 MLGD for all sectors, public and domestic and agricultural industry users made up of irrigation and livestock covers just only 9.05- 1.07% to 16.13-0.74% at combined rates of 10.12% -16.87% respectively. This represents barely 26.99% compared to the heavy industry’s 72.97% overall use rate in water transactions in which thermoelectric share at 66.33% dwarfed the values for both industry and mining, given their minuscule tallies of 5.46 -1.18%. Considering that at the state level as usual, the states of Illinois, Ohio, Michigan, and Indiana posted combined tallies of 4,946-625 MLGD at averages of 1,236.5 -156.5 in community and residential water use categories. The big-time farm states of Nebraska, Kansas, and Missouri left no one doubt of their sectorial dominance based on the highest allotted totals and averages of 12,570-292.1 MLGD water volumes towards irrigation and livestock. Furthermore, despite Indiana’s large industrial water allocations at 2,200 MLGD, a quartet of states represented by Illinois, Ohio, Michigan, and Wisconsin still showed signs of activities in the sector based on their combined water allocation of 2,167 MLGD and an average of 541.75 MLGD. With similar patterns in mining, Illinois still held the prime rank as the largest thermo electric water user estimated at 12,400 MLGD followed by Michigan and Ohio where hydro power water allocation stood at 9,150- 8,930 MLGD. Among the next group of areas in the ranking, Wisconsin, Missouri, and Indiana allocated about 19,130 MLGD at an average of 6,377 MLGD compared to the totals and average values of 8,989 MLGD-2,247 MLGD for the states of Minnesota, Iowa, Nebraska, and Kansas in 2005 (Table 4.1).Table 4.1. Total Withdrawals by Water Use Category, 2005 in MLGD
 |
| |
|
3.1.3. Water Use Activities 2010-2015 Cycle
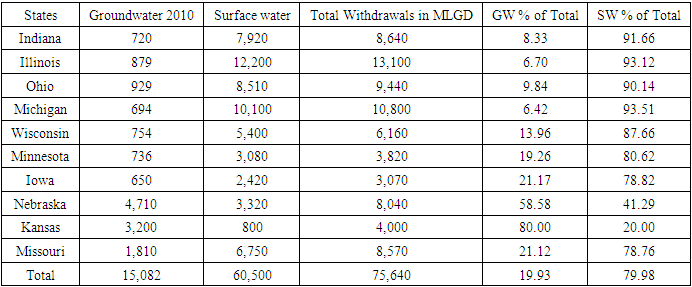
From the profile of water use via dual sources, the Midwest region’s hydrological audit, point to ground and surface water ratio of 15,082-60,500 MLGD in 2010. Within the states, the levels in the intensity of ground water usage in the big farm states of Nebraska, Kansas, and Missouri at 4,710, 3,200, to 1,810 MLGD surpassed every other states. With subterrain water extraction levels in the medium group (of Indiana, Illinois, and Ohio) in the upper hundreds of 720, 879-929 MLGs during the 2010 census. The neighboring states of Wisconsin and Minnesota withdrew appreciable portions worth 754-736 MLGD, while Michigan and Iowa extraction levels stood at 694- 650 MLGD at the same time. In the context of surface water extraction levels, the big three users made up of the states of Illinois, Ohio, and Michigan continued from where they left off previously with large volumes of water measured at 12,200, 8,510-10,100 MLGD. Elsewhere, since Indiana, Missouri and Wisconsin consolidated their spots as the 3rd force in the regional hydrological profile order, through the allocation of 5,400, 7,920, 6,750-7,920 MLGD during the 2010 fiscal year. The states of Nebraska, Minnesota, Iowa, and Kansas showed their continuity in usage at notable levels with the transference of 3,080, 3,320, 2,420-800 MLGDs towards various sectorial needs in the states germane to the areas. In line with the previous censuses, the Mid West zone still sits on a vast asset where ground water and surface water proportion or interface stands at 19.93-79.98%. In the zone, the subterrain hydrology and dependence for Nebraska and Kansas as the highest regionwide, amounts to 58.58-80.00%. Additionally, the surface water percentage levels among the states indicates much of abundance therein. This is once again a testament to the unique nature of the Mid-west as a zone bustling with abundant open water systems (Table 5).Table 5. Total Withdrawals by Source and State 2010, in MLGD
 |
| |
|
The synopsis of total water withdrawals throughout the study area during 2010 shows notable activities involving 7,557-902.9 MLGD destined to the built environment for municipal or public supply and domestic households. This is in conjunction with 11,343.4-1,042.1 MLGD set aside for the farm sector under irrigation and livestock and the larger portions (4,217, 744.79, 49,277) at the disposal of other categories represented by industries, mining, and hydro power. From the region’s 75,084 MLGD in overall sectoral water allocation, withdrawal proportions in both public supply and agricultural interests through irrigation and livestock operations vacillated between 10.06-1.20% to -15.10-1.38% in 2010 at an overall rate of 11.26%-16.48%. This seems largely below the combined percentage level of 72.2% in the heavy machinery and energy domain, but when broken along the individual sub sectorial lines, the water allocation rates for industries, mining and hydro power stood at 5.61%, 0.99 to 65.62%. Consistent with the preceding profile, is the primacy of Illinois, Ohio, Michigan, and Indiana with about 1,500, 1,370, 1,090 to 656 MLGD tied to public use along with a robust distribution of 126, - 92.4 MLGD to 137-231 MLGD in domestic water supply. In the same vein, Nebraska, Kansas, and Missouri held much of the hydrological assets in the region worth 5,660, 3,040-1,400 MLGD and 136,114, within the areas of irrigation and livestock in 2010, based on the agricultural water use segment. In a similar vein, Indiana emerged once more dominant with 2,210 MLGD and 52.40% of all withdrawals for industry in the zone. Even though Minnesota’s mining water allocations of 285 MLGD embody 38.26% of the regional total. The trio of Illinois, Ohio and Michigan once again showed their prominence through the allotment of 10,700, 7,220 to 8,520 MLGD for delivery towards thermoelectric power operations than other states. Yet, Indiana, Missouri and Wisconsin stayed in the mix with 5,910, 5,380, -4,630 MLGD ahead of Minnesota, Iowa, Nebraska, and Kansas where thermo electric power water use were in the order of 2000 plus MLGD to 377 MLGD in 2010 (Table 5.1).Table 5.1. Total Withdrawals by Water Use Category 2010, in MLGD
 |
| |
|
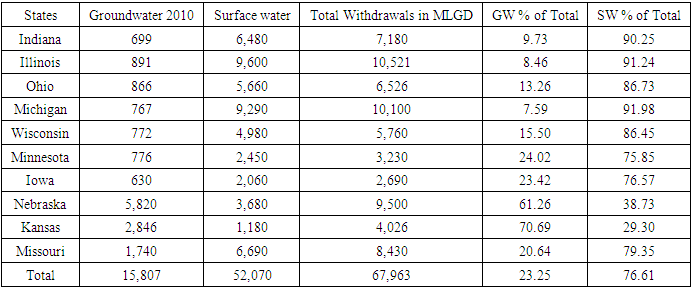
Looking at the pace of total water allocations by source in 2015 in the study area, the disparity in the region’s distribution patterns still holds by 15,807 to 52,070 MLGD with ground water quite below surface by a very large margin. Nevertheless, the momentum from the previous years among the three leading users of sub terrain water, indicates the big farm states of Nebraska, Kansas and Missouri still held firm. The trio of big farm states with 5,820, 2,846, 1,740 MLGD, accounted for 10,406 MLGD of all ground water use and 65.83% of the source, region wide far more ahead of their neighbors. Of the group of 7 in the 10 states from Indiana, Illinois, Ohio, Michigan, Wisconsin, Minnesota to Iowa, classified in the 2nd order of ground water users. These areas not only used up merely 5,401 MLGD at 34.16%, but they still showed limitations towards subterrain water access despite constituting 70% of the study area. Regarding surface water withdrawals, Illinois, and Michigan with over 9,000 MLGD emerged as the sole largest users, whereas Indiana, Missouri, Ohio, and Wisconsin in the medium group, held about 6,000 plus MLGD to 5,660 MLGD and 4,980 MLGD in surface water assets. The 4 remaining states (Minnesota, Iowa, Nebraska, and Kansas) ranked in the lower scale of surface water use still gulped a combined total of 9,370 MLGD in 2015 at an average of 2,343 MLGD. Essentially, the huge percentage difference between ground water and surface water remains, by a margin of 23.25-76.61% out of which Nebraska and Kansas surpassed the others by 61.26-70.69% in ground water usage while 8 of the 10, averaged about 85% in surface water access. Consequently, the forgoing analysis once again clearly attests to the reputation of the Midwest region as a major surface water frontier in the nation, hence the relative abundance therein over time from 1995-2015 (Table 6). Table 6. Total Withdrawals by Source and State, 2015 in MLGD
 |
| |
|
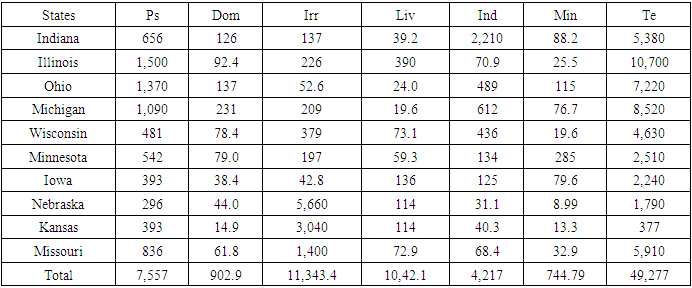
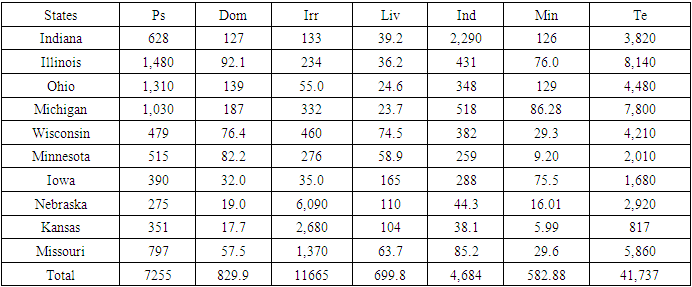
The overall water removals in the Mid-west in the 7 categories during 2015 by points to 7,255-829.9 MLGD for public supply and residential areas alongside additional portions in the transactions estimated at 11,665-699.8 MLGD set aside towards irrigation and livestock operations. This is somewhat different in terms of scale, considering the varying distribution levels of 4,684, 582.88 to 41,737MLGD as set aside for industries, mining, and hydro power. Out of the study area’s 67,453.58 total water draft by category in which public/domestic use, irrigation and livestock activities held between 10.75-1.23, to 17.29- 1.03% with combined values of 11.98 to -18.31%. The big demands from industry and energy to boost mining and hydropower at 69.67% overall translates into 6.94-0.86 to 61.87% along the individual sectorial categories during the 2015 fiscal year. Among the states, unsurprisingly the states of Illinois, Ohio, and Michigan remained at the upper rankings in public and domestic water transfers by notable levels of 1,480,1,310, 1,030 MLGD to 92.1-139 to 187 MLGD.As expected, the big farm corridors in the zone held firm as the indisputable leaders in the agricultural water use worth 6,090, 2,680, 1,370 MLGD to 110,104-63.7 MLGD in irrigation and livestock. Further along those lines, aside from Indiana’s recurrent notable water transfer for industry and mining at 2,290-126 MLGD ahead of the other states. In the case of the thermoelectric sector, Illinois, and Michigan emerged as the dominant users by 8,140-7,800 MLGD respectively. In the next or 2nd group of large waters users, Missouri, Ohio, Wisconsin, and Indiana transferred notable amounts to the tune of 5,860-4,480 MLGD to 4,210- 3,820 MLGD. The remaining last 4 states of Minnesota, Iowa, Nebraska, and Kansas, combined for just a total and average values of 7,427-1857 MLGD deemed far below their neighbors in both the upper and medium strata of the distribution (Table 6.1).Table 6.1. Total Withdrawals by Water Use Category, 2015 in MLGD
 |
| |
|
3.2. The Total Water Withdrawal From 1995-2015
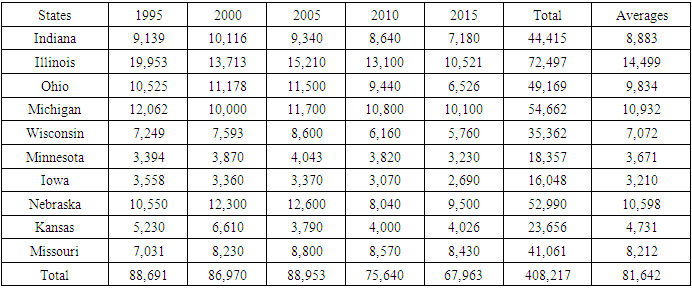
The pace of total water withdrawals in the study area shows the entire region extracted 408,217 MLGD at an average of 81,643 between 1995-2015. In the first three periods of 1995, 2000, 2015, water removals at mostly over 86,000 (88,691, 86,970, 88,953) Mlgd dropped further by 75,640 to 67,963 MLGD. In the individual states, among the big three, Illinois stands out as the biggest water user at a whopping level of 72,497MLGD coupled with, Michigan and Nebraska who used up over 52,000 MLGD (54,662-52,990 MLGD) of water in the entire periods. The other places where water extraction totals reached notable levels extends to a quartet of states led by Ohio, Indiana, Missouri, and Wisconsin at 49,169-44,415 MLGD to 41,061-35,362 MLGD. Also, water extraction for the various sectors at 23,656, 18,357 to 6,048 MLGD found ample use from Kansas, Minnesota to Iowa all through 1995-2015. The average distribution levels of 14,499, 10,932, to 10,598 MLGD among the three big states (Illinois Michigan, Nebraska) exemplifies the significance of the resource in the various economies in terms of farming, the automotive and thermo electricity sector. Ohio, Indiana, and Missouri with individual averages of 9,834 MLGD – 8,000 plus outpaced the levels for Wisconsin, Kansas, Minnesota, and Iowa at 7,072, 4,731 and 3,200 plus MLGD. The initial snapshots of the water usage further showed that as Illinois consumption levels in 1995, 2000 dropped consecutively from 19,953 MLGD to 13,713 MLGD, the trends continued during 2005-2015 by 15,210, 13,100-10,521 MLGD. In the upper Midwest zone, Michigan’s opening water stock of 12,062 MLGD fell to 10,000, but rebounded slightly by 11,700 MLGD, until it plunged from 10,800 MLGD to 10,100 MLGD in 2010 and 2015. Nebraska’s early surge of 10,550 MLGD to 12,300 MLGD in 1995-2000 MLGD, seemed overshadowed or short-lived by the drops from 12,600-8,040 in 2005-2010, even though the Cornhusker state held on to a surge of 9,500 MLGD in 2015. The other group at the center of high extraction in the zone includes Ohio, Indiana, and Missouri where usage stood at 10,525, 9,139 -7,031 MLGD in 1995 followed by somewhat identical volumes of 11,178 MLGD, 10,116, 8,230 MLGD in 2000. In the process, it came as surprise that in 2005-2010 to 2015, Ohio solely saw visible drops in water consumption estimated at 11,500 to 9,440 and further skid to 6,526 MLGD by 2015. In the case of Indiana and Nebraska, both states, high water ceilings of 9,340- 8,800 MLGD in 2005, seemed unmatched by the hydrological transactions of 8,640-7,180 MLGD to 8,570-8,430 MLGD in the subsequent years 2010-2015. Wisconsin on its part showed some flashes of activities with 7,249 MLGD, 7,593 MLGD to a high point of 8,600 MLGD before a gradual dip to 6,160 MLGD and 5,760 MLGD. The similarities in the volumes of water withdrawals in Minnesota and Iowa at over 3,000 MLGD in the first periods 1995-2000, left no one in doubt about the consistency in the usage during the later years of 2010-2015 among these big farm states (Table 7).Table 7. Total Water Withdrawals By State, 1995-2015 in MLGD
 |
| |
|
3.3. Percentage Changes Among the States 1995-2015
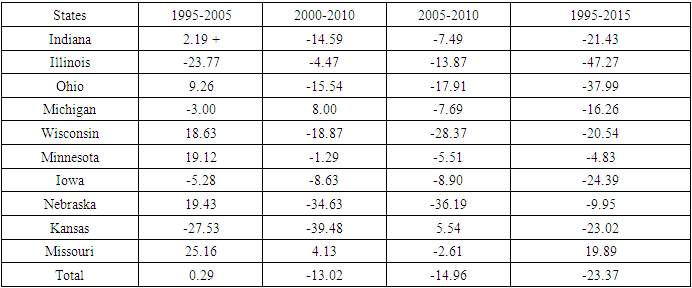
At the regional level, the total water extraction percentage changes in the study area points to notable declines aside from the 0.29% gains in 1995-2005 (Table 7). In the other intercensal years, the changes went from -13.02, -14.96 and -23.37% during 2000 to 2015. In looking at the patterns of changes in water use among the individual states. See that as two states like Illinois and Iowa posted across the board declines throughout the years. The major farm state in the zone, Missouri held on to visible gains in 3 of the 4 periods under analysis as 6 of 11 states solely showed gains in only 1 cycle. Detailed examination of the changes shows that in Illinois and Iowa, water volumes declined visibly (by -23.77 to -5.28%, -4.47 to-8.63 and -13.87%-8.90% to -47.27% and -24.39%) all through 1995-2015. For Missouri, the increments are evidenced by 25.16%-4.13% and 19.89%. In the other states, Indiana had an opening water account gain of 2.19% in 1995-2015, but with time, that meagre rise dropped by -14.59%, -7.49%, -21.43%. In the case of the upper Mid-West states of Ohio and Michigan with identical changes and attributes during those years. Both areas saw gains of 9.26-8.00% during different periods (1995-2005 and 2000-2010). Ohio experienced double dips of -15.54, -17.91, -37.99%, whereas Michigan managed -3. -7.69% to -16.26%. Wisconsin and Minnesota, both saw identical gains in the upper double digits level of 18.63-19.12%. Deep into the years, Wisconsin surpassed Minnesota by-18.87, -28.37, -20.54 to -1.29, -5.51, -4.83 correspondingly. In the Lower Midwest, despite the gains of 19.43% to 5.54% for Nebraska and Kansas during 1995-2005 through 2010, these states posted heavy declines with the former accounting for over 30% (34.63-36.19) to -9.95% (Table 7.1).Table 7.1. Total Extraction Percentage, 1995-2015 in MLGD
 |
| |
|
3.4. Impacts in the Midwest
From the surge in water use and distribution across sectors for the various activities in the 11 states of the study area. There are a mix of impacts as manifested with many downsides at diverse levels pertaining to the allocation, and risks coming from the trends and how it affects society and the environment in the Mid-west. This consists of exposures rooted in physical, socio-economic limitations in the zone.
3.4.1. Degradation Along the Great Lakes Area
In the region, it is obvious that Lake Erie’s algae issue which worsened in the last 2 decades constitutes serious risks to public health, water ecosystems, and tourism. Aside all these concerns, the intensity of green billows of toxic algae afflicting Lake Erie in current years due to phosphorous litters from intense cattle feeding, adds to the degradation. Another key issue in the Great Lakes Upper Midwest side, stems from the occasional rotten egg odor from hydrogen sulfide. Similar type of smelly water incidents occurs repeatedly in Northwest Indiana, Southeast Michigan, and Northwest Ohio. Additionally red staining from iron and bacteria issues are common in Wisconsin, Illinois, Michigan, Minnesota, Ohio, and Indiana. In the state of Wisconsin where they list problems including basic hardness and iron issues as well as different pH levels in the water among concerns. The people in Western Wisconsin often run into low pH conditions, a pH of 7 is neutral and anything below is considered acidic. In this region, pH as low as 5 is quite common and water with high acidity impedes plumbing. At the same time, the ground H2O aquifer levels in the Great Lakes states has been dropping due to mounting pressures from human activities and climate change. All in all, nitrates in Wisconsin’s ground H2O come from a trio of causes like farm nutrients, compost, and household wastewater. While at least 10% of wells statewide in the Badger state contain dangerous levels of nitrates. Places in the state with farming as the major land use, have higher proportions of polluted wells. In rural southwest Wisconsin, about 42% of private wells contain hazardous amounts of nitrates or bacteria and (Pb) lead. Almost 176,000 Wisconsin homes and firms get their H2O from obsolete lead service conduits. While the same dilemma applies also to many daycare amenities and schools. Unsurprisingly, under those circumstances, thousands of kids in Wisconsin carry high levels of lead in their bodies. In the same way, lead pollution afflicts families in several cities from Menasha, Milwaukee, Racine, Watertown/counties to Buffalo and Green Lake.
3.4.2. Social Impacts: Inequity and Flint Water Crisis
In terms of water crisis and inequality among minorities in Mid-West cities. In the case of Chicago, where a disabled Black lady pastor stands as victim and the symbol of a growing H2O crisis she kept as secret from others. It turns out that she was ashamed to reveal she lived without running water unknown to neighbors, kids, and her congregation. Just as many, she was unbale to pay her growing water costs which compelled her and the hundreds of thousands of others to stay without water. The lady’s nonpayment of the bill ended her access to H2O until the city of Chicago water department provided her a payment plan requiring a $1,700 deposit, she lacked. Surprisingly, this dilemma as critical as it is, occurred in a place with the largest freshwater deposits which no body anticipates in the nation. For years, as cities in the Midwest region from Chicago to Cleveland saw rising fees in water use. The bill for a single household of 4 in Chicago rose notably by 2007 through 2018. While Cleveland’s water rates rose yearly by $1,317 in a family of 4, those in Detroit paid $1,151yearly for the same service. Because those bills rose more in mostly underserved areas populated by poor families over time. Out of the 367,740 shut-off notices issued by state run water utilities in 6 metro areas in the last 10 years, African Americans and Latinos were targeted more in those exercises. In the process, unequal access, water insecurity, lack of affordability and disparity at the expense of minority communities continues to occur very alarmingly in large metro areas of the region. This can no longer go on this way again, within the largest fresh water ecozone in the globe and the richest economy as well. In the case of water crisis and emergencies, as the city of Flint crisis began, due to budget cuts at the expense of safe water access in a minority area. It was then reported that most citizens became exposed to lead contaminated water since April of 2014. This stems from a switch for water supply through the Detroit Water Department to the toxic Flint River. Later, when residents caught wind of it, they noticed the strange taste and colors, as signs of poor water quality. The alarming findings in the summer of 2015 surfaced when Dr. Attisha pulled blood data of kids tested at her hospital to see Pb levels. From there, the doctor found disturbing levels of lead levels capable of causing irreversible health damage in the children’s blood. The damages as uncovered include the loss of developmental skills and permanent brain damage in children. Because in such circumstances and in line with the existing protocols in place, the CDC under its guidelines usually declares lead poisoning at a blood lead level of 5 micrograms per deciliter. For that, once a blood-lead level reaches 45 micrograms per deciliter, then medical attention is required. With this Flint debacle not an exception, the scope of the tragedy and vulnerability of the victims and their dilemma unfolded much faster as the cases manifested. After the doctor noticed the number of children with elevated blood-lead levels of -5 micrograms per deciliter or more. The numbers moved further from 2.1% in the 20 months prior to 09-15, 2013 to 4% from Jan.1 and Sept 15, 2015. By January 2016, Rick Snyder, the Governor of Michigan declared a state of emergency for the city. From there, some 6.7% of homes tested in Flint, had dangerously high pb levels in their tap water. With time, when residents complained of hair loss and rashes. This development forced folks into using bottled water for eating, cooking, and bathing. For precautionary reasons, routine samples from some addresses were undertaken for lead and copper levels. The highest at 10,467 parts per billion, was found at a home on the 900 block of Barney Avenue. While there were some other 666 addresses with levels of more than 15 parts per billion of lead found in the water. This is not surprising, since many homes in Flint were built before 1978 with Pb paints, and as such major source of hazards. Against that background, the city of Flint began the gradual replacement of the city lead water pipes with copper pipes in March of 2016.
3.4.3. The Risks of Abundance, Depletion and Declines
Granted that the Great Lakes form the largest freshwater system on earth providing drinking water to 42 million people. Fishing therein alone supports a $7 billion economy, and the lakes sustains rich ecosystems of fish, birds, and other species. However, climate change footprints often evidenced through wetter conditions in the zone is bringing flood and coastal erosion, that are damaging to infrastructure and private property, while negatively impacting water quality and economic productivity. As devastating as these problems have been, they emanate predictably from increased precipitation, temperature, and a rising water table. However, these climate impacts have also marked the decline in available freshwater for communities that sit just outside the Great Lakes. This is occurring in the Lakes’ basin due to the rapid depletion and contamination of inland aquifers. In the process, ground H2O aquifer levels in the Great Lakes states are dropping due to mounting pressures from human activities and climate change. At the regional level, there exists widespread H2O declines in 1995-2015 in the study area at the rate of over 23%. Among the states, across the board drops in water extraction was evident, except for the 19.89% gain in Missouri. Also, huge sectorial imbalance is resulting in vast concentration of over 70% of water in both agricultural and energy industries, with the later classified as the biggest user.
3.5. GIS Mapping and Spatial Analysis
The mapping of various aspects of water issues in the US Midwest using GIS starts with a visual display of the structure of water volume and groundwater network information across the states in the region. Together with that, are the highlights of hydrological indices underscoring the ingredients of water usage and distribution across sectors in terms of total extraction by sources in the form of ground and surface water types. With that showcase, emerges the geospatial patterns of groundwater depletion and overdraft experienced over time and the concentration of water quality parameters in the face of regional exposures to extreme climate events associated with hydrological stress.Based on the portrayals of the indices in space, the water assets, and other indicators from depletion to climate parameters in the zone did take center stage. The info conveyed via geo-analytics on several scales and shades symbolize the activities, capacity, and liabilities of the region. The ability to pinpoint the spatial-temporal dimensions of water transfers, the use levels and capacity across the states, using GIS as the analytical tool, is very vital in showing the state of water and the capacities in the Mid-west in the face of mounting extraction over time. The GIS mappings of the trends indicates the dispersion of essential indices of water firmly rooted in certain points with more spread onto various portions of the Mid-West. Seeing the recent trends in the study area, the hydrological assets, withdrawals, source types, volumes, magnitude, climate, and ecological stressors appeared noticeably concentrated on those spots in the zone where abundance is feasible with flows to sectors operating within the corridors of a global water hub.On the geography of water use in the US Midwest, the spatial distribution of common dependence on groundwater category or source in the zone affirms the dominance in a duo of states (Nebraska and Kansas) in the Southwest. The proportions of groundwater water extraction among the two states in the lower corner of the map throughout much of the separate periods of 1995, 2000 to 2005, far exceeds the levels compared to the 9 other states from Minnesota, Iowa, Missouri, Wisconsin to Ohio (Figure 3). Over time, the ground water extraction levels went from 58.76%-67.11% to 63.90% -53.77% and 61.19%-77.83% between 1995-2005 in both Nebraska and Kansas along the Southwest part. Among the second tier of states located in the Northwest and those along the central lower south. See that Minnesota, Iowa and Missouri, and Wisconsin’s ground water dependency hovered at over 20% (21.03%), and 14 to 12% plus followed by a lower double-digit level of (10.47). At the same period, the levels in ground water dependency in the third-tier states (Michigan, Ohio, Illinois, Indiana) near the upper northern peninsula and lower south stayed at mostly single digits in 1995. For the second and third tire states, ground water dependency patterns during the next periods, of 2000-2005 appears relatively similar with meagre fluctuations in the actual percentages (Figures 3-5). The emergent spatial trends mostly in the negative columns or values of total water extraction expressed in percentages involves losses in the form of depletion from 1995-2015.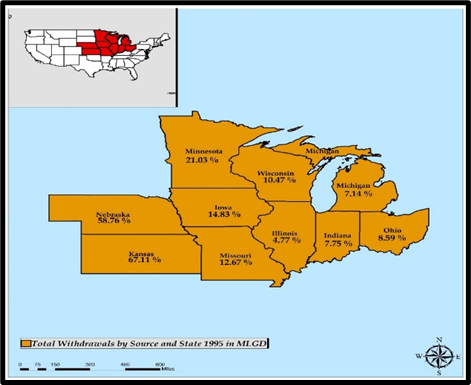 | Figure 3. Total Withdrawals By Source and State, 1995 |
 | Figure 4. Total Water Withdrawals By Source and State, 2000 |
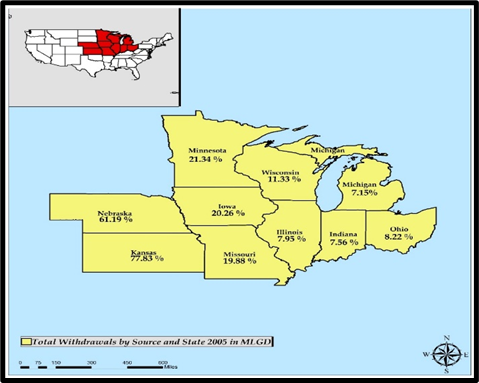 | Figure 5. Total Withdrawals By Source and State, 2005 |
The GIS mapping as a measure of how water was allotted over time and space reflects the coverage of states captured under a trio of major flash points in the Midwest region. These are where widespread usage culminated in visible defects relative to a whole set of parameters that influence extraction. The breakdown of the actual use patterns reveals the occurrence of large deficits in the southeast side of the zone with Illinois, Ohio and Indiana having more total water extraction deficits of -47.27% -37.99 to -21.43%. In the second group of spots on the map, comes a convergence of identical levels of over 20 percentage points in total water shortfalls. This phenomenon stretches from the southwest, central, and northwest with Kansas, Iowa and Wisconsin clearly shown to have individually water shortfalls estimated at -23.02%, -24.39% to -20.54% all through 1995-2015. The rest of the areas in the third category encompasses four states most notably Missouri, Michigan Nebraska, and Minnesota represented across different axis in the map where total water extraction deficits vacillated at various rates of -19.89%-16.26 to .9.95% -4.83% (Figure 6).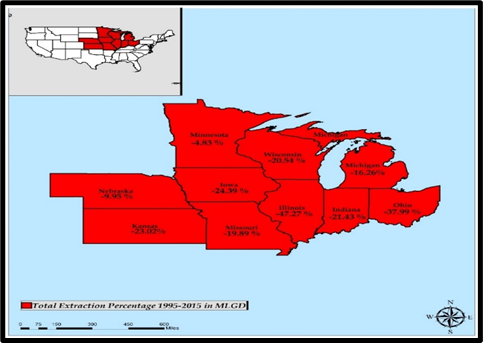 | Figure 6. Total Extraction 1995-2015 |
Considering that some of the states in the zone are not immune from the propensity to various patterns of water depletion. The incidence of ground water overdrafts of immense proportions in the Southwest axis of the study area occurred with more prominence in Nebraska, Kansas, and Missouri (Figures 7-8). This encompasses ground water overdrafts based on the points of occurrence over the years between 1908-2000 to 2001-2008 in the same southwest corn belt (Figure 9).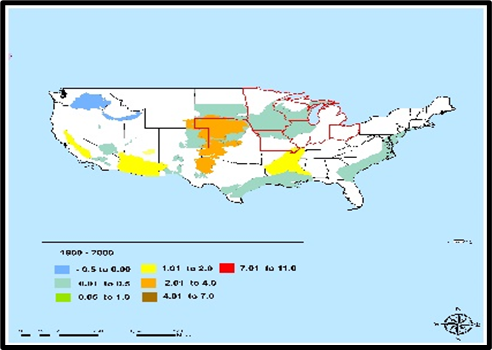 | Figure 7. Water Depletion Levels 1900-2000 |
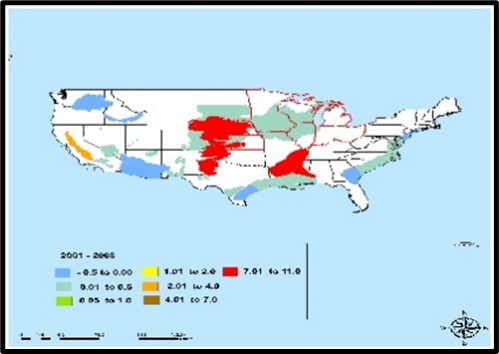 | Figure 8. Water Depletion Levels, 2001-2008 |
 | Figure 9. Cases of Water Over Draft |
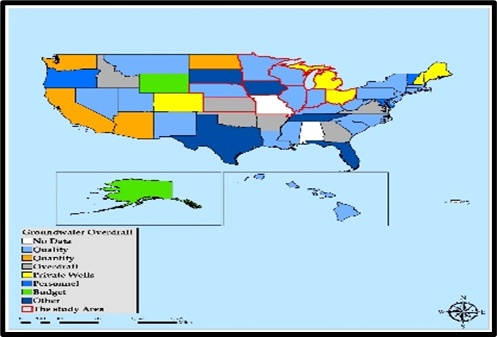
Being a zone with abundant fresh water along the ten states located in the Great Lakes ecozone, the vast web of aquifers is critical to water access and security. The map legend box provides insights into various group of aquifers germane to water use in the states of the Midwestern region under different colors spread across adjoining boundaries as identified therein. Of great importance considering the vast significance in agriculture, see that the aquifer types in yellow identified as unconsolidated sand and gravel aquifers (under the Northern great plains) extends from the corn belt zones of Nebraska and Kansas. The pathways continued, until it encloses into a mix of other rocks (beige) along the Missouri border with large areas under carbonate aquifers in blue. The same combination or mix of carbonate aquifers in blue and other rocks, in beige coupled with sandstone and carbonate aquifers in green, maintained a visible presence on the southern edge of the study area. The lower network stretches across Illinois, Ohio, and Indiana while in upper north appears mostly a mix of states Wisconsin and Michigan sitting under sandstone and other rocks’ aquifer formations or types. With these water systems made up of the Northern Great Plains, High Plains, the Northern Midwest and Central Midwest and Michigan Basin.The spatial analysis in other words does cover a cluster of spots highlighting the significance of Edwards-Trinity, and Midwestern Basins and Arches given their relevance to farming, households and others. Such geo visual display to some degree, affirms the concentration of key hydrological sources essential to water management, in the study area (Figure 10). In the context of pollution, aside from the moderate levels of corrosive ground water incidents spread across the region. The concentration of arsenic contamination of ground water remains highly visible in Nebraska and Kansas coupled with the light dispersal on different spots in the study area (Figures 11-12).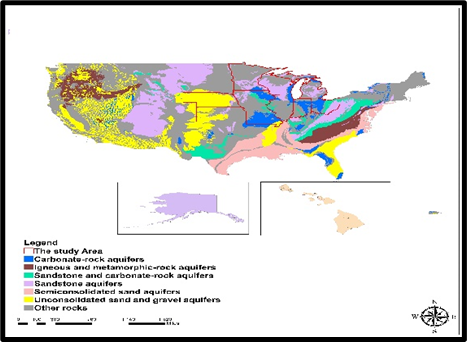 | Figure 10. The Spatial Distribution of Aquifers In the Midwest |
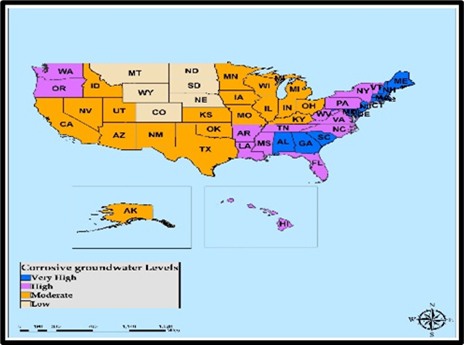 | Figure 11. Spatial Distribution of Groundwater Corrosion |
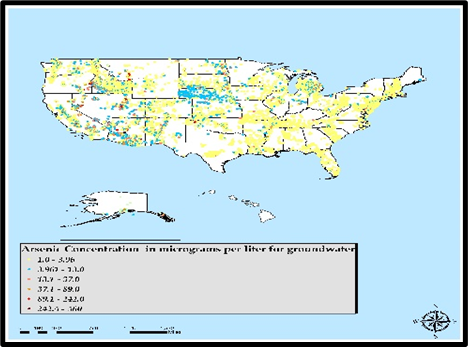 | Figure 12. Spatial Distribution of Arsenic Concentration |
Even though the study area boosts of abundant freshwater assets than other places in the globe, the four sets of maps under display, point to high propensity to droughts with the 2012 fiscal year, the most intense. Accordingly, there are also recurrent exposures to climate change forces with dispersion of drought at varying levels. The indices are calibrated and distinguished along many levels like abnormal, severe, moderate, extreme, and exceptional forms throughout the Midwest from 2012-2021 (Fig 13-Fig 16). Given that the huge dispersal of drought spell under varying scales were fully firm in 2012.The groundwater dependent areas of Nebraska, Kansas, Missouri, and Iowa bore much of the brunt with notable spill overs of exceptional, extreme, and severe types deep into Minnesota, Wisconsin, and Illinois. The dispersion of traces of the abnormally dry spots in yellow colors held firm in 2012 at a couple of places including up north in Michigan, upper and central Minnesota, upper and lower Wisconsin and portions of Ohio, upper and lower Indiana, and other areas as well. The clusters of moderate drought risks in beige appear heavily diffused across some of the states as well in 2012. Although extreme, exceptional, and severe drought spell faded visibly between July 2016 to August 2018, but in the southwest, pockets of areas were still under threats during the same periods. This is evidenced with other categories of drought risks sparsely diffused across space as some states saw just little or limited exposures. By August of 2021, similar geographic patterns in intensity like in the previous cycles in the evolution of drought spell in the study area remerged (Figures 13-16).  | Figure 13. Spatial Distribution of Drought Intensity, 2012 |
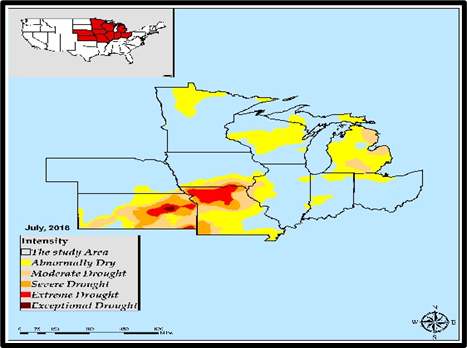 | Figure 14. Geographic Distribution of Drought Intensity, July 2018 |
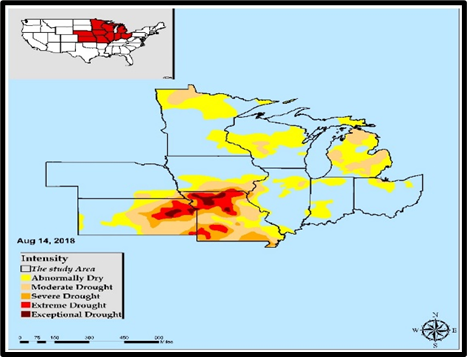 | Figure 15. Spatial Dispersal of Drought Intensity August, 2018 |
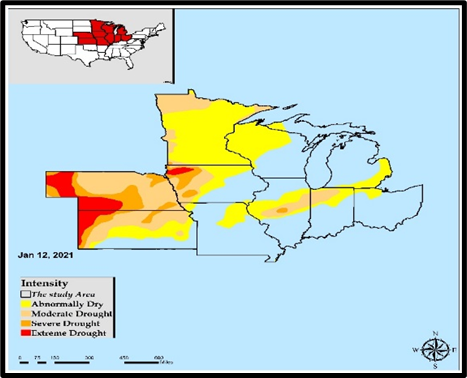 | Figure 16. Spatial Distribution of Drought Intensity, 2021 |
3.6. Factors Shaping Water Use in the Mid-West
The threats of water stress and depletion does not operate in a vacuum in the study area. It is predicated on a set of policy, socio-economic, demographic, and physical factors listed as follows. These elements are described below one after the other.
3.6.1. Socio-Economic, Policy, and Demography
In the absence enough capital, cities struggling to stay afloat would not have enough to invest in most basic water amenities for the populace. While the lack of funds to upgrade obsolete water infrastructure, contributes to Pb poisoning in cities. The exploitation of water distribution loopholes by the private sector remains unconscionable. In the process, the ad-hoc nature of policy making and planning in which actions emerge only in crisis, stifles the implementation of long-term mitigation measures given the roll back of programs under new regimes. Considering the crisis of public morality in place, one should not dismiss the double standards involved for some quarters. This is occurring in a setting punctuated with monopoly of water access for water thirsty businesses at reduced rates, as underserved communities continue to see huge water bills, disconnection notices and water insecurity in certain places. Under demography, the unprecedented expansions from population and urban growth across major metro areas and cities, are amounting to large demand for water assets and the attendant stressors contributing to deficits.
3.6.2. Physical Environment and Land Use
The vast role of changing climatic parameters is obvious in explaining the forces shaping water use in the study area. Undoubtedly, the visible damages wrought by such forces as drought, storms, flooding and heavy precipitation and resultant surpluses over time have been felt across much of the areas in the zone, when it comes to the limitations impeding usage. The same can be said of the extent of declines, depletion patterns and the way pollution of lakes shapes access to water and hydrological insecurity in the zone. Added to that are the degree to which land use authorizations sanctioned by state or city laws affect access to water. Since competing land uses known to affect water extraction and transfers cannot operate in the absence of zoning ordinances placing them in certain spots. Activities linked with intensive farming operations synonymous with the Midwestern corn belt region of the US, can alter both water quality, while fuelling fragmentation of natural habitats in small watersheds and lakes, where regular flow are essential to access.
3.6.3. Miscellaneous Factors in Mid-West Water Use
Essentially, in the US where governments have failed to fund essential maintenance and modernization of public water and wastewater systems. Municipal water providers understand the problems but are unbale to generate political support for spending millions or billions of dollars on water infrastructure. Because everyone takes water for granted, any move towards solution have seen the business sector resort to the role of a spectator. With the key actors being water dependent food and beverage industries in which many firms register with public suppliers and later, but rarely bother again on water matters. In this case, also, water thirsty firms and inefficient groundwater extraction by farms constitutes part of the major dangers to Midwest’s water access. Accordingly, the dangers of ground water pumpage to the region comes, in the amidst of current droughts in which planters throughout the Midwest drilled thousands of new high-capacity wells. The fact that since the 2012 drought, Illinois’ farmers installed almost 1,000 center-pivot systems, indicates that much of the threats to water in the zone especially the Great Lakes states are regional in nature. To that effect, recent controversies, including Nestle's bottled water venture in Michigan and a Foxconn move in Wisconsin to divert 7 MLGD from Lake Michigan to manufacture LCD screens are major concerns. This implies that the regional compact measures among the Great Lakes states do not offer total safeguard for the basin, hence the crisis in all these years.
3.7. Efforts and Initiatives
Considering the widespread use of water across sectors and the resultant depletions and the extent of physical stress under different forms over the years together with other challenges bordering in water security in the study area. Aside from the current ecological and economic benefits, inherent liabilities, the potentials of the zone as a global water and farm hub, did prompt a shift. Consequently, measures are being taken through several entities and other actors in the zone to strengthen water quality, quantity, and access in the Midwest region.
3.7.1. Stakeholder Initiatives in the Region
Aside from the efforts to conserve the lakes for the long-term health and vitality of the Midwest. The USGS remains in the forefront of projecting water use trends, with the administration of a nation-wide water census across states and sectors. The exercise at the regional and county levels highlights the state of water resources every five years with insights on aquifer depletions, surpluses and declines, sectorial comparisons, and warning signals if any. Compared with the other regions of the U.S. and the globe, governments throughout the Great Lakes basin have been focused on managing water within the basin. For that, the Midwestern communities are adopting novel ways to clean up old pollution, build resilient infrastructure, and create jobs in the green economy. In December 2008, the “Great Lakes Water Resources Compact” was enacted by a coalition including 6 Midwest states (Illinois, Indiana, Michigan, Minnesota, Ohio, Wisconsin) and two Canadian provinces (Ontario, Quebec). The intent focuses on specifically managing water quality, quantity, and habitats within the Great Lakes. The critical components of the compact, centers on the institution of clear restrictions on diverting Great Lakes water to communities outside of the basin.
4. Discussion
The study stressed the scope and pace of water use under the ambit of depletion, shortfalls, and sectoral dependence. Added to that are the concerns over water quality, accessibility, quantity, and disparate allocation. Another revelation touches on the links between water security, and socio-economic and physical factors, land use changes, rising usage, and contamination risks. From the results, the status of water use in the Midwest reflects abundance and depletion scenarios amidst the propensity to climatic volatility. Known for the enormous network of water assets, huge croplands, and the ranking as the food basket of the nation and a global farm hub in the Great Lakes; the largest freshwater source worldwide. The intense farming and excellent soil types, the hydrological access and security in the zone are essential. This stems from the heavy dependence on water by sectors from agriculture to energy and the others. Yet in all that, the Midwest region is not immune from most water challenges common in other places. Seeing the problems over water security, based on the management practices in the Great Lakes zone. The region faces recurrent concerns pertaining to poor water quality and pollution incidents arising from the deteriorating infrastructure, and sectoral activities. There is also limited access among ethnic minorities due to rising water tariffs and disconnection notices. This is compounded by the private sector’s inability to pay more, even though it benefits from the allotment structure amidst genuine objections to interregional transfer of water to the western region. To track the scope of water allocation trends in the face of sectoral disparity, the risks of contamination, deficits, limited access, conservation issues, inefficient use, and other elements. The paper used mix-scale tools of descriptive statistics and GIS with data involving socio-economic, ecological, and hydrological indices. This includes ground and surface water sources, daily use among the sectors and consumption. From the analysis, 8 out of 10 states in the zone, got their water mostly via surface sources, while only 2 others relied on subterrain water. This makes the zone a surface water dependent area. Regarding the state of water use, the region saw notable changes through gains and declines in some periods. But from 1995-2015, water extraction grew by over 0.29% followed by double digit declines in 3 periods. Expect for Missouri, water declines were recurrent among the states at the high double-digit levels by 1995-2015. Thus, contrary to general beliefs, most states in a wet zone, with 30% of the globe’s freshwater, still face water challenges. Looking at the extraction patterns amongst the different states between 1995-2015 and the ordinal ranking throughout the sectors regionwide. The state of Illinois stood out as the largest water consumer in total volumes of ground and surface water extracted. As the leading withdrawer of water, from 1995-2015, Illinois emerged as the biggest user of thermoelectric power water, far ahead of the other states. The water allocation trends within the much smaller areas in the zone, especially in the corn belt, showed the domination of Nebraska as the state with the largest ground water sources and sectorial allotment for irrigation between 1995-2015. The GIS analysis of the patterns presented the diffusion of hydrological stress and the exposures of water sources to pollution risks, the outbreak of extreme droughts, the relative levels of depletion and the composition of ground water use. Other aspects of the analysis showed the extent of water deficits and surpluses under the extraction categories. Given that the changing trends in water use, left in its wake many impacts that rattled the ecology. The paper shows that it does not operate in a vacuum due to a host of socio-economic and physical elements located in the larger hydrology and ecosystem of the region. This encompasses the rapid surge in population and urban development, climate change and ineffective policies and land use. To mitigate the problems, the paper proffered solutions ranging from education, monitoring, sustainable use of water, the design of a regional water info system and the promulgation of effective policy.
5. Conclusions
The study assessed the state of water resources use and the common challenges with findings highlighted under the ensuing headings: a) mix-scale technique efficient; b) changes caused by many factors; c) consumption on the rise; d) impacts of the crisis apparent.In emphasizing the issues in water use within the states in the Mid-west from 1995-2015, mix-scale approach showed various forms not utilized previously by planners. The uses of descriptive statistics in that mode, offered innovative capacity of the method to spot the extent of utilization under a mix of gains and declines together with the risks of water stress. Considering the precision at which GIS mappings detected the actual compositions, the web of aquifers critical to water security, patches of ground water dependence, diffusion of ground water depletion and variations in water withdrawal volumes. The capacity of the tools in stressing pollution risks and clusters of drought events at varying scales in some parts of the region carry huge upsides. The takeaway from the evolving patterns in water use in the zone enhances the ability of managers to adopt proper action plans when sudden flashpoints warrant immediate intervention. The major factors shaping water allocation in the Midwest region as indicated in the enquiry originate through a variety of socio-economic and ecological forces based on adhoc policy, demographic forces, rapid urbanization and changing climate. Under these factors, the reactive nature of policy making in which mitigations only occur in the event of major disasters undercuts the implementation of action plans given the practice of policy roll back. In the same vein, are the role played by subsidized land use involving cultivation of farm fields known for their risks to water quality through chemical runoffs and dairy effluents. While the misuse of generous water allocation by firms at lower prices seems hypocritical as underserved minorities bear the brunt of higher tariffs. The high propensity of the region to climate change risks via drought and debris from heavy rains threatens water access. In underlining these forces, the study injected new ways for risks monitoring in water use within wet ecozones. Essentially, in a zone where rapid urbanization drives growth amidst high water demands. The allotment of water to sustain various sectors is fuelling the rising consumption. Considering the pace of its occurrence. The largest consumers comprising of power and utility, irrigation and public supply took out sizable volumes of water from 1995-2015 estimated at millions of gallons daily. From what happened in the 2 decades, the study shows that the Midwest not only consumed about 408,217mlgd of water from 1995-2015. But water allotment remains critical in the zone. This occurred as allocation to the power sector reached 65% in yearly sectorial water use by 1995-2015. The design of such a comprehensive water index in the enquiry as an evaluation device, enhances the focus of planners to track sectoral use over time by ensuring an awareness of the growing shifts in patterns. This will enhance expedited actions among planners anytime water use, and the shortfalls surpasses the allowable limits. In accordance with the results, there exists impacts in water use in the Mid-west. This is indicated in the pattern of declines, socio-economic-policy issues and ambiguity that occurred both in the natural and built-up settings. Given the vast presence of water resources in the region, the extraction in the individual states continued unabated as sectors like farming in Illinois, the other states, together with the utility and power sector engaged in the heavy mining of water. While over pumping of ground water among farmers carry risks, the gravity of water pollution cases, the spread of nitrates and pb contamination accentuates it. The issue of water insecurity in minority enclaves in big cities in several states remain alarmingly serious. In that way, there were cases of water degradation in the Great Lakes region and declines in deposits. Also, the Flint water debacle left many citizens exposed to lead contamination in their water supply. Considering the utilization volumes in water sources in the past years, and the alarms raised by the shortfalls in this enquiry. Planners and researchers will be required to elicit answers to several queries essential to water security. The questions are as follows: How would future consumption levels shape water security? What are the regional implications of the special treatment of the private sector in water allotment amidst the negligence of minorities? How will climate change shape hydrological security? How will ongoing expansions in cities and the concentration of sectoral allocations in the thermoelectric industry influence access? How will the states in the region address the growing threats of water scarcity in the area? Based on these queries, ample possibilities exist for enquiry and practice to strengthen the focus on sustainable regional water use.
References
| [1] | Upper Midwest Environmental Sciences Center (2020). ThinkQuest: Education Foundation. Retrieved May 2020 From http://library.thinkquest.org/4552/newpage3.htmOracle. |
| [2] | Adam, Augustyn. (2020 March). Corn Belt Region, United States. Chicago, IL: Encyclopedia Britannica, Inc. |
| [3] | Todey, Dennis. (2017 October). Agriculture In the Midwest; The Midwest Climate Hub. Washington, DC: United State department of Agriculture, Climate Hubs. |
| [4] | Soley, Wayne. (1998). USGS Estimated Use of Water In The United States In 1995. US Geological Survey Circular 1200. Denver, Colorado: US Department of the Interior, USGS Information Services. p 1-74. |
| [5] | US EPA. (2015). Facts and Figures About The Great Lakes. Washington, DC: US EPA. Retrieved May 2020 From https://www.epa.gov/greatlakes/facts-and-figures-about-great-lakes. |
| [6] | Bloch, Sam. (2018). After Flint, Michigan Wants The Country’s Most Stringent Water Regulations. The Counter. |
| [7] | Zamudio, Maria. (2019 February). Investigations: A Water Crisis Is Growing In A Place You'd Least Expect It. Washington, DC: The NPR Radio. |
| [8] | Montag, Coty. (2019). Watercolor a Study of Race and The Water Affordability Crisis In America’s Cities. Washington, DC: NAACP Legal Defense and Educational Fund, Inc. |
| [9] | Block, Sam. (2019 March). Flooded Midwest Communities Face Contaminated Drinking Water. The Counter. |
| [10] | Miller, Elizabeth. (2019) Uproar In Detroit and Desperate Measures. Cleveland, Ohio: WCPN in Cleveland and APM Reports. |
| [11] | Barber, Nancy. (2014 November). Summary of Estimated Water Use In The United States in 2010.USGS Factsheet 2014-3019. Reston, Virginia: The USGS US Department of the Interior. 1-2. |
| [12] | Eskin, Jack. (2020 June). Water Conservation In The Midwest. Chicago, IL: Delta Institute. |
| [13] | UCSUSA. (2010 June). How Global Warming Impacts Water. Retrieved May 2020 From https://www.ucsusa.org/resources/water-and-climate-change reports & multimedia / explainer Water and Climate Change. |
| [14] | Environmental Law and Policy Center. (2022). Clean Water. Protecting the Great Lakes. Chicago, IL. The EPL. |
| [15] | Smith, Arthur. (2020 October). Trump EPA’s Water Rule Will Swamp Midwest Communities. Retrieved May 2020 From https://www.insidesources.com/trump-epas-water-rule-will-swamp-midwest-communities/. |
| [16] | Glennon, Robert. (2019 September). Great Lakes' Biggest Worries Much Closer to Home Than Arid Southwest. Chicago, IL: The Chicago Business Forum. |
| [17] | Nemes, Judith. (2018 March). Ohio EPA Declares Western Lake Erie Impaired. Environmental Law & Policy. Chicago, IL: The EPL Center. |
| [18] | Environmental Law and Policy Center (ELPC). (2022). Cleaning Up Lake Erie. Chicago, Environmental Law & Policy. Chicago, IL: The EPL Center. |
| [19] | Alliance For The Great Lakes. (2019 August). Five Years Later: Lessons From the Toledo Water Crisis. Chicago, IL: Alliance For The Great Lakes, |
| [20] | NEIWPCC. (2016 March). The Toledo Water Crisis. Three Days in August: “Do Not Drink the Water”. Boston, MA: NEIWPCC. |
| [21] | Crunden, E.A. (2019 April). A Quiet Drinking Water Crisis Is Going Unaddressed In Iowa. IA: Think Progress. Retrieved May 2020 From https://archive.thinkprogress.org/iowa-well-water-crisis-agriculture-92521c00516b/. |
| [22] | Merem, E. C. (2016 March). Assessing The Effectiveness of Environmental Policy Instruments in the Containment of Lead Exposure In African American Communities. Proceedings of The 81st Annual Conference of the Association of Social and Behavioral Scientists Inc. (ASB). Jackson: MS. |
| [23] | Brooks, Carolyn J. (2017 September). Racial/Ethnic and Socioeconomic Disparities in Hydration Status Among US Adults and the Role of Tap Water and Other Beverage Intake. Am J Public Health. 107: 9:1354. |
| [24] | Merem, E. C. (2015). The Growing Issue of Mercury Exposure in the African American Community. Proceedings of 23rd Joint Conference of National Association of African American Studies (NAAAS). Baton Rouge: LA. March 2015. |
| [25] | Balazs, CL. (2012). Environmental Justice Implications of Arsenic Contamination in California’s San Joaquin Valley: a Cross-Sectional, Cluster-Design Examining Exposure and Compliance In Community Drinking Water Systems. Environ Health. 11:84. |
| [26] | Matheny, Keith. (2017 April). Great Lakes Water Piped To Southwest 'Our Future,' Says NASA Scientist. Detroit Free Press. |
| [27] | USGS. (2019 March). Water Resources Agricultural Contaminants Flow Modification of the Nation's Streams. Reston, Virginia: The USGS US Department of the Interior. |
| [28] | Great Lakes Commission. (2022). About the Great Lakes. Ann Arbor, Michigan: Great Lakes Commission. |
| [29] | Michigan’s Great Lakes. (2022). Pure Michigan. Lansing, Michigan: Michigan Economic Development Cooperation. |
| [30] | Russ, Michael. (2022). Great Lakes Restoration. Washington, DC: The Government of the United States. |
| [31] | Water Right Group (2017 October). Common Regional Water Problems: The Central States (Midwest). Appleton, WI: Water Right Group. |
| [32] | Midwest Environmental Advocates (2020). Clean Water Issues. Madison, WI: MEA. |
| [33] | Goldberg, Max. (2012 May). Another Reason to Eat Organic: Lower Your Risk of Cancer By 25%. Retrieved May 2020 From https://livingmaxwell.com/water-supply-in-the-midwest-. |
| [34] | Environmental Protection Agency (EPA). (2016). Contaminated Sediment in The Great Lakes. Washington, DC: United States Environmental Protection Agency. |
| [35] | EPA. (2020 October). Toxic Contamination Past and Present: Creating a Legacy. Chicago, IL: Alliance for the Great Lakes. |
| [36] | Briscoe, Tony. (2019 Sept). 22 million Pounds of Plastics Enter The Great Lakes Each Year, Most of the Pollution Pours Into Lake Michigan. The Chicago Tribune. |
| [37] | UN (2010 July). General Assembly Resolution 64/292: The Human Right to Water and Sanitation. New York, NY: UN Information Department. |
| [38] | Dieter, C.A. (2018). Estimated Use of Water In The United States In 2015: U.S. Geological Survey Circular 1441. Reston, Virginia: The USGS, US Department of the Interior. p65. |
| [39] | Maupin, Molly. (2014). Estimated Use of Water In The United States in 2010. Circular 1405. Reston, Virginia: The USGS, US Department of the Interior. 1-52. |
| [40] | Hutson, Susan. (2004). Estimated Use of water in The United States in 2000. USGS Circular 1268. Denver, Colorado: The USGS, US Department of the Interior Information Services. 1-44. |
| [41] | Clark, Michael (2011 August). A Plan To Divert Mississippi Flood Waters To West Is Proposed. Retrieved May 2020 From http://www.earthtimes.org/business/plan-divert-mississippi-flood-waters-west-proposed/1206/. |
| [42] | US Government. (2018) The Midwest Climate Change. In Chapter 6 The U.S. Global Change Research Program. Washington, DC: US Government. |
| [43] | Merem, E.C. (2017). Analyzing Water Management Issues Using GIS: The Case of Nigeria. Geosciences. 7:1: 20. |
| [44] | Merem, E.C. (2021 April). Appraising Issues In Water Resources Use Among Nations In the West African Region. Proceedings of The 12th National Monitoring Virtual Conference. Providence: Rhode Island. April 19, 2021. |
| [45] | Merem, E. C. (2018 February). Assessing Water Resource Issues In The US Pacific North West Region. Proceedings of The 2018 Mississippi Political Science Conference (MPCC), Jackson: MS. February 2018. |
| [46] | Merem, E.C. (2021). Analyzing the Use of Genetic Modified Organisms (GMOs) In Agriculture In The US Midwest Region. Food and Public Health. 11:1: 1-17. |
| [47] | Merem, E.C. (2020). Analyzing Organic Food Farming Trends in The US Western Region. Public Health Research. 10:2: 41-57. |
| [48] | Merem, E.C. (2020 March). Assessing The Risks From Changing Climate In South Texas Region. Proceedings of The 94th Annual Meeting of The Louisiana Academy of Science (LASC). Louisiana State University. Alexandria: Louisiana. March 14, 2020. |
| [49] | Merem, E. C. (2021). The Regional Assessment of Groundnut Farmland Use in Northern Nigeria. International Journal of Food Science and Nutrition Engineering, 11:1:1-19. |
| [50] | Merem, E.C. (2020). Evaluating Geothermal Energy Potentials In The US Western Region With GIS. International Journal of Engineering. 10:2: 23-40. |
| [51] | Merem, E. C. (2020). Issues In Transboundary Water Use In The River Nile Basin Area of Africa. World Environment. 10:2: 27-44. |
| [52] | Merem, E. C. (2021 February). Assessing Water Resource Management Issues In The US Midwest Region. Proceedings of The Virtual Conference of Minority Public Administrators (COMPA). Dallas: TX. February 25-28, 2021. |
| [53] | Merem, E. C. (2020 February). Analyzing the Use of Genetic Modified Organisms GMOs in US Agriculture In the Midwest Region. Proceedings of The 2020 Mississippi Political Science Conference (MPCC), Jackson: Mississippi. February 2020. |
| [54] | Merem, E. C. (2016). The geography of wind energy use in the mid-west region of the U. S. Journal of Energy and Power. 6:1: 1-15. |
| [55] | United States Census Bureau (2020). US Census Quick Facts. DC: Washington. The United States Census Bureau. |
| [56] | Tonelli, Nicholas A. (2020 April). What Are Some Natural Resources In The Midwest? Retrieved May 2020 From https://www.reference.com/geography/natural-resources-midwest-4f3f66116b8026c9. |
| [57] | Day, Sharon (2009). The Midwest United States. Chicago, IL: Encyclopedia Britannica, Inc. |
| [58] | USDA (2017). The Midwestern states (Illinois, Indiana, Iowa, Michigan, Minnesota, Missouri, Ohio, and Wisconsin). Washington, DC: US Government. |
| [59] | Holly, Robert. (2014 June). Freshwater: Supply Concerns Continue and Uncertainties Complicate Planning. Washington, DC: Government Accountability Office (GAO) / Midwest Center for Investigative Reporting. |
| [60] | Merem, E. C. (2019). Assessing Water Resource Issues in the US Pacific Northwest Region. International Journal of Mining Engineering and Mineral Processing. 8:1:1-19. |
| [61] | Merem, E. C. (2016). The growing issue of mercury exposure and the threats in the African American community. Journal of Frontiers in Science, 1-15. |
| [62] | Merem, E. C. (2020). Assessing Water Resource Issues Among States in the US Southeast Region. Marine Science. 8:1: 1-23. |
| [63] | Merem, E. C. (2016). Assessing The Vulnerability of The Us Pacific Northwest Region To Tsunami Hazards. American Journal of Environmental Engineering. 6:1: 1-19. |

 Abstract
 Reference
 Full-Text PDF
 Full-text HTML