Lahatra Razafindramisa Fils1, Randrianiaina Jerry J. C. F.1, Lahatra Razafindramisa Harizo2, Rasolozaka Nirilanto Miaritiana2, Rakotonirina Rija I.1
1Laboratory of Matter and Radiation Physics (LPMR), University of Antananarivo, Madagascar
2Atmosphere, Climate and Oceans Dynamics Laboratory (DYACO), Faculty of Sciences, University of Antananarivo, Madagascar
Correspondence to: Randrianiaina Jerry J. C. F., Laboratory of Matter and Radiation Physics (LPMR), University of Antananarivo, Madagascar.
| Email: |  |
Copyright © 2021 The Author(s). Published by Scientific & Academic Publishing.
This work is licensed under the Creative Commons Attribution International License (CC BY).
http://creativecommons.org/licenses/by/4.0/

Abstract
Temperature is one of the key parameters to evaluate the water quality. This work aimed to present a methodology to determine the temperature of the Mantasoa Lake. The temperature of the Mantasoa Lake was estimated using images in the thermal infrared bands from Landsat8 after processing the atmospheric correction and calculating the brightness temperature. The results obtained demonstrated that the remote sensing technique provides an excellent relationship between the measured temperature values and the calculated ones. Moreover the correlation coefficient (R2), which was equal to 0.955, was strong, and the root mean square error (RMSE) was 0.981. The temperature distribution maps indicates that the Mantasoa Lake respects the Malagasy norms on May 27, 2020 and May 30, 2021 regarding temperature.
Keywords:
Remote sensing, Landsat8, Surface water, Temperature, Lake Mantasoa
Cite this paper: Lahatra Razafindramisa Fils, Randrianiaina Jerry J. C. F., Lahatra Razafindramisa Harizo, Rasolozaka Nirilanto Miaritiana, Rakotonirina Rija I., Assessing the Temperature of the Mantasoa Lake Using Landsat8 Thermal Infrared Data, Resources and Environment, Vol. 11 No. 2, 2021, pp. 35-39. doi: 10.5923/j.re.20211102.01.
1. Introduction
Lakes are a vital component of Earth’s fresh water resources, and are of fundamental importance for terrestrial life (Stuart MacCallum, 2012). The monitoring and assessing of the quality of lake water are very important for managing and improving its quality. The field observations, the collection of water samples and analyses in laboratory are currently methods to evaluate water quality. However, these methods are very expensive, time consuming and do not give either the spatial or temporal view of water quality needed for an accurate assessment of water bodies. Remote sensing techniques provide spatial and temporal views of surface water quality parameters that are not available from the field measurements (Jerry C. et al, 2003) and they help sometimes to solve some problem linked to in-situ measurements (access, means). Water quality of a Lake is determined by physicochemical parameters such as turbidity, pH, salinity, dissolved oxygen etc. Temperature is a physical parameter that has an influence on the functioning of fresh water ecosystems (Najwa Sharaf et al., 2019). The purpose of this work was to use thermal infrared remote sensing to monitor the spatial distribution of the temperature of the Mantasoa Lake. Lake Mantasoa is a tourist site and also known has the Africa’s first caviar farm. Water temperature plays an important role in sturgeon culture. In this study, data images from the Landsat8 satellite were used. These images can be freely downloaded from the USGS (United State Geological survey) website. Landsat8 carries two sensors: OLI (Operational Land Imager) with nine spectral bands and TIRS (Thermal Infrared Sensor) with two spectral bands. The temperature of Lake Mantasoa was calculated using TIRS data images after calculating the emissivity and brightness temperature. To validate the formula of the lake surface temperature based on thermal infrared data, in-situ measurements were performed.
2. Study Area and Data Used
2.1. Study Area
The Mantasoa Lake is located in the Analamanga region, Manjakandriana district, rural commune of Mantasoa, about 56 km east of Antananarivo as the crow flies. Geographically located between 19°1’ latitude South and 47°52’ longitude East (Figure 1), it is an artificial lake created in 1936 to regulate the Ikopa river, to irrigate the rice-growing plain of Betsimitatatra and to supply the hydroelectric station of Mandraka (Randrianiaina Jerry J.C.F., 2021).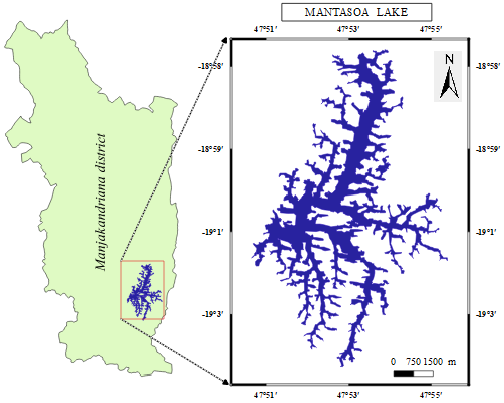 | Figure 1. Location of the study area |
2.2. Data Used
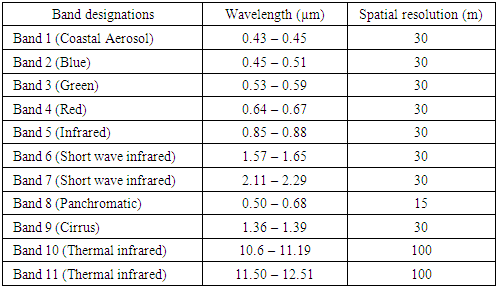
Landsat8 data image products (path: 159, row: 073) were used in this work. The Landsat-8/ LDCM (Landsat Data Continuity Mission) satellite was launched in February 2013 to ensure the mission continuity of Landsat data at a high spatial resolution. Landsat8 carries two sensors on board: OLI (Operational Land Imager) and TIRS (Thermal Infrared Sensors). OLI has nine spectral bands with a 30 m spatial resolution for the eight bands, and one panchromatic band at 15 m. TIRS have a 100 m spatial resolution using two bands between 10-12 µm. The characteristics of Landsat 8 OLI/TIRS data imagery are given in Table 1.Table 1. Landsat8 characteristics (Landsat 8 Data Users Handbook, 2015)
 |
| |
|
3. Methodology
3.1. DOS1 Atmospheric Correction
The electromagnetic signals that the satellite or a sensor records are disturbed by particles suspended in the atmosphere (gases and aerosols). Atmospheric correction is necessary to subtract the diffusion and absorption phenomena in the atmosphere and to convert digital number (DN) to reflectance. In this study, DOS1 (Dark Object Subtraction 1) atmospheric correction was used to reduce the atmospheric perturbations. DOS1 is well accepted by the geospatial community (Song C. et al., 2001) and its surface reflectance is given by: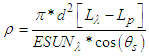 | (1) |
where Lp is the path radiance and  is the spectral radiance at the sensor’s aperture given by Equation (2).
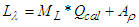 | (2) |
where  is the band specific multiplicative rescaling factor from metadata, Qcal is the quantized and calibrated standard product pixel values (DN), and
  is the band-specific additive rescaling factor from metadata.
3.2. Emissivity
The emissivity is an important parameter necessary to calculate surface temperature using remote sensing techniques. It is calculated using the equation (3) (Sorbino et al., 2008). 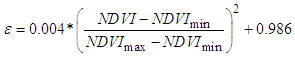 | (3) |
with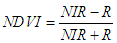 | (4) |
where: NIR and R are the Near Infrared and Red bands respectively,NDVImin and NDVImax are the minimum and maximum values of NDVI.
3.3. Surface Temperature
To extract surface temperature by remote sensing techniques, thermal infrared remote sensing was applied, i.e. the method uses thermal infrared data. It is the only approach possible to extract surface temperature using remote sensing (Coll et al., 2007). The utilization of thermal infrared data allowed to give a direct measurement of the surface temperature (soil surface, water surface, etc.).The definition of brightness temperature was used to derive the relationship between brightness temperature and kinetic temperature. The brightness temperature is the temperature required for a black body to emit energy at the same rate as seen in a gray body (David, A.A. and Walter H. C., 1982). Thus, the radiance for a black body  at a brightness
  is given by the relation (5)
 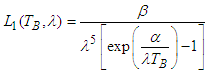 | (5) |
where: 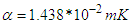 and
and  are constants (David, A.A. and Walter H. C., 1982).The radiance for a gray body at a temperature
  is indicated by the equation (6)
 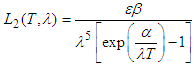 | (6) |
By identifying the equation (5) to the equation (6) and neglecting 1 before the exponential term, the equation (7) was obtained. Previous research used the single channel TIRS data from Landsat8 to estimate surface temperature. In this study the water surface temperature was estimated by the two Landsat8 TIRS channels (Randrianiaina Jerry J.C.F et al., 2018). 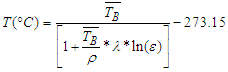 | (7) |
where:  µm.K,h: Planck’s constant (6.626*10-34 J.s),σ: Boltzmann’s constant (1.38*10-23 J.K-1),C: velocity of light (2.998*108 m.s-1),λ=11.197 µm,ε: emissivity,
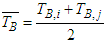 : mean of brightness temperature with TB,iand TB,j being the brightness temperatures obtained from bands 10 and 11 using the equation (8):
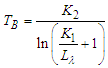 | (8) |
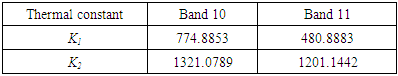
withK1 and K2: Thermal conversion constant given by table 2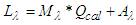 | (9) |
 : Top of atmospheric radiance,Qcal: Digital number,Mλ: Band specific multiplicative rescaling factor from Landsat8 metadata,Aλ: Band specific additive rescaling factor from Landsat8 metadata,
Table 2. Thermal constant
 |
| |
|
4. Results and Discussion
The results obtained using this approach are shown in Figure 2 and Figure 3, which indicate the spatial distribution of the surface water temperature of the Mantasoa Lake. These figures show that the Mantasoa Lake temperature ranged from 17.4°C to 19.6°C on May 27, 2020 and 24.1 to 27.4 on May 30, 2021. It is indicated that the Mantasoa Lake respects the Malagasy norms because these are below 30°C. We mention that higher surface water temperature is in the peripheral of the lake which is shallow. It is noticed the Malagasy decree n° 2003/464 issued on April 15, 2003 concerning water surface classification stipulates that if the temperature is inferior to 25°C the lake water temperature is in a good quality category and in a class of medium quality in the case where temperature value ranges from 25°C to 30°C. 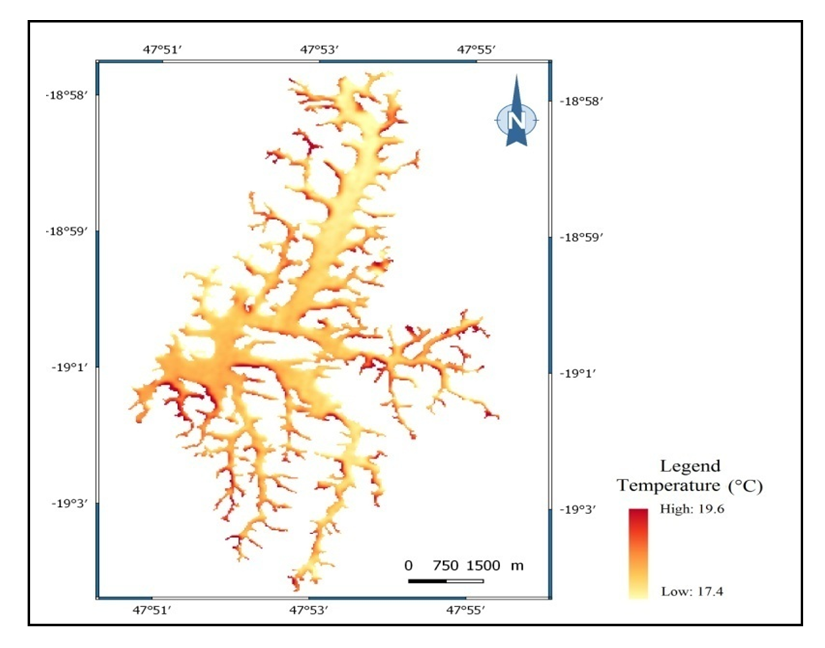 | Figure 2. Map temperature distribution of Lake Mantasoa (27/05/2020) |
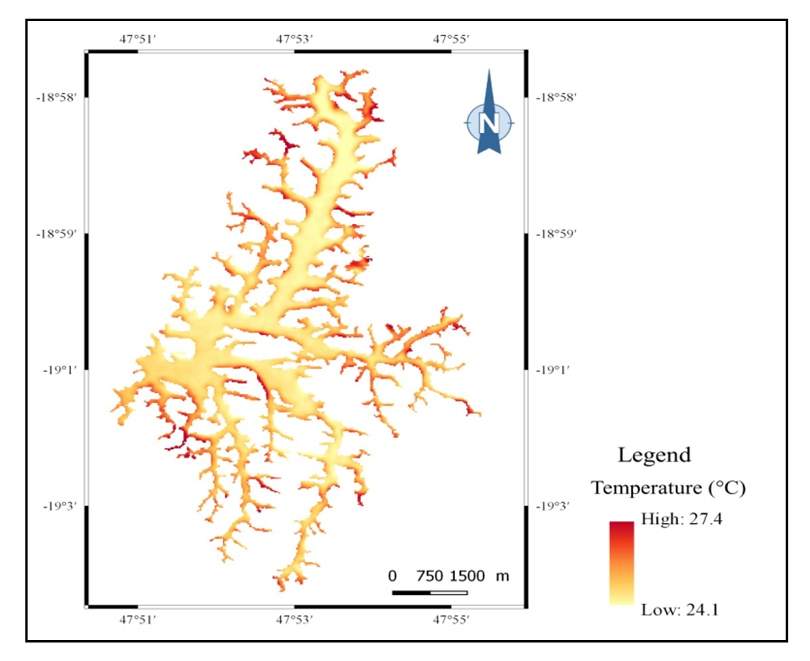 | Figure 3. Map temperature distribution of Lake Mantasoa (30/05/2021) |
The curves in the following Figure 4 show the temperatures measured in situ and the calculated temperatures; a series of 16 measurements were undertaken in this work. This figure shows that there is indeed a concordance between the measured and calculated values. The correlation obtained is strong, equal to 0.955, and the value of the root mean square error is equal to 0.981.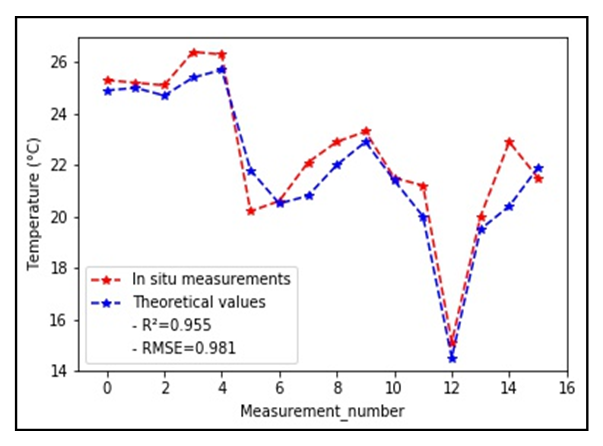 | Figure 4. In-situ values compared with calculated temperature values |
5. Conclusions
Lake water is vital for human and aquatic animals. A knowledge of water quality in regular time is necessary to protect this resource. Therefore, the Mantasoa Lake respects the Malagasy norms on May 27, 2020 and May 30, 2021 regarding temperature. The methodology adopted in this work gives a good concordance between the observed and calculated temperature values of the water surface. In further work, in-depth measurements will be carried out to get a three-dimensional distribution of the lake water temperature.
References
| [1] | Stuart MacCallum and C. J. Merchant. (2012). Surface Water Temperature Observations of Large Lakes by Optimal Estimation. Canadian Journal of Remote Sensing. DOI: 10.5589/m12-010. |
| [2] | Jerry C. Ritchie; Paul V. Zimba and James H. Everitt S. (2003). Remote Sensing Techniques to Assess Water Quality. Photogrammetric Engineering and Remote Sensing. Vol. 69, No. 6, June 2003, pp. 695–704. |
| [3] | Najwa Sharaf; Ali Fadel; Mariano Bresciani; Claudia Giardino; Bruno J. Lemaire; Kamal Slim; Ghaleb Faour; Brigitte Vinçon-Leite. (2019). Lake surface temperature retrieval from Landsat-8 and retrospective analysis in Karaoun Reservoir, Lebanon. J. Appl. Remote Sens. 13(4), 044505. doi: 10.1117/1.JRS.13.044505. |
| [4] | Randrianiaina Jerry Jean Christien Frederick. (2021). Réseau de neurones profonds pour la modélisation de la qualité des eaux lacustres à partir d’images optiques satellitaires: Cas du Lac Itasy et Lac Mantasoa. Thèse de doctorat. |
| [5] | Landsat 8 Data Users Handbook. (2015). Retrieved March 29, from http://landsat.usgs.gov/documents/Landsat8DataUsersHandbook.pdf. |
| [6] | Song, C.; Woodcock, C. E.; Seto, K. C.; Lenney, M. P. and Macomber, S. A. (2001). Classification and change detection using Landsat TM data: when and how to correct atmospheric effects. Remote Sensing of Environment, 75, pp. 230-244. |
| [7] | Sobrino, J.A.; Jiménez-Muñoz, J.C.; Sòria, G.; Romaguera, M.; Guanter, L.; Moreno, J.; Plaza, A. and Martinez, P. (2008). Land Surface Emissivity Retrieval from Different VNIR and TIR Sensors. IEEE Transactions on Geoscience and Remote Sensing, 6, 316-327. |
| [8] | Coll, C. Caselles; V. Galve, J.M. (2007). Ground measurements for the validation of land surface temperatures ferived from AATSR and MODIS data. Rem. Sens. Environ. 97: 288-300. |
| [9] | David, A.A. and Walter H. C. (1982). Survey of Emissivity Variability in Thermography of Urban Areas. Remote Sensing of Environment, 12:313-329. |
| [10] | Randrianiaina Jerry, J.C.F.; Rakotonirina Rija, I.; Ratiarimanana Jean, R.; Lahatra Razafindramisa Fils. (2018). Temperature Retrieval of Lake Itasy Using Remote Sensing. Resources and Environment, 8(6): 241-244. |

 Abstract
 Reference
 Full-Text PDF
 Full-text HTML